ECO11: Econ growth, gov debt. Macro objectives II
1/11
There's no tags or description
Looks like no tags are added yet.
Name | Mastery | Learn | Test | Matching | Spaced |
|---|
No study sessions yet.
12 Terms
How economic growth is measured
Percentage change in GDP or GDP per capita.
Relating Growth in GDP and Growth in GDP per capita. Does GDP per capita always rise when GDP rises?
Growth in GDP does not always mean growth in per capita
It depends on how fast the population is increasing
Explain Long-term vs Short-term economic growth 1) diagram and PPC, 2) explain causes
Long-term growth is also known as potential growth.
PPC: outward shift of PPC
Macro: Increases in LRAS and KAS
Short-term growth is also known as actual growth.
PPC: Point inside, to point closer to PPC
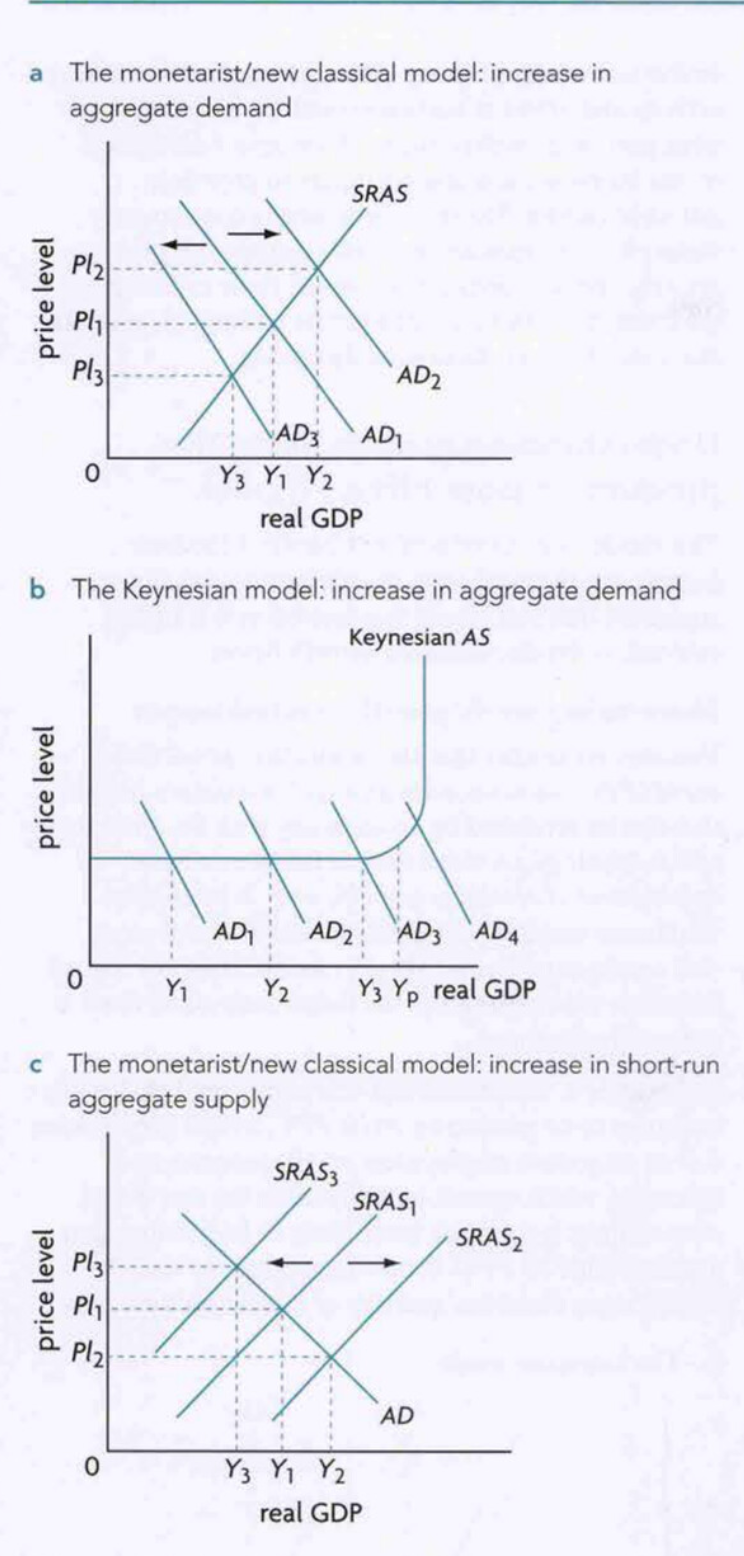
Macro: Increases in AD/Decreases in SRAS (Monetarist only).
Short term growth
Any growth in Y caused by increases in AD or decreases in SRAS (For monetarists).
NOTE that short term growth is more often caused by increases in AD rather than AS. (my guess is because wages are sticky downwards)
Long-term Growth
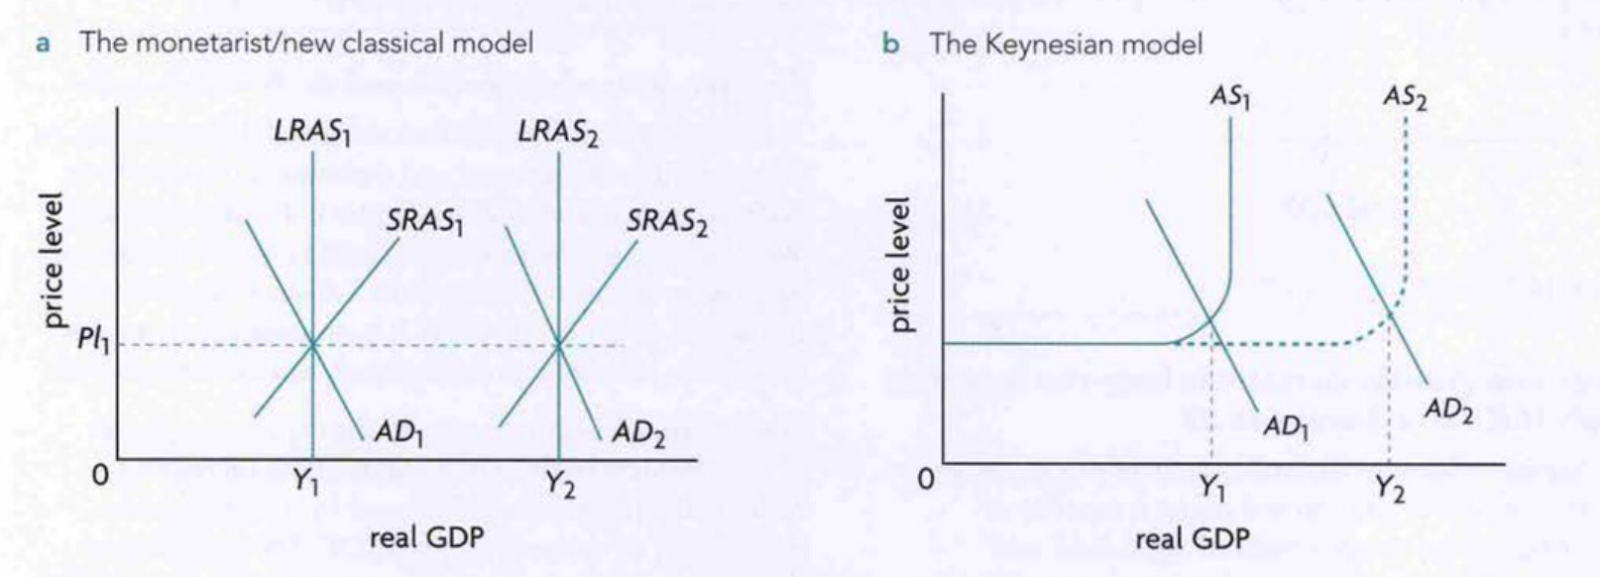
Increases in the LR supply curves and the KAS.
Caused by QQT.
Theory Economic Growth Over Time how does EG theoretically change over time?
Theoretically, economies are supposed to grow and have increasing equilibrium output (rightward shifts in the KAS and LRAS)
This is because the business cycle is upward sloping.
What dictates the consequences of economic growth? Whether they are good or bad?
the ways in which countries approach/use policies to achieve economic growth.
Explain the consequences of economic growth
there are three main 3 ones, and explain what affects whether there is a positive or negative impact of each
Effect on Living Standards
Higher EG results in higher GDP and higher GDP per capita assuming GDP growth exceeds population growth
This indicates that there is greater potential for people to increase their consumption of goods and services, and improve their standard of living.
However, as we said, the ways in which EG is pursued affects this and matters, thus these are the factors that affect whether EG has a positive impact on SoL.
Income Distribution
EG provides more jobs, potential increases in income for the poor HHs. If more income is distributed to poorer households → increase SoL as they need it the most
Household spending
The greater the HH spending on goods like food, education, the greater the impact.
Share of income controlled by women
More explored in C19. But essentially more income by women = greater equity = greater SoL.
Gov spending on merit goods
EG → increase job → increase spending → increase Tax/gov rev.
If Gov spent on merit goods like education → increase SoL as increase employability.
NGO contributions
Effect on Environment
With increased EG, many times in history that has been corresponding to increases in environmental harm.Eg Indonesian polluting tf out of our air with their haze.
Most governments: Pursue growth now, clean up later mindset. Which is unsound, since:
Some damage is irreversible: lives lost due to pollution, loss in biodiversity due to animal extinction, etc.
It is unsound/wrong also because it justifies government inaction.
Then is it always the case that economic growth leads to environmental harm? NO.
Studies have shown that economic growth and sustainability can coexist, something known as sustainable development.
This again depends on the WAY in which EG is pursued, and can only happen provided governments:
Focus on EG through human capital investment (increase quality of workers) which is non pollutive, rather than increasing investment/capital goods.
Governments pursue policies that encourage green change, eg, giving subsidies for green tech, giving land for green tech.
Govs implement market based policies like taxes or subsidies that make the polluters internalise their externalities.
There is a change to the structure of the economy to one that focuses more on providing goods and services that are non-pollutive, eg ocean plastic based shoes.
Effect on Income Distribution
There is no conclusive evidence to suggest any correlation between the two
EG causes some countries to have worse ID while some to have better ID.
Again, it depends on the types of policies/approaches pursued to get EG.
Policies/approaches that lead to better ID amongst EG
Focus more on redistribution
Policies/approaches that lead to worse ID amongst EG.
Use of market-based supply-side policies.
Increasing/encouraging the use of capital-using(labour-saving)/automated machines in sectors like agriculture where there is clearly high amounts of available labour
Focusing infrastructure and services development only in formal/urban areas, ignoring the rural areas and slums.
Explain what is national/government budget.
Government Budget
Budget Deficit: Expenditures exceed revenue for that period (most governments have this)
Budget Surplus: Opposite
Define/Explain government debt.
Def: The amount of money that the gov owns to lenders outside the government itself.
Exp: the collection of budget deficits and surpluses over the long-term is called the government debt.
What is a sustainable level of debt (memorise)
a level of debt where the borrowing government has enough revenues to meets it debt obligations (payment of interest and repayment of the borrowed amount) without accumulating arrears (overdue debt payments) while also allowing economic growth to continue at an acceptable level.
Why governments Borrow?
Governments borrow during deficits or times of recession so they can stay true to their commitments (eg. spending in defense, education, etc.) while not having to increase taxes.
How governments borrow?
Bonds: A promise by the gov to pay the lender certain interest rates at various intervals until a certain date where the money is returned to the bond holder.
Financial institutions, individuals, and foreign entities can purchase bonds.
Bonds is the main way countries lend each other money.
Costs of High levels of Debt. 7
Debt Servicing Costs
Debt servicing refers to the payments that must be made when repaying a loan (eg loan amount + interest)
These costs incur OC for the govs, causing them to potentially forsake social spending and infrastructure.
In addition, debt to foreign countries means gov must use its export earnings for debt serving, resulting in less foreign currency to pay for the importing of much needed capital equipment/goods/services from abroad.
The forgone imports are OC with negative impacts for EG. (learn more in C16)
Poor Credit Ratings
Higher debt → indicative of debt servicing issues, also indicative of higher risks of lending to them → thus govs usually must offer higher repayment interests on further loans to incentivise the lenders to give them money → this increases debt servicing costs.
Impacts on future taxation/government spending
Higher debt → means the government needs to create more surpluses in order to lower or pay off their debt → must either increase taxes to increase revenue or decrease spending, both of which are politically unpopular.
Increased Income Inequality
Higher debt → gov issues more bonds to pay it off → interest gets paid to the lenders who bought bonds (usually higher income people) → income inequality.
Lower private investment
Higher debt → higher risk and uncertainty → investors only invest in short term lucrative projects quick cash outs rather than long term ones crucial to a country’s potential growth.
Possibility of a debt trap
Cycle of debt. Higher Debt to other countries → more foreign currency required, most of the time they refinance and continue borrowing foreign currency → causing even more debt and serving, etc.
Lower economic growth.
Increased taxes and uncertainty result in lower investment.