ap stats midterm (unit 1-7)
1/93
There's no tags or description
Looks like no tags are added yet.
Name | Mastery | Learn | Test | Matching | Spaced | Call with Kai |
|---|
No analytics yet
Send a link to your students to track their progress
94 Terms
quantitative variable
numerical values
categorical variables
takes on groups or labels
association
knowing the value of one variable helps to predict the value of the other variable
if there's no association, the bars should look ___________
the same
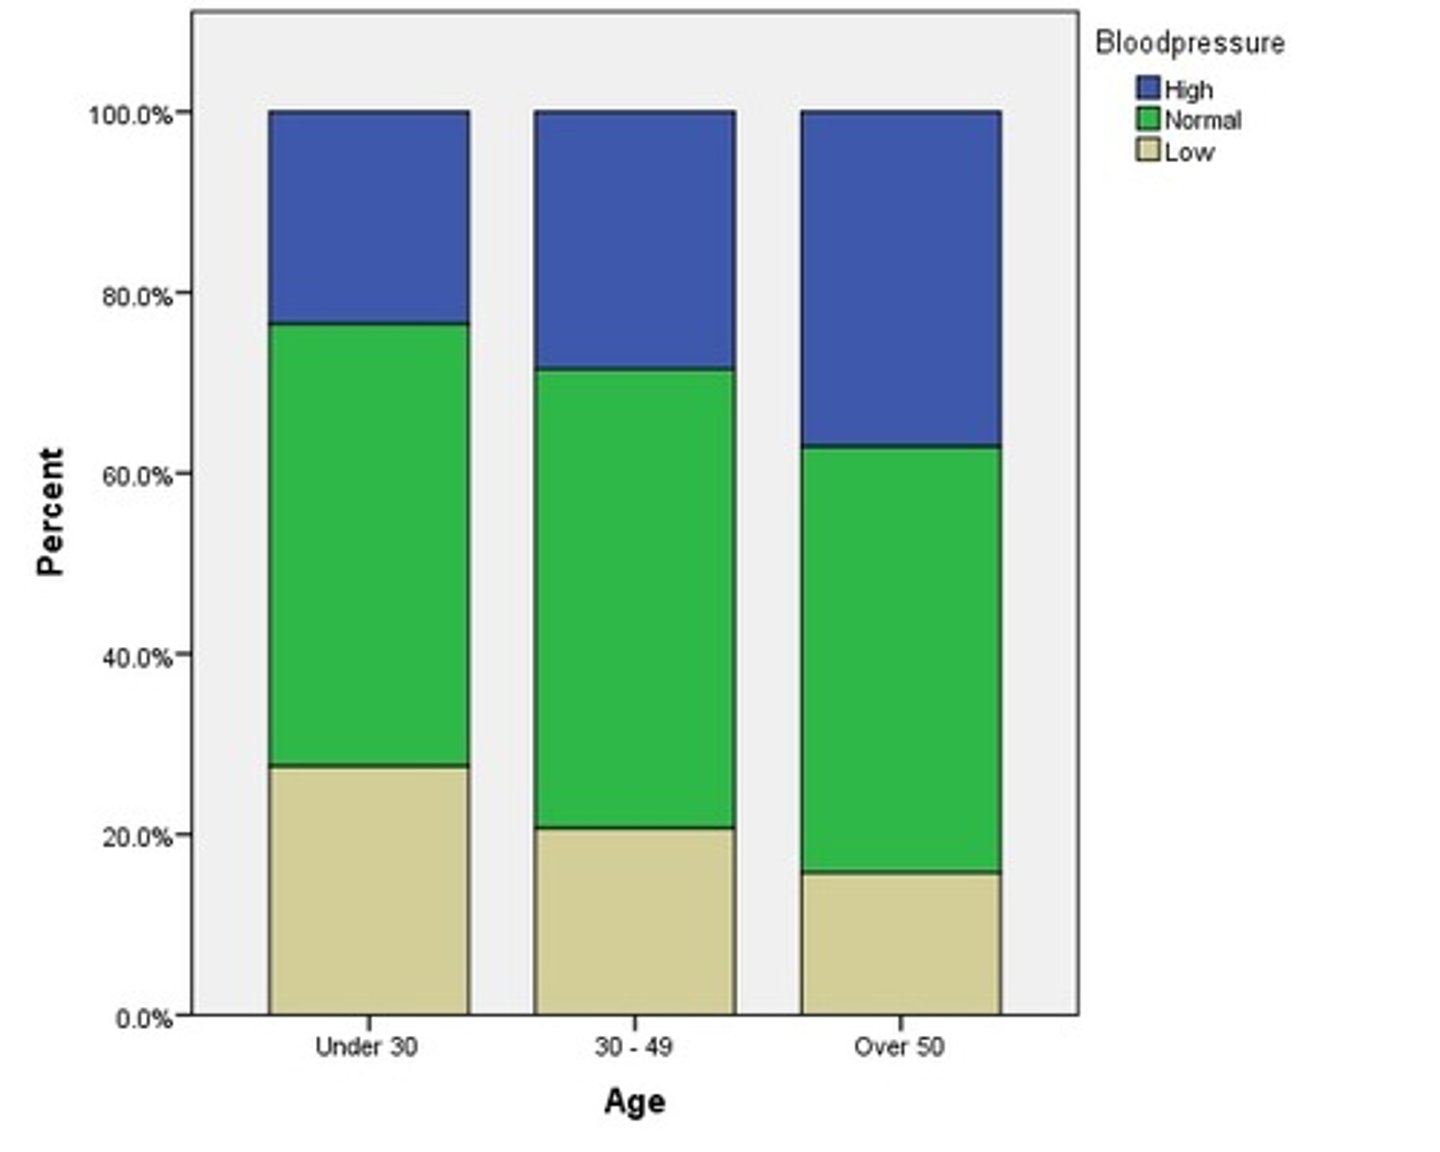
what is a segmented bar graph
bars stacked to make 100%
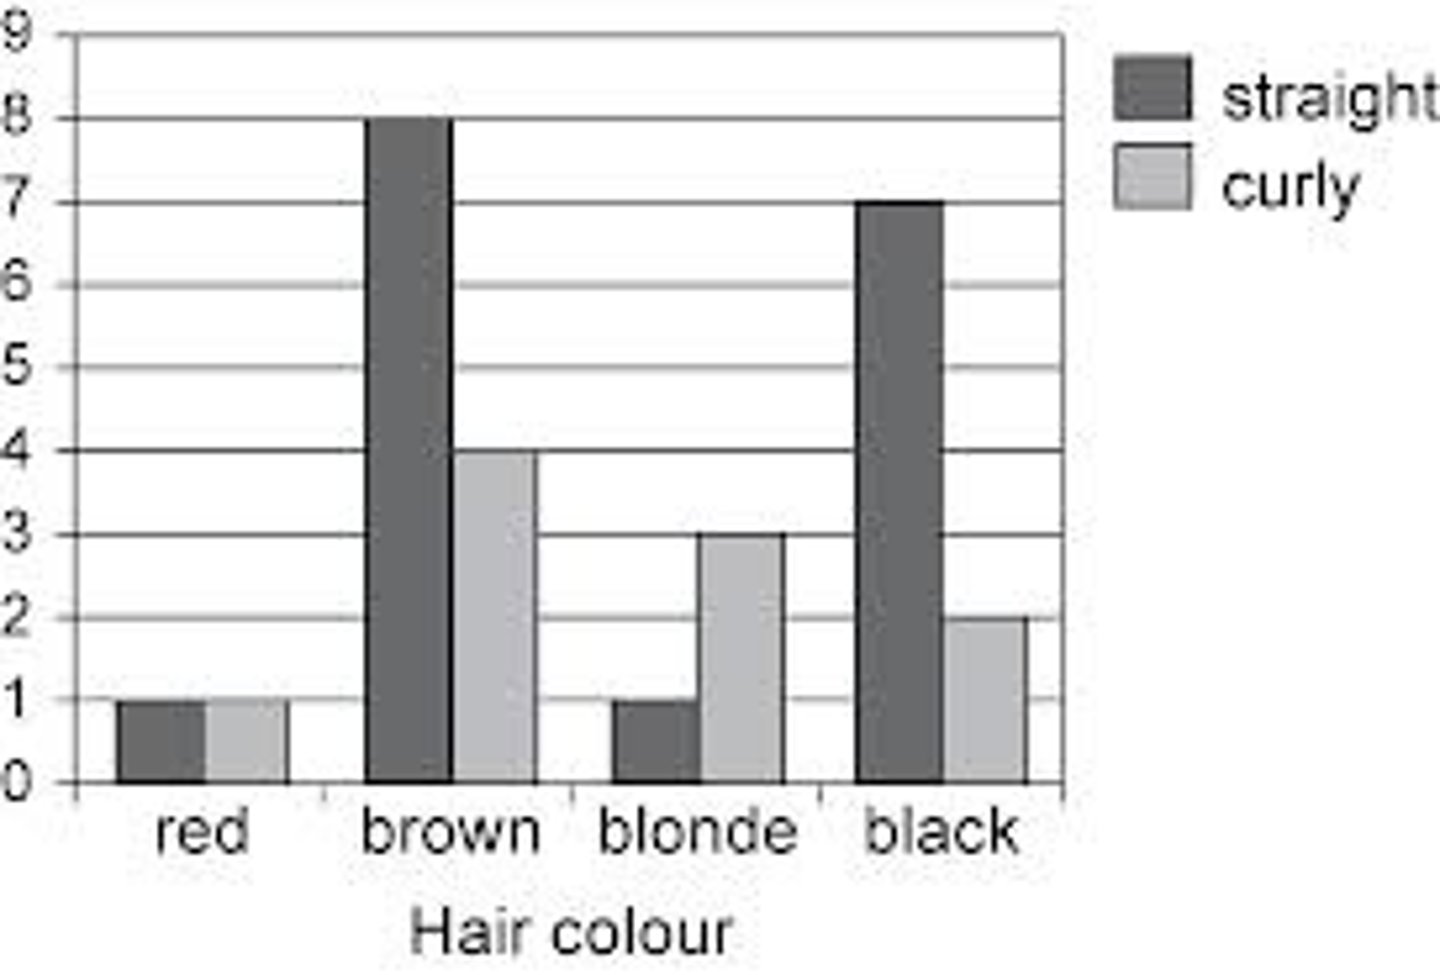
what is a side by side bar graph
a graph where each bar represents the frequency or relative frequency for each group
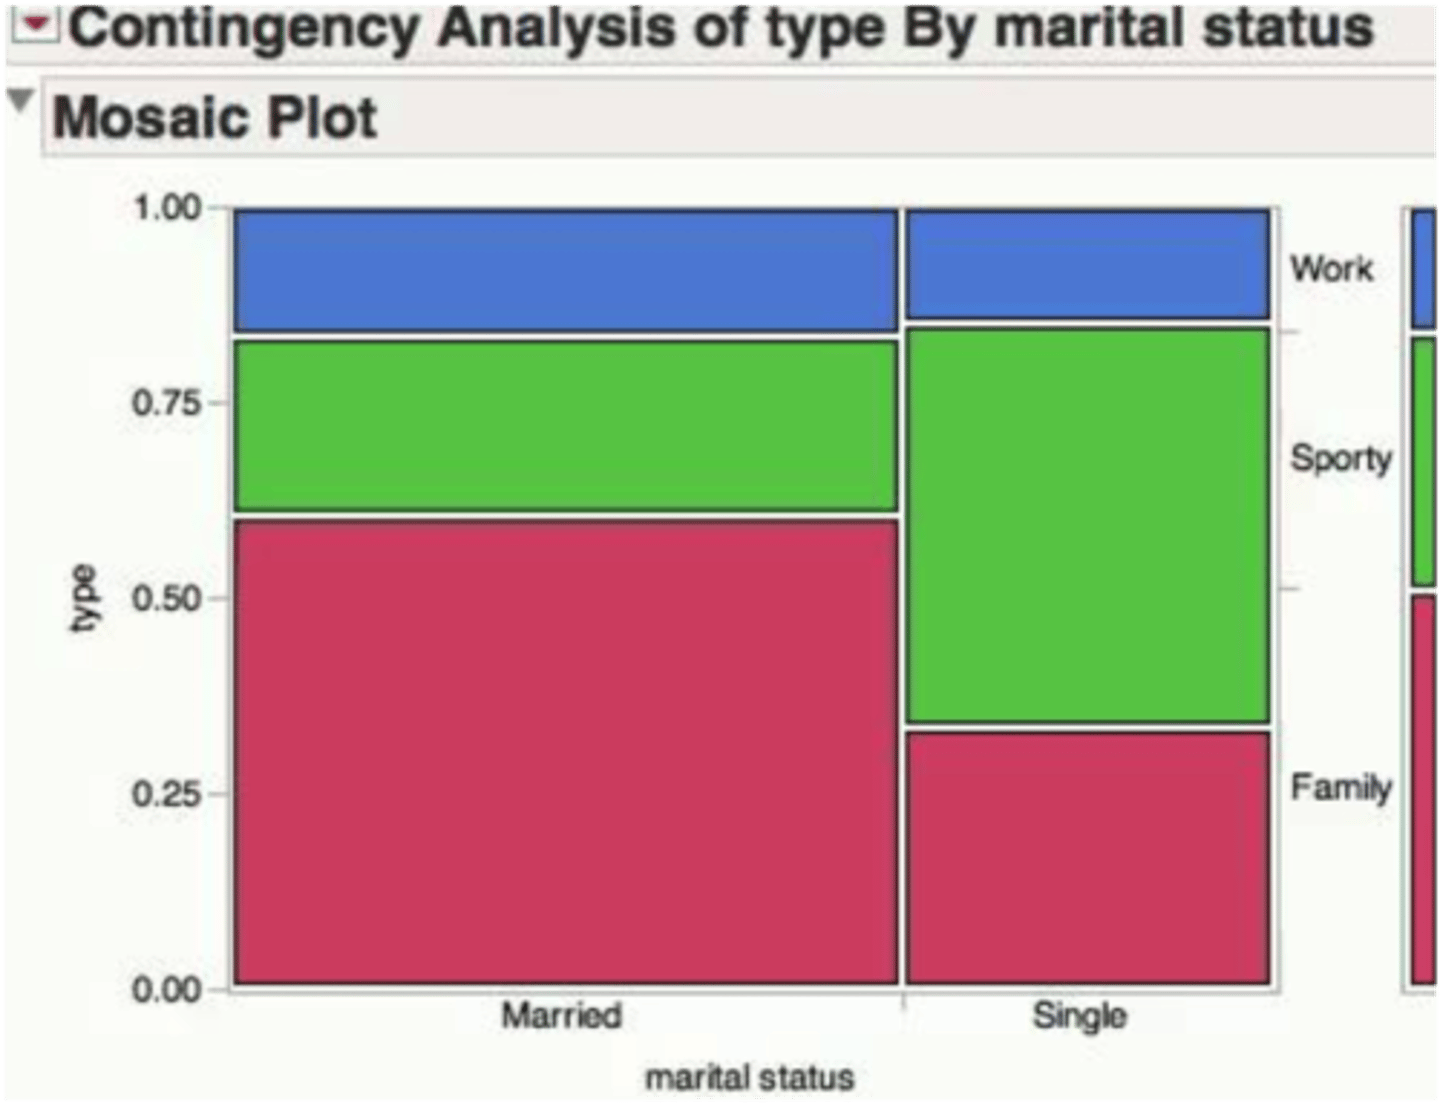
what is a mosiac plot
a segmented bar graph where the bar width is proportional to the group size
what do you use to describe distributions
S: shape
O: outliers
C: center (if skewed, use median) (if symmetric, use mean)
V: variability (IQR)
(remember to add context and use full sentences)
how do you calculate range?
maximum-minimum
what is standard deviation?
how much the data values typically vary from the mean
is the median resistant or non resistant?
the median is resistant and not greatly effected by outliers
are the mean and standard deviation resistant or non resistant?
mean and SD are non resistant, greatly effected by outliers
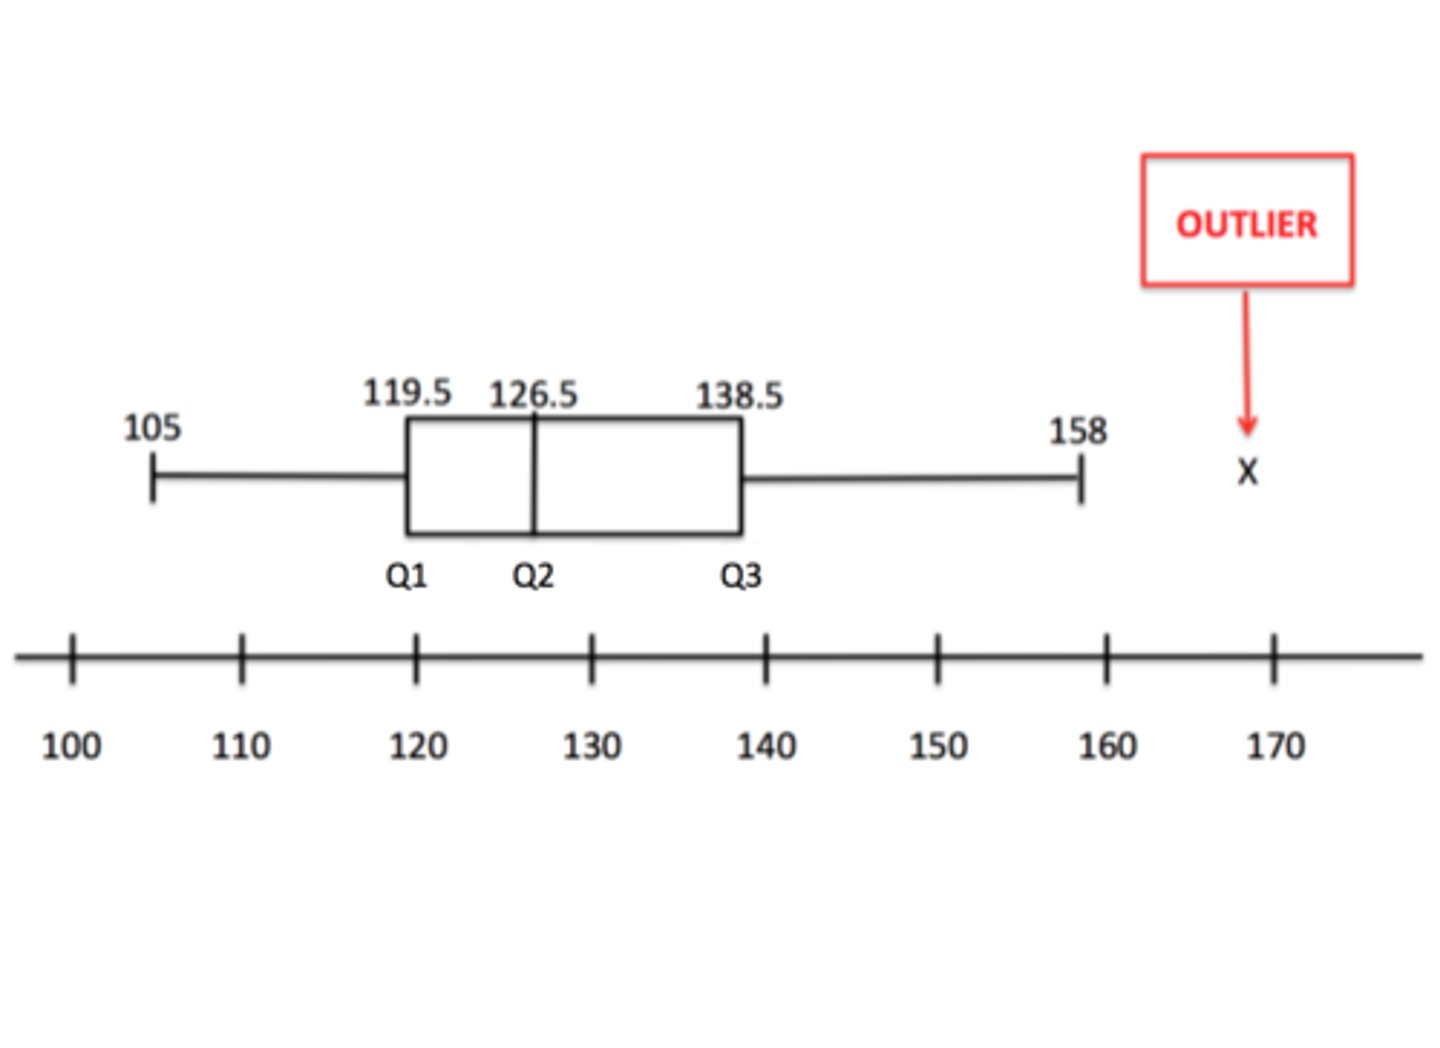
how do you calculate outliers
lower outlier: Q1-1.5(IQR)
high outlier: Q3+1.5(IQR)
what does teh 5 number summary consist of?
minimum, Q1, median, Q3, and maximum
modified box plots show outliers as what symbol?
*
what is a percentile?
the percent of data values less than or equal to a given value
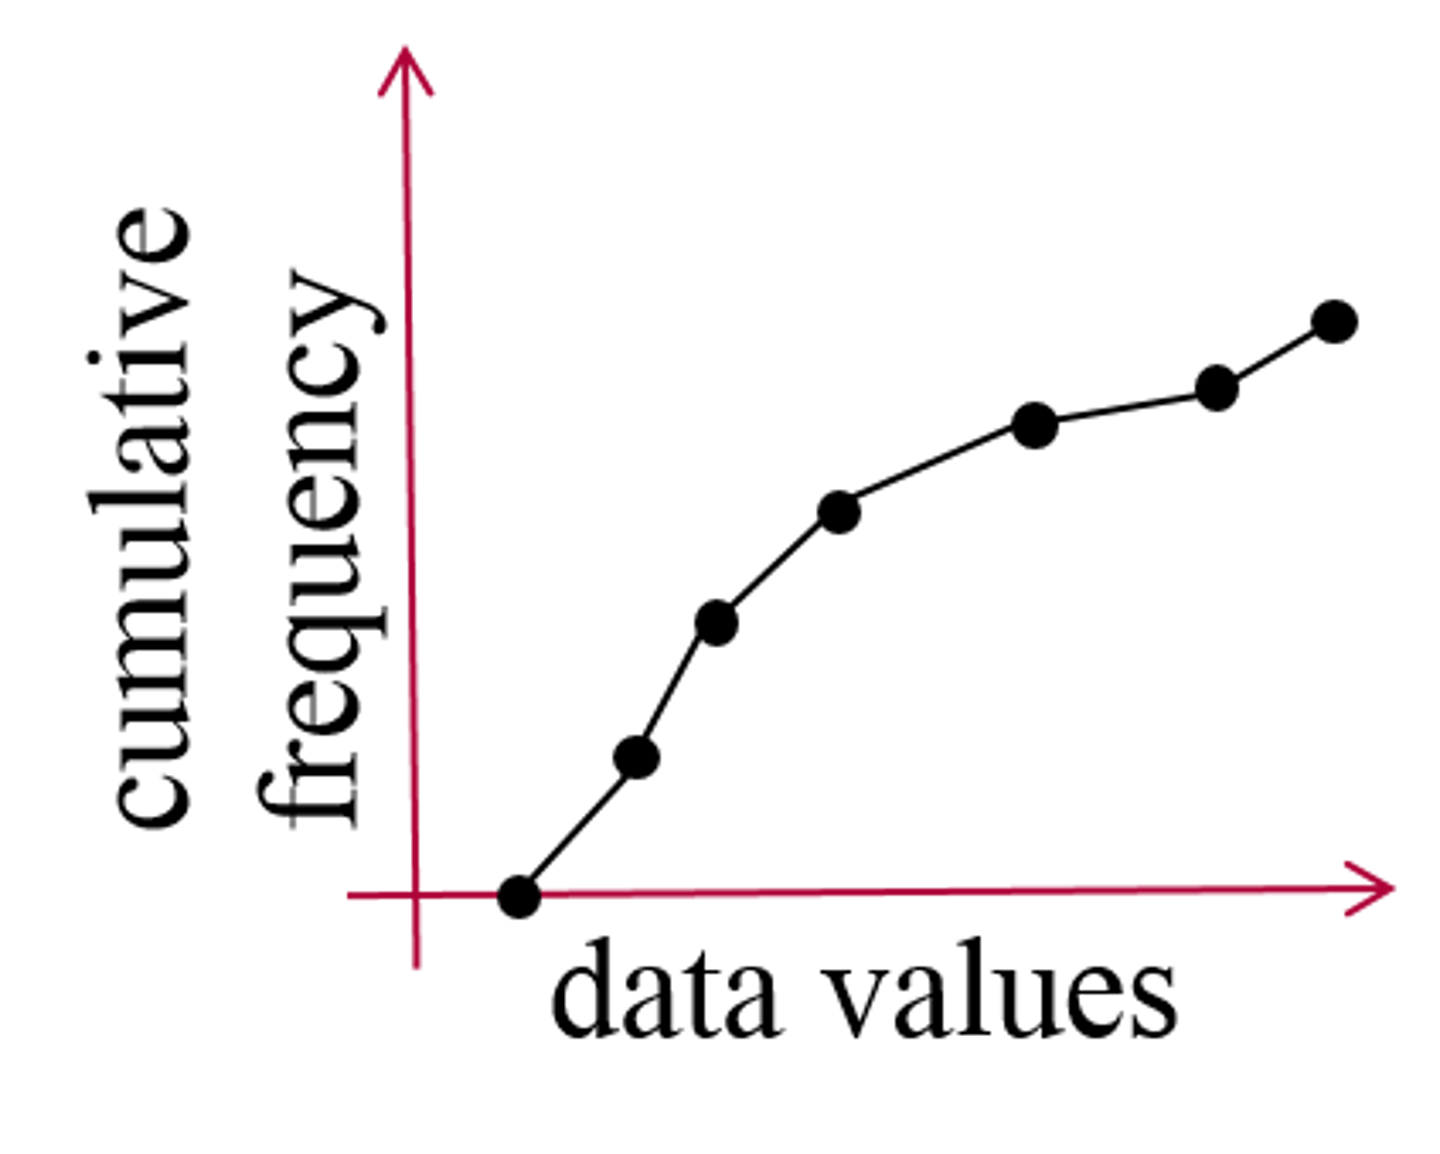
what is an ogive
a line graph that depicts cumulative frequencies (percentile).
Q1=25th percentile
med=50th percentile
Q3=75th percentile
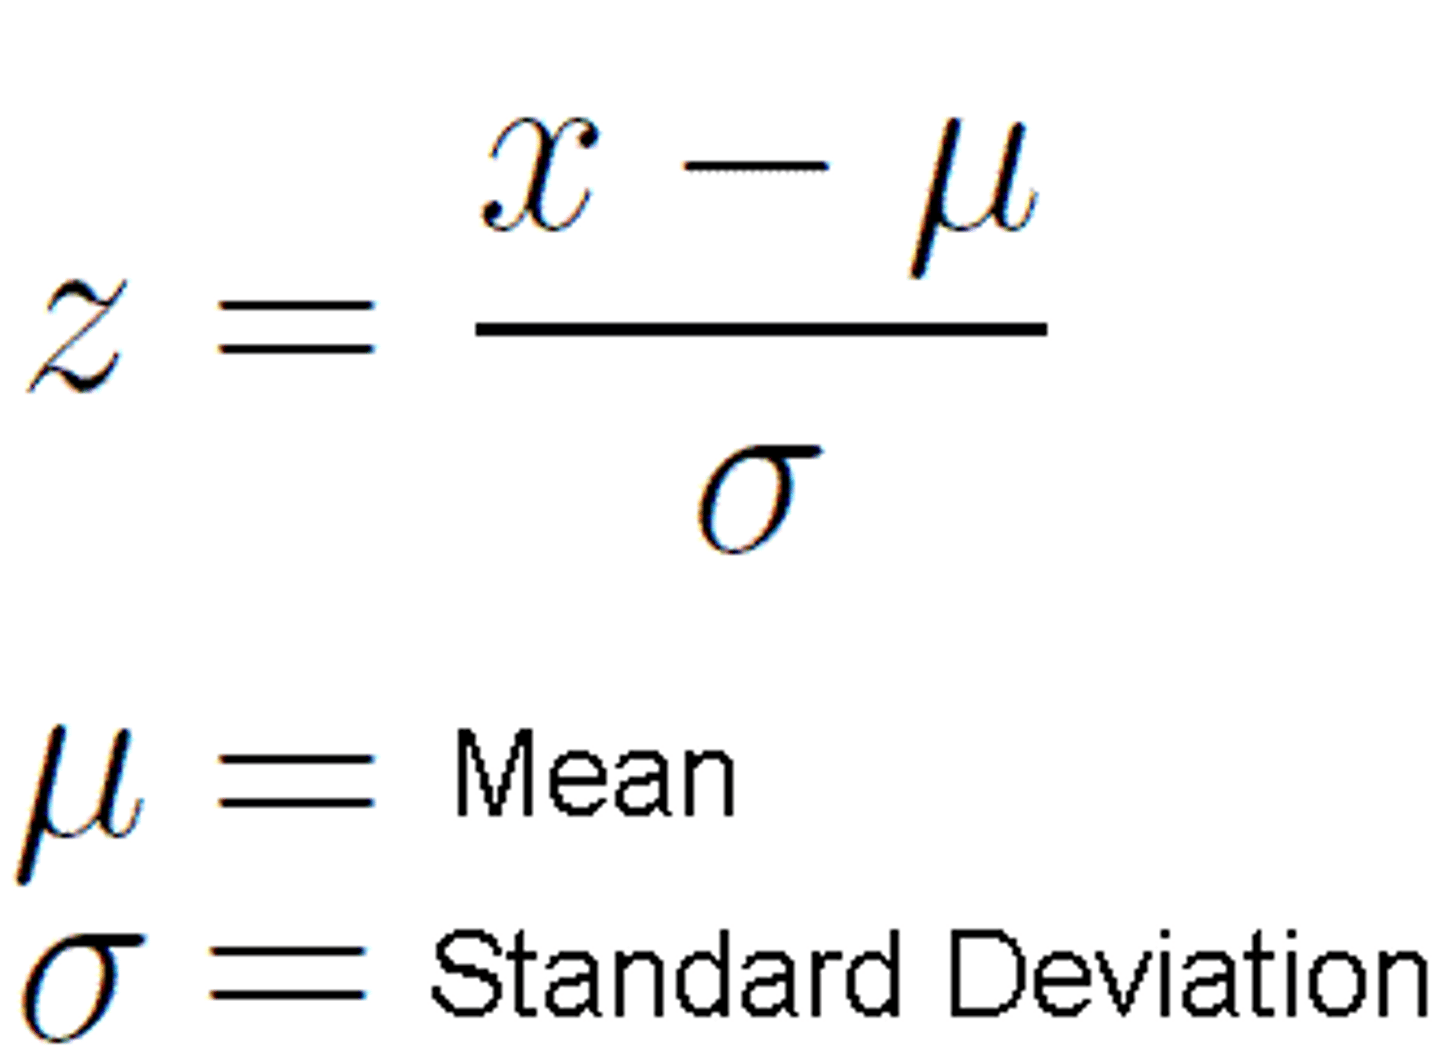
what is the purpose of a z score?
it tells you how many standard deviations above or below the mean a data value is
what is the formula to calculate a z score?
value-mean/SD
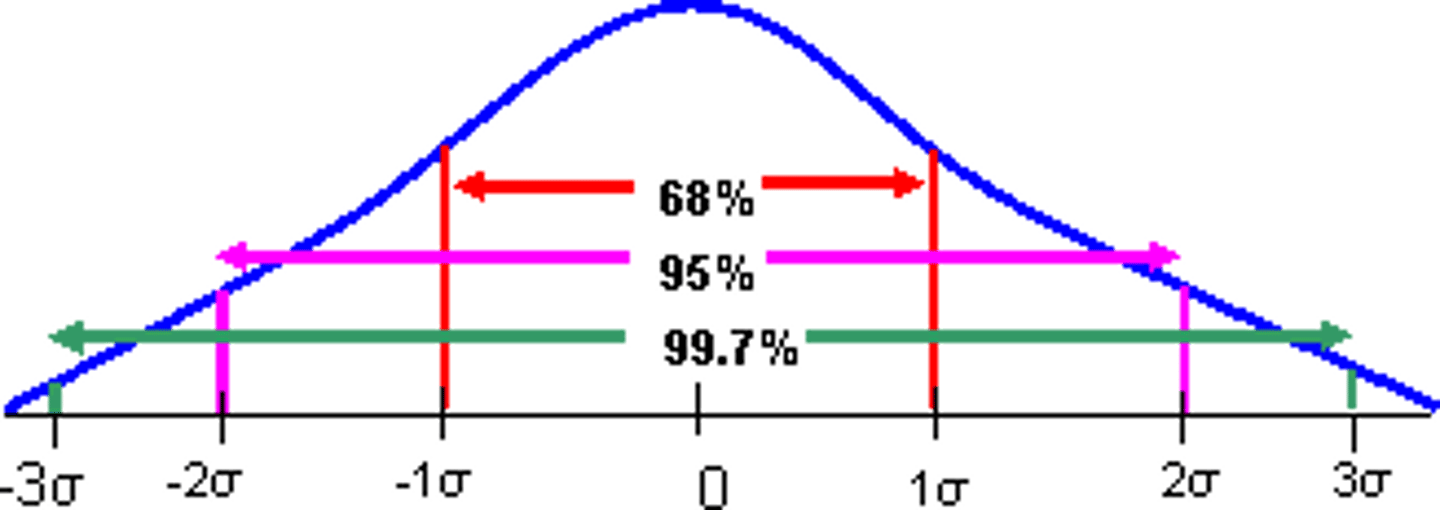
what is the empirical rule?
68-95-99.7
what is an explanatory variable?
(X) is used to predict or explain
what is a response variable?
(y) outcomes of the study/experiment
how do you describe a scatterplot?
D: direction (+/-)
U: unusual features (gaps, clusters, outliers)
F: form (linear/nonlinear)
S: strength of correlation (weak, moderate, strong)
(remember to add context, doesn't need to be full sentences)
what is correlation (r)?
tells you the direction and strength of the linear relationship
interpret correlation (r)
the linear relationship between (x) and (y) is (strength) and (direction)
interpret the coefficient of determination (r^2)
the (%) of variation in (y) can be explained by the linear relationship with (x).
regression line
line of best fit.
y=a+bx
a= y int
b=slope
interpret slope
for each additional (x), the predicted (y) (increases/decreases) by (slope).
interpret and calulate residual
calculate: y-y hat (actual-predicted)
interpret: the actual (y) is (residual) (above/below) the predicted value.
what is the LSRL
least squares regression line. it minimizes the sum of the squared residuals.
how do outliers effect the LSRL?
horizontal: tilt the line
vertical: move line up or down
what is a high leverage point?
point with large or small x values
what point does the LSRL always pass through?
(x bar, y bar)
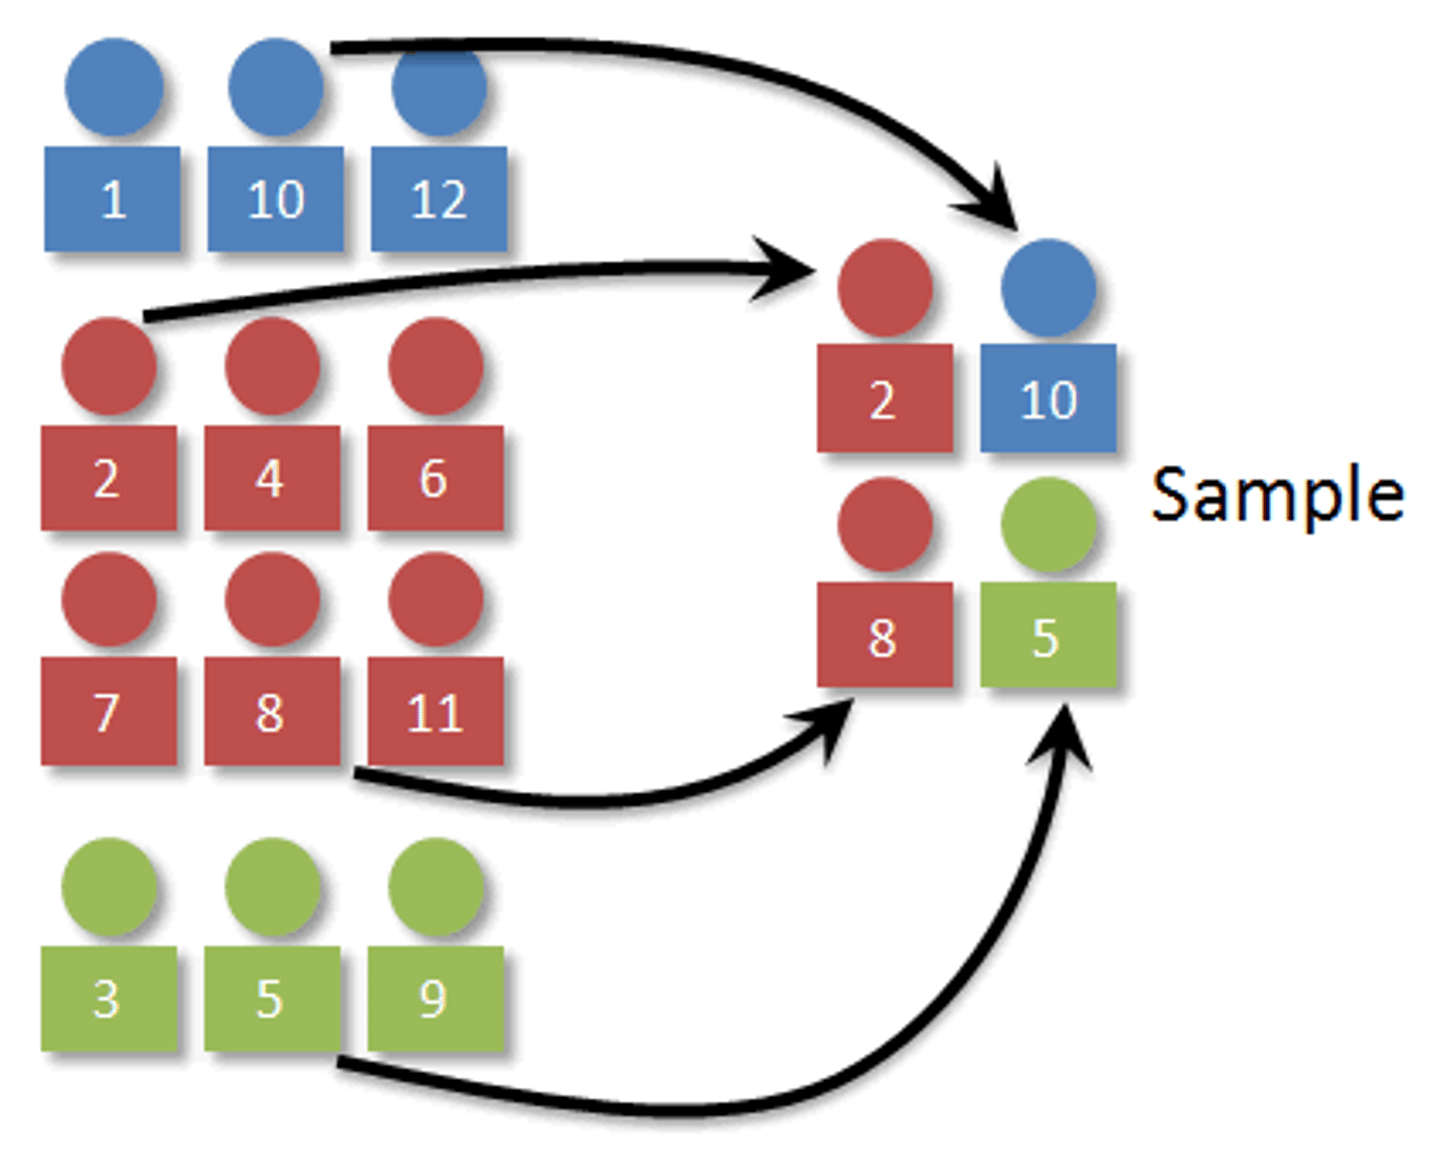
what are the steps to a simple random sample?
1) label (assign random numbers)
2) randomize (random # generator)
3) select (find the thingsthat correspond to the #s)
*no repeats
____________and ________________ are biased and don't represent the full population
convinient sample & voluntary response
what is a stratified random sample?
a sample that split the population into groups (strata) and take the SRS from each group.
-each strata has individuals with similar characteristics
-stratify on a variable that will affect responses
a good sampling method is _________ and _____________.
unbiased, low variability
what is a systematic sample?
choosing a random starting point and using equal intervals. (EX: every 8th person)
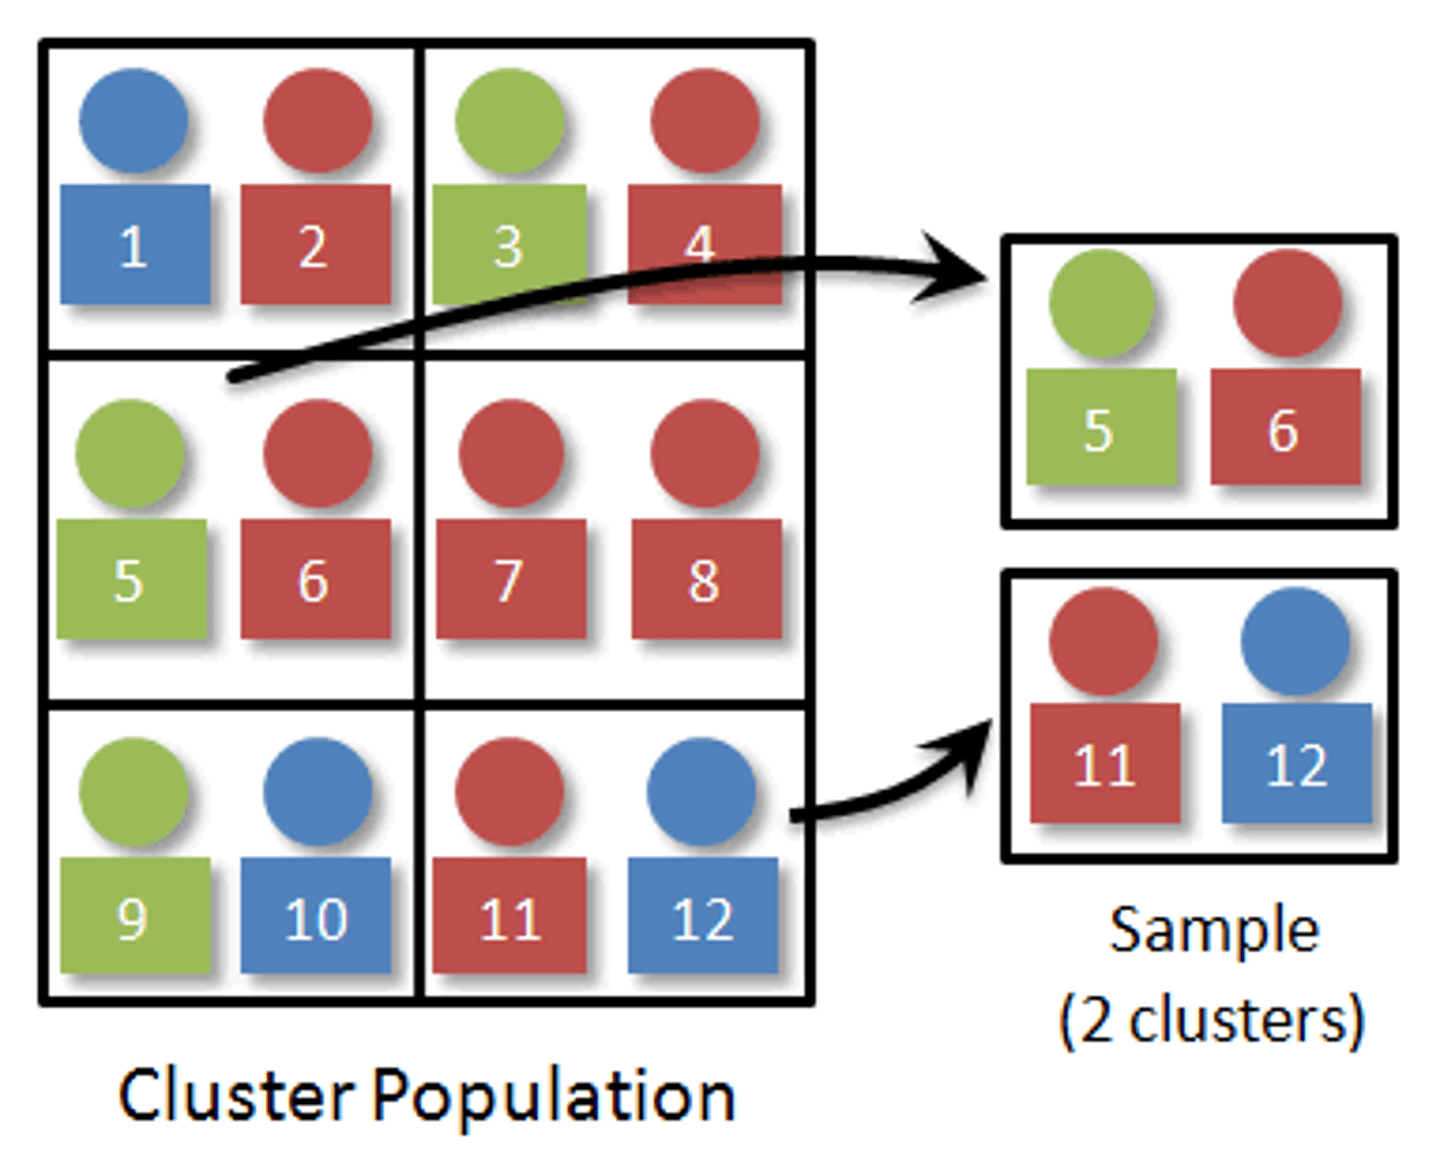
what is a cluster sample?
taking samples from SOME groups
what is a stratified sample?
taking some samples from ALL groups
what is undercoverage?
when some members of the population can't be included in the sample
what is nonresponse?
when an individual chosen for a sample doesn't respond or can't be reached
what is response bias?
-bias in the wording of a question
-interviewer bias
-people lying
what is an observational study?
overserving or using data that was already collected. no treatments are imposed
what is an expiriment
something that can establish cause and effect and impacts treatments
what's a confounding variable?
an outside variable that could influence the explanatory and response variables
how do you design an experiment?
1) random assignment
2) replication (more than 1 in each group)
3) comparison (over 2 treatments)
4) control (other variables stay the same)
how do you design random assignment?
1) label
2) randomize
3) assign
*shows causation
*minimizes confounding variables
what is the placebo effect?
when a fake treatment (placebo) appears to work.
what is a single blind experiment?
the experimenter knows, but the people being tested do not
what is a double blind experiment?
when the subjects and experimenter both don't know the treatments
what are blocks?
groups of subjects that are similar
how do you do a randomized block design?
separate the subjects into blocks, ten randomly assign to treatments in each block.
*block on a characteristic that can impact results
what is a matched pairs design?
the subjects are paired up and randomly assigned to treatments
*similar blocks of 2 OR each subject receives both treatments in a diff order
what does it mean to be statistically significant?
when results of a study are too unusual to happen by chance. equal to or above 5%
do larger samples have more or less accurate results?
more accurate
should different samples give the same or different results?
different results
in the short term, probabilities are...... (predictable or unpredictable)
unpredictable (the opposite is true as well)
what is the law of large numbers?
if we do something many times, the proportion will approach the true probablity
what is a simulation?
an imitation of chance behavior based on a model that accurately reflects the situation. (EX: flipping a coin, random # generator)
describe the simulation process
1) describe how you will simulate one trial
2) perform many trials
3)use the results to answer the question
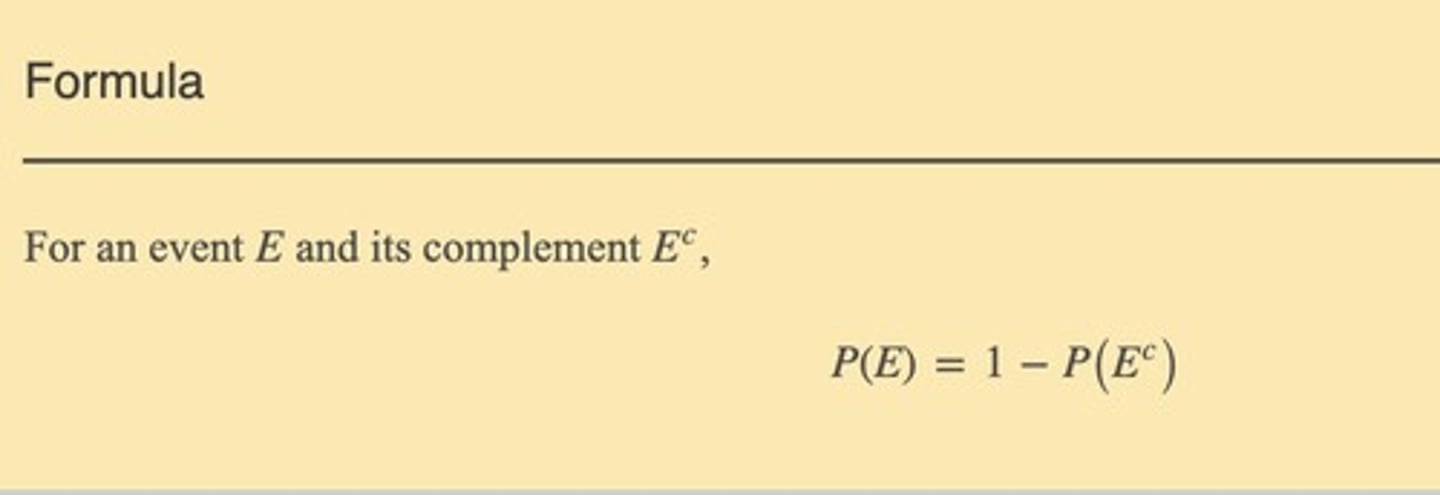
what is a compliment?
the probability of an event NOT happening
what is the formula for the probability of a compliment?
P(A^c)= 1-P(A)
what is a mutually exclusive(disjoint) event?
events that can't happen at the same time
*if mutually exclusive:
P(A or B)= P(A) + P(B)
what is a probability model?
-model that lists all possible outcomes and their probabilities.
-probabilities must add to 1
-all probabilities between 0-1
If A and B are mutually exclusive....
P(A∩B)=0
what is conditional probability?
given that A happened first, what are the chances of B also happening.
P(A/B)
*look at a specific row or column in table
what does indepedent mean?
when knowing one event has or has not occurred, does not affect the probability of the second event.
if P(A)= P(A/B)= P(A/B^c) then A and B are independent
what is the general multiplication rule?
P( A and B ) = P(A) P(B/A)
this is NOT on the formula sheet
if A and B are independent....
P(A and B) = P(A) * P(B)
P(B)= P(B/A)
how do you calculate the probability of "at least one"?
the probability of none
1-P(none)
what is a discrete random variable?
a fixed number of values with gaps in between
what does it mean if a value is continuous?
it has infinite values.
*density curves
how do you multiply standard deviation
add variences and square root it
*don't +/- SD
how do you determine is something is binomial?
B: binary (success and failure)
I: independent trials
N: number of trials is FIXED
S: same probability of success (p)
what do k,p,n stand for?
k=number of successes
p=probability of success
n=number of trials
when P(x=k)...
binompdf(n,p,k)
P(x≤k)...
binomcdf(n,p,k)
P (x>k)....
1-P(x≤k-1)
what is the 10% condition?
when taking a sample w/o replacement we can still use a binomial distribution if your sample size is less than 10% of the population.
if n times p is greater than 10 AND n (1-p) is greater than 10...
can use a normal distribution to approximate a binomial distribution
how do you determine if geometric?
B: binary
I: independent
T: trials til success
S: same prob. of success
in geometric problems, k represents...
the trial of the 1st success
what is a parameter?
a number that describes a population
what is a statistic?
a number that describes a sample
*use a statistic to estimate a parameter
what is a sampling distribution
the distribution of a statistic
what is an unbiased estimator?
when the mean of the sampling distribution is equal to population parameter
what is a biased estimator?
when a statistic consistently overestimates the population parameter
what is the relationship between sample size and variability?
as sample size increases, variability decreases
what does a good statistic consist of?
1) low bias (randomizing)
2) low variability (big sample size)
what condition must be met to use the standard deviation formula?
n is less than 10% of the population
when is the sampling distribution approx. normal for sampling proportions?
n times p is greater than or equal to 10 AND (1-p) is greater than or equal to 10
when is the sampling distribution approx. normal for sample means?
1) it's stated in the question
2) n is greater than or equal to 30 by the central limit theorem
what is the central limit theorem (CLT)?
the sampling distribution of x bar is approx. normal when the sample size is large enough (n is greater than or equal to 30)