W9 te normal curve and z scores
1/27
There's no tags or description
Looks like no tags are added yet.
Name | Mastery | Learn | Test | Matching | Spaced |
|---|
No study sessions yet.
28 Terms
Descriptive vs inferential statistics
descriptive statistics
Used to summarize and describe data with regards to three characteristics
Distribution of values
Central tendency
Variability - std dev and variance
Inferential statistics - based on the laws of probability
Provides a means for drawing inferences about a population, given data form a sample
Used to test research hypotheses
Why probability
is the basis for the normal curve and is the foundation for inferential stats
We estimate population parameters from sample statistics
Allow researchers to draw conclusions (inferences) about a population based on data from a specfici sample
There for , probability establishes a connection between samples nad populations
How probability works
esearcher collets data from one sample ideally representative of the population (probability sample)
Researchers msut decide whether sample valeus (statistics) are good estimate of populaiton parameters
Inferential statistics are used to help the researcher determine the amthematical probability that the findings rflect the actual population parameter vs being due to chance alone
Proabbaility pt 2
laws of proabbility allow estimation of how outcome is
Probability helps to evaluate the accuracy of a statistics and to test hypotheses
Probability helps us increased our confidence that a findings is true and did not likely happen by chance
All probabailities rnage between 0 -100
Proabbility is
Probability outcome = number of outcomes/total number of possible outcomes
Probability and frequency distributions
samples and populaions can be presented as frequency distributions using frequency polygons
The area under the curve of a polygon represents 100% of all cases
Sections fo the area under the curve represent proprortions of call cases
Those proportions provide us with probabilities
Numbers
34.13
13.59
2.15
.13
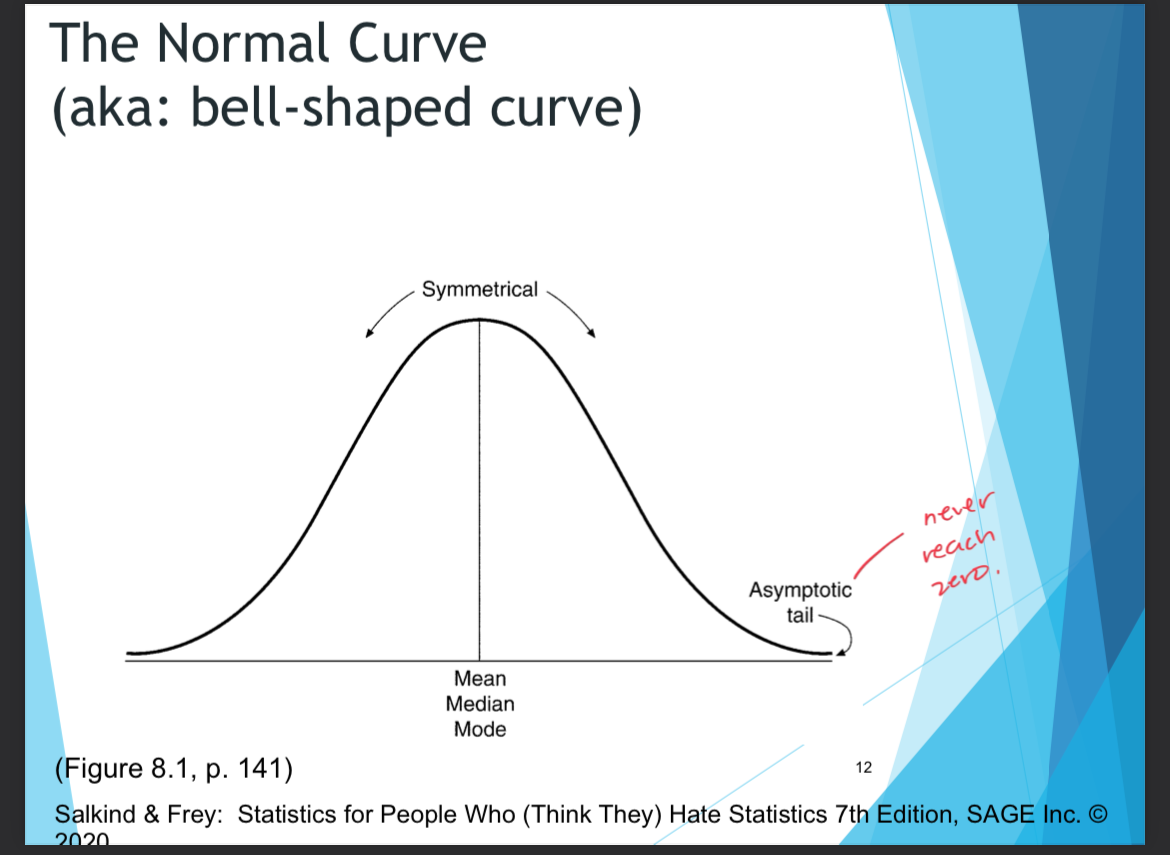
Probability and the normal distribution
the normal distribution is a probability distribution
Characteristics
Mean , meadian and mode and approx equal
Normal curve= symmetrical
Tails of the curve = asymptotic
Event or scores that fal in the middle are more likely to occur than those that fall in the tails
How can scores be distributed
many events occur right in the middle of a distribution with few on each end
Sd and normal distribbution
when we plot a frequency poly gon of a set of scores, the area under the curve represents all of the scores
If the distribution of scores is approx norma, we can determine where ac certain percent of cases is going to fall and we do so by standard deviation
Normal distribution- fixed percent of cases fall wihting certain distances from the mean
Ex. Based on the percentage fo teh scores that are under the curve u add them to bassically say according to this percentage of scores ex. 68 . I will fall between 90-110 ex.
Sd and normal distribution
any normal distribution we know…
34.13 1 sd above or below the mean
13.59 scores fallbetween 1 and 2 sd above or below the mean
2.15 of scores fall between 2 and 3 sd below or above the mean
0.13 of scores fall below or above sd 3 the mean
Info! Did u notice that only specific scores gave us a percentage
so far we have seen that given a mean and a sd we cna assume that the raw scores at sd 1-2-3 adn -1-2-3
This sd gives us teh exact percentage/probability of obtaining that scores
How do we calculate a raw scores percentage when. It does not fall on the line - our queen z scores duh
Z scores know how to *** - we do this when the numbers dont fall on the standard deviation
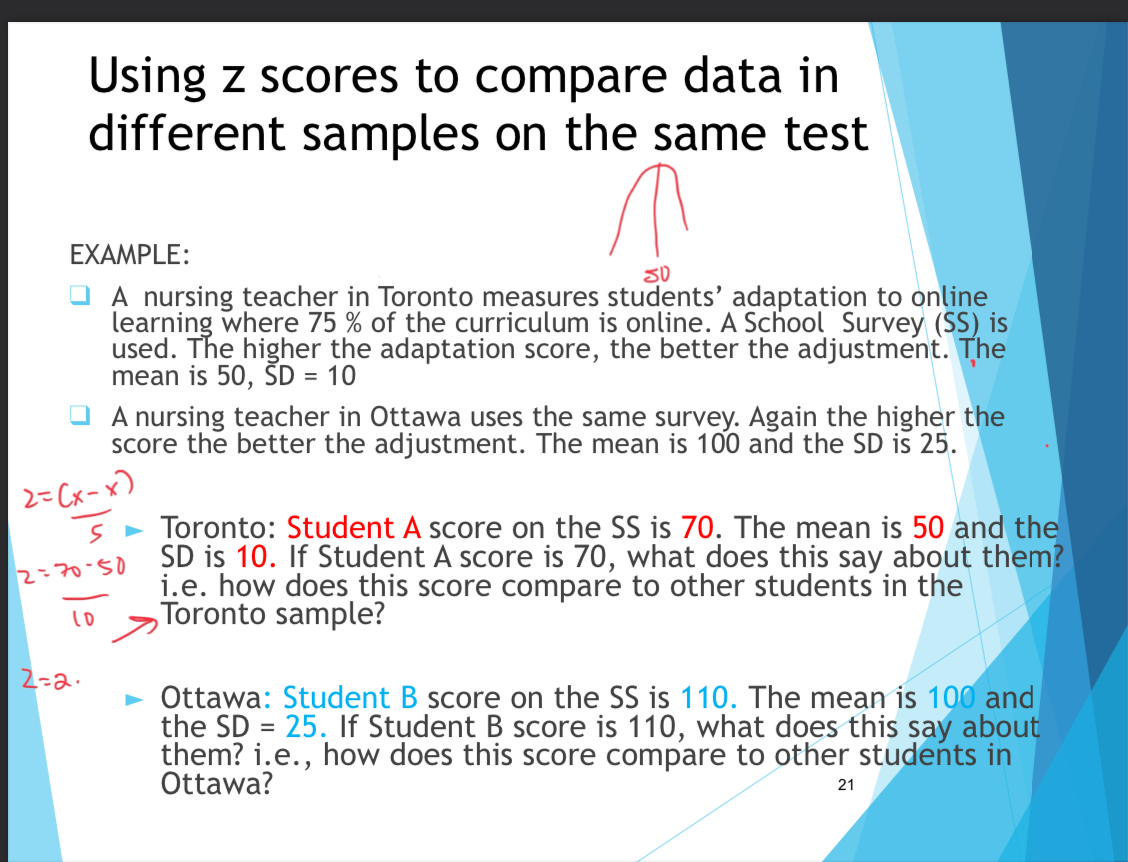
what happens when you want to compare scores from two different distributions
Convert scores to standard z score
Formula
Z = (x-x)/s
S is the std dev
What is the z score formula
Z= X-X/s
Z = this is he z score
X is the individual raw score
X is the M of the distribution
S is sthe standrad deviation
The numerical value of the z score tells u the number of standard deviations away from the mena the individual score is
The advantage of this process is that it is possible to compare distributions even though they may have been quite different before standardization
Using z scores to compare data in different samples on the same test
pIcture
when would i use a z score and when would i use a frequency polygon
using a frequency polgyon when u are wanting to displaying the data of one set of data to analyze trends and stuff done to visualize
U use a z score when wanting to comapre results fm two different sets or mroe ig
Summary why do we standardize distributions
tehse standard distributions are used to amke dissimilar distributions comparable
Also rememebr that the sd describes an entire distribution of scores dn does not tell us the exact location of each score
Z scores tell us exactly where an individual score is located
Therefore is makes it possible to comapre different scores or different individuals even though they may come from completely differen distributions
To do thisthe invidiual scores are converted to standard scores - sd units reported in
Most common form of standard score is z score
Becuase all z scores distributions have the same mean of 0 and the same sd 1 and the z score distibution called standardize distribution
Smpling distributions
samples should be selcted from the population such that they match as closely as possible ot characteristics of pupoplation
Sample emans tend to approx populaion mean
We want to amke inferences from sample to population
Sample characteiristics are rarely identical to population characteristics (select group of individuals with different scores)
A measure of how well a sample approximates teh characteristics of a population is called - sampling error
Reseachers have a way to measure sampling error through whats called standard error of the mean SEM or standard error
What is standard error of the mean
detemrine that
Sampling distributions fo means follow a normal curve and
The mean of a sampling distribution for an infinite number of sample emans equal the population mean
But they seperate samples will likely be different even though they are taken from the samepopulation
However the sample means tend to approximate the population mean
Samples are supposed ot be representative of the population
About the standard error of the mean pt 2
the sem is a measure of variability between teh difference ebtween a sample mean and a population mean
The word error signifies that the various means in the sampling distribution have some error as estimates of the opulation mean
Sem is an estimate or how much sampling error there would be from one sample mean to another
The smaller the sem the more accurate teh sample mean estimate ofthe population mean
This is ebcause the SEM is a function of sample size, researchers only need to increase hte sample size in order to increase the accuracy of their estimate
Inferential statistics
based on alws of probabaility and sampling distributions
Used to make inferences from a small group (sample) to a larger smaple (population)
We estimate popultion parameters from sample statistics
Inferential statistics which are based on the laws of probabilty providea means for drawing conclusions about a population , given data from a sample
How inferential statistics works
reseachersolelct data from one sample - ideally representative fo the population (probability sample)
Researchers msut decide whether sample values (staitics) are a good estiamte of population parameters due to sampling errors
Inferential statistics help the researcher determine the likelihood (probability) that study findings reflect the actual population parameter vs being due t chance
Inferential staistics provides objective measures researcherscan compare study findings with to determine the probability that thier findings occured by chance
What is the concept ofsignificacne
this is likely due to some systematic influence ex. Treatment or intervnetion and not due to chance alone
Bcause we are basing our decision on probabilities we can never be 100 certain that we are making the correct decision regarding the null hypothesis
Errr is always possible and a reseacher needs to decide the amount fo chance or risk they are willing to take that an error will be made
This amount if the significance level
The risk associated ith not being 100 positive that what occured in the experiment is a result of the treatment or interveniton
Significance level - alpha
refered to as alpha
Most commonly used levels for alpha are .01 and 0.5
Used to determine whether to accept or reject the nul hypothesis
Set by the researcher before calculating statistical tests and reflects the probability of making a mistake by rejecting the null hypothesis when it is true (type 1 errors)
The stricter the criterion for rejecting a null hypothesis , the greater the proabbility of accepting a null hypothesis when it is false (type 2 error)
Therefore lowering the risk fo a type 1 error increases teh risk of a type 2 error
Alpha levels
an alpha level is used to find the boundaries seperating the msot unlikely improbable values form th most likely probaby values
A significance level fo 0.5 indicates the risk ro probability is less than 5% that the findings were due to chhance alone this means we are accepting the risk that out fo 100 samples drawn from a population a true null hypothesis would be rejected only 5 times (type 1 error)
With a 0.01 alpha level, the risk fo a type 1 error is lower in only 1 sample out of 100 would a true null hypotheesis be rejected
Reporting significance in research reports
the level fo significance a researher is using for hypothesis testing should always be reported
Tatistical significance vs clinical significance
a statistically significant result means what the researcher found is not likely due to chance alone
But statistical significance must be interpreted within a particular context of meaning
With very large samples, evven small meanginingless differences or relationships may be statistically significanct
Statisticall significance does not tell u abt clinical imortance or meaningfulness of the results
A reader should always ask are tehse findings clinically meanining ful?
Degrees fo freedom
based n on or depends on the sample size
Formula is differnt for each statistical tets
Important for determining statistical significance of tests
Two tailed and one tailed testst
two tailed - non directional hypothesis
Hypothesis testing in which both tails (criticla regions) of the sampling distributions are used to define the region of improbable values
One tailed tests - dierctional hypothesis
Critical region fo improbable values is entirely in one tail of the distribution - the tail corresponding tothe direction of the hypothesis
Must have strong absis for directional hypothesis and assume that findings in the opposite direciton are virtually impossible
What is the criticla region
for alpha as .05 the distribution is divided into 2 secitons 95 and 5
Critical regions are in the tails - extreme and very unlikely (accept the research adn reject the null
High probability saples are located in the centre fo the distribution adn have sample emans close to the value specificed in the null hypothesis
Low probability samples (very unlikely to be obtained by chance ) Will be located in the critical region (extreme tail fo the distribution)
If teh value falls into the tail section then we reject the null hypothesis and conlcude that the treatment /intervnetions likely had an effect on teh dependent variable adn it was unliekly that the results happened by chance alone
if using a two tialed distribution then 5 is split between the two extrme tails of th distrbution so there is eaxctly 2.5 in each tail or critical region
Ifu are using a one tailed distribution. The 5 is contained in one extrmee tail criticalr egion
differnet statistical tests use different statistical tbales and distribution curves
How u display critical regions will