Induction Flashcards
1/42
There's no tags or description
Looks like no tags are added yet.
Name | Mastery | Learn | Test | Matching | Spaced | Call with Kai |
|---|
No analytics yet
Send a link to your students to track their progress
43 Terms
what are the 3 variables
what is operationalisation
independent variable: change, often manipulated by researcher
dependent variable: measured, result of IV
extraneous variables: controlled variables so you can infer cause and effect
operationalisation: making variables memorable
DV: number of....in a time frame, rating on a scale of 1-5
IV: e.g less than 3 hours sleep vs 8+ hours
lab experiments
IV changed by researcher, environment: lab or artificial, randomly allocate each condition
+can replicate to check if reliable, control extraneous variables
-risk of demand characteristics, psychological harm from IV, environment different to in real life so low ecological validity
field experiments
IV changed by researcher, in natural environment
+natural so more realistic so more valid, less risk of demand characteristic
-psychological harm from IV, harder to replicate, difficult to change extraneous variables
Quasi experiments
Iv is a pre-existing difference e.g age, gender
+more ethical as IV isn’t manipulated by researcher so no psychological harm
all other ± are the same as lab/field depending on environment
natural experiments
IV changed naturally and would still occur without researcher
+ethical bc psychological harm caused by researcher manipulating IV
+less demand characteristics→internal validity
+natural so higher ecological validity
-difficult to replicate→cant check if valid or reliable
-difficult to control extraneous variables to infer cause&effect
demand characteristics
when participants guess the aim of the experiment and change behaviors to how they think helps participants
‘screw you effect’- demand characteristics to ruin the experiment
define: ecological validity
whether results can be generalized(applied) to real life life outside of the experiment or not
lab experiments have low ecological validity
define: cause and effect
if control over extraneous variables is high then we can infer cause and effect, meaning the IV caused the DV
ethics
issues mentioned by British Psychological Society
for all issues, a cost-benefit analysis should assess if ethical issues are worth it for the results
acronym ‘Drip C’
Deception & debriefing- researchers should avoid deception unless reasonably acceptable to prevent demand characteristics. After, participants should be debriefed(told the true aim of the study) and have the right to withhold their data
Right to withdraw- participants should be clearly told that they can leave whenever they want without negative consequences. This should be written on the consent form
Informed consent-participants should be told the aims of the study(when possible) and complete consent forms first
Psychological and physical harm- researcher should stop the study if any more harm than in everyday life occurs. Participants have the right to withdraw. Debriefing after should reassure embarrassed or concerned participants
Confidentiality- participants should be known by numbers not names
what is a hypothesis
a clear statement predicting an experiment’s outcome
written in future tense
has operationalised variables
you should always do 2 hypothesis : one null and one alternative
-pick 2 tailed if previous research is inconclusive/mixed, or there is no previous research
-pick 1 tailed if previous research shows the direction of the effect
1 tailed/directional hypothesis
predicts the direction of the effect/difference
write a ‘DV sandwich’
IV condition 1 will have a greater/lower number of DV in a time frame than IV condition 2
2 tailed/non directional hypothesis
predicts a difference but not in a particular direction
There will be a difference in the DV between IV condition 1 and IV condition 2
null
predicts IV/difference between condition 1 and 2 has no effect on the DV
There will be no difference in the DV between IV condition 1 and IV condition 2
research methods vs research designs
research methods- lab, field, quasi, ect
(experimental)research designs- matched pairs, repeated measures, ect
repeated groups design
same participants used in both conditions, so all experience condition A and then all experience condition B
+individual differences/participant variables are constant as all participants are in both conditions so cause and effect can be inferred
-demand characteristics→exposed to both parts of IV so easier to guess the aim
-need different tests of the same difficulty→unlikely so could become an extraneous variable
-order effects e.g bored or better bc of practice on the second condition
this is reduced by counterbalancing: splitting the group into 2 and first half do condition A first, then condition B, and second half do condition B first and then condition A
independent groups design
different participants in each condition e.g half experience condition A and the other half only experience condition B, randomly allocated to present the sample being unrepresentative.
+no order effects bc each participant only experiences one condition
+demand characteristics aren’t a problem bc participants are only exposed to one part of IV
+same test e.g. same words used in each condition→not an extraneous variable
-participant variables aren’t kept constant bc different participants in each condition
matched pairs design
matched participants w important characteristics that may affect performance so different but similar participants for each condition e.g memory tests w different music but both have the same IQ
+participant variables are kept constant bc important characteristics are matched between participants
+no order effects bc each participant only experiences one condition
+no demand characteristics bc participants are only in one part of IV
-participant variables can never be fully matched in all respects bc they are different people
-matching participants is time consuming and difficult so rarely used in real life
random sampling
all members of target population have an equal chance of being picked e.g pick out names from a hat
+best chance of being unbiased
+representative sample bc everyone has an equal chance of being picked
-time consuming & expensive to compile a list of everyone in target population so rarely used
stratified sampling
divide the target population into important subgroups and select members from each category in the right proportionn
+representative of target population so results can be generalised
-impractical bc its difficult and time consuming to identify subgroups in target population
opportunity sampling
select participants who are available at the time e.g unis using psychology students
+quick, convenient and cheap→no advertising or complicated selection process
-unrepresentative and biased→usually students who take part(more educated than other groups)
volunteer/self selecting sampling
people volunteer e.g. those who respond to ads in the newspaper
+convenient→just wait for replies
+ethical→informed consent before study
-people who volunteer are usually more kind and outgoing→unrepresentative→can’t generalise results
systematic sampling
select every nth person(n=consistent number) e.g every 6th
+uses an objective system→unbiased→unrepresentative
-not truly random unless you select a random number to start as the first participant
define: target population, representative, sample, sample size
target population-who the study is aimed at
representative-unbiased, has the right proportion of each subgroup in sample
sample-people taking part in the research
sample size-usually 30 people but can vary a lot depending on the research method
too small→unrepresentative, too big→expensive and time consuming
what are questionnaires
survey to ask participants questions to obtain information from a specified population. They may be carried out face to face, by post, telephone or the internet
questions can be closed-researcher determines range of answers e.g tick boxes, circle answer, rate on a scale. This is useful for facts and produces quantitative data that is easy to analyse but may lack realism due to the forced choices
open questions- the range of responses is not restricted by the researcher, providing a greater depth of qualitative date, but is more diffficult to analyse
questionnaire designs
avoid: leading questions, ambiguity, emotive questions, jargon/technical terms, double barreled questions e.g ‘do you think crime is due to poverty and diet’, negatives e.g ‘would you not buy a used phone’, questions that are impossible to answer
include:
filler questions to hide aim and avoid demand characteristics
easy questions at the beginning to relax ps and encourage them to complete the questionnaire
lei detection questions to test for social desirability bias so if positive that data can be discarded
reverse scoring and balance yes/no responses as some ps have a tendency to answer yes
strengths of questionnaires
speed and cost- a large amount of data can be collected from a large number of ps quicker and cheaper than interviews→larger sample→more representative of target population→results are generalisable
range of data- both qualitative(deeper detail) and quantitative(easier to analyse using statistics so can compare answers from different groups) can be used
weaknesses of questionaires
untruthful answers- ps may not answer truthfully due to social desirability bias-need to be seen in the best light, resulting in low internal validity
researcher effects- ps may be influenced by things such as the researcher’s gender, age or ethnicity, resulting in low internal validity
difficulty w controls- if not completed face to face, you can’t ensure that the data has been collected under controlled conditions
different interpretation of questions- unlike interviews, there is no way for ps to ask for clarification
types of interviews
structured; predetermined set of questions asked in a fixed order called an interview schedule, so each interviewer uses it the same way, like a questionnaire but face to face
unstructured: less rigid, but the topic is decided in advance, no set questions and is like a conversation where interviewee is prompted and encouraged to expand answers
semi structured: a mixture of the 2 where there is a list of set questions, but the interviewer can ask follow up questions
designing interviews
begin w easy questions to relax the participant and establish good rapport
avoid the same types of questions as when designing questionnaires
use video or audio recordings and write a transcript instead of note taking bc it can interfere w interviewers listening skills, make the ps feel anxious, make ps feel undervalued if something they say isn’t written down
strengths and weaknesses of un/structured interviews
structured interviews:
+unlikely to deviate from the topic bc preset question
+less training interviewers bc they are reading from a list of preset questions
+easy to replicate bc questions are the same
-predetermined structure so interview cannot follow new lines of inquiry that emerge from the ps responses
unstructured is the oppposite
general strengths of interviews
qualitative data so detailed information, enabling the researcher to gain subjective meanings by asking in-depth questions
misunderstandings can be clarified bc it’s face-to -face, so ps are clear on questions, so data has internal validity
complex issues can be explored as interviews are flexible
has the possibility of uncovering responses that are unatainable by other methods
general weaknesses of interviews
greater risk of social desirability bias bc face to face so ps are aware that interviewer is hearing their answer, making them self-conscious
more time consuming bc each p has to be questioned separately, so smaller sample→less representative of target population→results are not generalisable
qualitative data is more difficult to interpret and analyse and more open to researcher bias
requires considerable training of interviewer
interviewer effects are any effect the interviewer has on the participant such as age or gend, as well as non verbal communication such as frowning or smiling which could convey the interviewer’s opinion and lead to social desirability bias. The listening skills of interviewer can also have an effect, especially in unstructured interviews.
what are pilot studies
a small-scale trial run carried out before the main study to find out any problems and adjust them before you invest more money or time.
in experiments: identifies problems w instructions or how DV is measured
in observations: can check whether behaviour checklist is important, length of observation could be shortened
in questionnaire surveys: check interpretation of questions to make sure they aren’t ambiguous, check that the instructions are clear
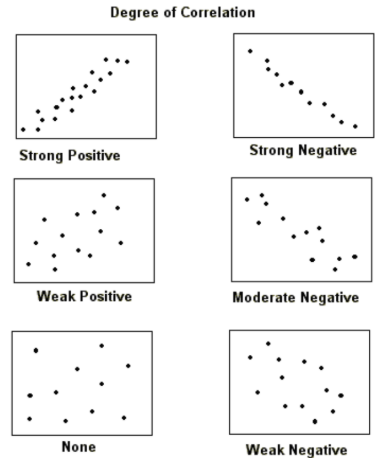
what is correlational analysis
measure the relationship between 2 co-variables
negative-if one variable increases, the other one decreases
positive-if one variable increases, so does the other
no correlation- no relationship between variablesa number between -1 and +1 called the correlation coefficient is calculated
0.3=weak correlation, 0.5=moderate correlation, 0.8=strong correlation,-1 perfect negativescatter graphs can show correlation
strengths of correlational studies
provides valuable information on the strength of the relationship between variables
can be used to explore relationships in complex situations and suggest ideas for further research
more ethical than experiments bc no manipulation of IV, just taking 2 measurements from a participant
weaknesses of correlational studies
impossible to establish cause and effect bc it only measures relationships, not the effect of an IV on a DV
spurious relationships-can detect meaningless patterns
cannot measure non linear relationships because the positive and negative relationships cancel each other out when doing a correlation coefficient so no correlation is shown even though the graph shows a clear relationship
difference between experiments and correlations
experiments investigate the difference between 2 or more conditions so how the IV affects the DV
correlations look at the relationship between 2 co variables(no IV or DV)
in a lab experiment, you can infer cause and effect but you cannot establish cause and effect in a correlation
writing a hypothesis for correlational analysis
null-there will be no correlation between (2 variables)
2 tailed- there will be a correlation between(2 variables)
1 tailed-there will be a positive/negative correlation between (2 variables)
what is an observation
watching and recording behaviour, with no IV/DV, but they can be used within an experiment to asses the DV
naturalistic vs controlled, overt vs covert, non-participant vs participant
naturalistic-observing behaviour in its natural setting. Researcher does not attempt to interfere or influence behaviour
controlled-some variables are controlled by researcher, reducing naturalness of environment, may be done in a lab
overt- participant is aware they are being observed, but researcher may try to be unobtrusive e.g one way mirror
covert-p is unaware they are being observed before and during the study. They may be informed after
non-participant-watching/listening to behaviour of ps without interacting
participant-observer is a part of the group being observed and interacts with ps
general weakness of observations
observer bias-observers may select what behaviours to include in behaviour checklist and have pre-existing ideas about behaviour. So, they may experience expectancy effects-only seeing what they expected to see
evaluation of naturalistic/controlled, covert/overt, participant/non-participant
naturalistic- +high realism→likely gthat people will behave normally, so high ecological validity and results can be generalised to real life
-lack of control over variables→difficult to replicate to check fro validity and difficult to make conclusions
controlled-opposite
covert- +high validity as ps are unware they are observed so would be influenced by demand characteristics, social desirability bias or observer effects, so have internal validity
-unethical-lack of informed consent as they are unaware they are being watched→must only be done in public
overt- opposite
participant- +greater insights into behaviour→can understand behaviour more→more validity findings
-more difficult to be an objective observer, observer may effect behaviour of the group→lack internal validity
non participant-opposite
observational design
sampling: (different to previous sampling)
time sampling-record what behaviours are happening at certain time intervals e.g record what child is doing every 5 mins, this shows behaviour over time, but can miss events
event sample-record how many behaviours occur in a set time period e.g how many times a baby cries in 1 hour
Recording observations:
operationalised observer checklist→specific categories that can be ticked every time they occur to get quantitative data
when using different/multiple observers use clear descriptions of behaviours and be trained in use of the checklist by using video footage to ensure inter-observer reliability-all observers agree of no. of behaviours observed so findings are reliable(consistent)