Hypothesis testing part 2
1/7
There's no tags or description
Looks like no tags are added yet.
Name | Mastery | Learn | Test | Matching | Spaced |
|---|
No study sessions yet.
8 Terms
Hypothesis testing
formulate null (H0) and alternative (H1)
decide level of sig
look up critical value - threshold for rejecting null
calculate statistic and compare to critical value
choose a critical value in terms of probability
can choose a critical value that represents the boundary between what we think as an acceptable observation difference and an unexpectedly large difference
difficulties
not always obvious what specific difference we are looking for
sometimes comparing average is not meaningful e.g. bimodal and unimodal have the same mean
data may not be interval scale
parametric stats
indépendant ransom samples - interval scale data
values of interest are close to known theoretical distribution - testing for normal distribution
non- parametric
distribution free stats
independent random samples - nominal or ordinal data
no assumption is made with regarding the underlying distribution
Chi-squared for difference
no assumptions
observations can be compared to any other empirical or theoretical difference
frequency data
test summarises all differences between samples
comapres frequency data across multiple samples and multiple categories
O = observed
E = expected
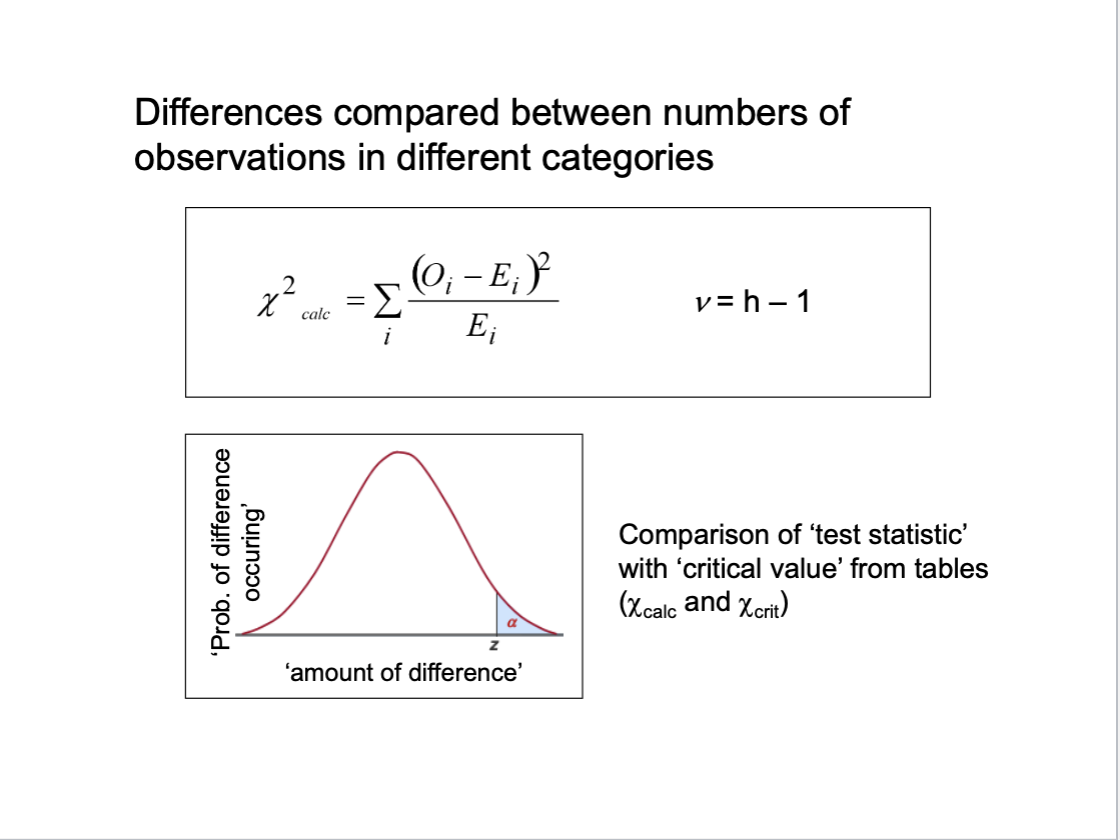
difference between observed and expected
observed = frequency data already organised into classes
interval data - need to be put into classes
ordinal data - need to be put into classes
expected = what we would expect if there were no difference in the pops of each class
requirements for chi squared testing
data must be in the form of frequencies
contingency table must have 2 or more categories
expected frequencies should be less than 5 (20% can be more than 5 if table larger than 2×2) but all expected frequencies must be greater than 1
samples unbiased - randomly chosen and independent