Unit 4: Changing Populations & Livable Communities
1/52
Earn XP
Description and Tags
Geography 9
Name | Mastery | Learn | Test | Matching | Spaced |
|---|
No study sessions yet.
53 Terms
Demography
Demography is the study of how populations change.
What is understood when studying demography?
By studying demography, we better understanding if:
If the number of people in a country is growing or declining
Where people live in a country
What services are needed for different groups of people
Birth Rate
The number of babies born each year for every 1000 people already living in Canada
Death Rate
The number of deaths every year for every 1000 people already living in Canada
Natural Increase Rate
The difference (subtraction) between the birth and death rates, and shows if a country’s population is growing or not through natural means (NOT including migration)
NIR per 1000 people = birth rate - death rate
→ Turn into percent
(NIR/1000) x 100 = percent
Migration Rates, Immigrants, Emigrants
The number of people who immigrate into or emigrate out of a country.
Immigrant: Individual who moves into a new country.
Emigrant: Person who leaves a country to live in another one.
Net Migration Rate
The difference (subtraction) between the number of people who move into a country and the number of people moving out of the same country.
Net migration rate per 1000 people = immigration rate - emigration rate
→ Convert into percentage
(NMR/1000) x 100 = %
Population Growth Rate
The overall rate for change in population. Trends will traditionally show a growth in the population, but they may also be declining.
Natural Increase Rate + Net Migration Rate = Population Growth Rate per 1000 people
→ Convert as percentage
(PGR/1000) x 100 = %
Doubling Time & Rule of 70
The length of time in calendar years it would take for a country’s population to double at the current population growth rate. The rule of 70 is used to estimate this.
70 / population growth rate = doubling time
In Canada,
= 70/0.97
=72.2
In order for our population to double at the current population growth rate, it would take us 72.2 years.
Dependency Load & Population Groups, Roles
The portion of the population that needs to be supported by working adults. For example, children and older adults.
-
In Demography, population can be described as 3 groups based on the roles they have in society.
Children (ages 14 and younger)
Working adults (ages 15 - 64)
Older adults (ages 65 and older)
Roles:
Children: Go to school, grow, learn, make mistakes, etc
Working adults: Pay taxes, support family, work, etc.
Older adults: Retire(d), volunteer, take care of grand children, etc.
Demographic Transition Model
The DTM is a model that describes how a country will change population wise overtime as it continues to develops (economically, social development, etc.). It consists of four main stages.
4 Demographic Transition Model Stages:
Pre-Transition
Early Transition
Late Transition
Post Transition
Characteristics of a STAGE 5 Transition
In Stage 5, there will be a even lower death rate and and birth rate compared to the previous stages. The death rate would be slightly higher than the birth rate. This is because:
Baby boomers are passing away
Innovations in healthcare, technology, and medicine allow for increased life expectancy
More GEN Z & A people choose to delay or forgo having children due to career, lifestyle choices, and/or financial factors, resulting in no future generation to be born (less and less kids)
The push for Inclusivity, reproductive rights, and diverse family structures, such as LGBTQ families or child-free family structures may result in a lower birth rate
DTM: Stage 1 (Pre-Transition) // Society
Birth Rate: High
- Similar -
Death Rate: High
Natural Increase Rate: Low (Stable)
Society:
High amounts of hunting, fishing, farming, and gathering food
Having more children so they could help work on the crop fields
A lot of children died, few became adults, life expectancy was very low
Disease, malnutrition, and contaminated drinking water was present
DTM: Stage 2 (Early Transition) // Society
Expansive Pyramid
High Birth Rate
Death rate drops dramatically compared to Pre-Transition stage.
Natural increase rate is high (population explosion, doubling time is increasing)
Society
Still a lot of farming, however technology advancements allow for mass food production
Better food storage methods are adapted
Increasing food security
Simple sanitation allow for fewer diseases (where to poop and get drinking water from river)
Large families continue to happen with more children surviving to adulthood
DTM: Stage 3 (Late Transition) // Society
Stable Pyramid
Birth rate drops quickly
Death rate drops below 10/1000
Natural increase rate is low
Society
More productive agriculture with less humans and more machineries
Move to cities increased (most people moved for work)
DTM: Stage 4 (Post Transition) // Society
Stable Pyramid - Decreasing Population Pyramid
Birth rate and death rate are slightly below 10/1000 | remain low from stage 3 late transition
Natural Increase Rate is low and stable
Society:
Most previous trends continue
Role of woman have changed as many have full-time work and careers
In developed countries, a large portion of the population is urban

1) Population Pyramid // Characteristics
Expansive Pyramid
Broad base: Indicating lots of births, a rapid rate of population growth (stage 2 - sanitation)
Doubling time is increased
High NIR rate
Low portion of older people (high death rates among people of 65+)

2) Population Pyramid // Characteristics
Stable Pyramid
Narrow base and steep top (house shape)
Roughly equal numbers in each age group
Birth rate and death rates even out and are similar
NIR: Low as birth rates and death rates are evened out

3) Population Pyramid // Characteristics
Declining Pyramid
High proportion (amount) of aged people (65+) | Low Death Rate
With very few children being born | Low Birth Rate
Population is declining and dependancy load is increasing
Centanarian
An individual who has lived past the age of 100.
Challenges of an aging population
Access to healthcare and overall well being (mentally and physically)
Increased dependancy load, strain on public funds (CPP, free healthcare, etc)
How will older Canadians be able to participate in society and the economy
Government programs and jobs are needed to support the needs of older Canadians
Recreational activities at community centres
Field trips to shopping malls, etc, for elderly people
PSW, doctors, nurses, etc
Seniors (65+) make up the fastest-growing age group in Canada, why?
Lower birth rates
Increased life expectancy
The Baby Boomer generation aging
Canada’s Aging Population: Impacts of Family Structure
More seniors, less children
Living arrangements made so family members can care for the elder
Beyond taking care of elders, aunts, uncles, kids, etc. It is important to care for yourself
Cost of living increases as more tax money is needed by the government to support social services (i.e. CPP)
Canada’s Aging Populations: Impacts of Labour Force
Lower amount of people on the labour force as more people retire (baby boomers)
Labour market shortages (in key sectors // healthcare)
Lower amount of people on the primary industry (technology)
More jobs need to be created to support seniors
Caregiving, PSW (Personal Support Worker)
Recreational centre workers for hosting evens for seniors
Healthcare workers for a higher senior population (nurses, doctors, therapist, PA’s, etc)
More financial advisors to manage senior’s retirement funds and plans
Canada’s Aging Population: Economic Impacts
More working adults are needed to pay into social services with tax money. For example, more seniors will be on CPP, meaning more money/tax dollars is needed. (CPP faces strain)
With lower birth rates and less working adults, increased immigration is needed to increase the amount of working adults
Older adults will use more healthcare services, increasing public healthcare spending. (Pressure on public finances)
Inuit Nunangat: Regions & Size (Land Area)
Inuvialuit
Nunavut (Largest)
Nunavik (2nd Largest)
Nunatsiavut (Smallest)
Since Time Immemorial
A phrase used by Inuit people and it refers to longer than combined human history. In another words, it means for as long as anyone can remember; going back far beyond recorded history.
What stage of the DTM is Nunavut and Canada in?
Nunavut:
Stage 2 (Early Transition)
Rest of Canada:
In Stage 4 (Late Transition) and possibly entering a Stage 5. But we are artificially delaying it with immigration.
Nunavut Demographics: Family Structure
High birth rates, low amount of seniors (expansive pyramid)
More children than seniors (65+)
Large young dependancy load
Kids are hunting, community sharing techniques
Nunavut’s Population (Demographics): Labour Force
Mining jobs
Environmental Concerns
Hunting, fishing, jobs
Young labour force
Tourism & traditional performance actors
High amounts of unemployment
Not enough jobs for the population
Nunavut’s Demographics: Economic Effects
Food and other items are expensive due to the need to import goods
Baby formula, diapers, personal sanitation items, fresh fruit and vegetables
Mining and fisheries plays a big role in Nunavut’s economy. However, both have concerning economic and social effects
To combat, a deep port is being built allowing for cruise/cargo ships to drive the economy
Two Types of Immigrants
Economic Immigrants
Social & Humanitarian Immigrants
Economic Immigrants: Class (5)
Skilled Worker
Skilled Trades
Start-Up Visa
Canadian Experience
Requires one year of being a temporary foreign worker
Temporary Foreign Worker*
Skilled Worker // How is One Approved?
Point system
Family member with the most amount of points get examined
What Classes of ECO Immigrants Use The P/F System?
Skilled Trades
Canadian Experience
Temporary Foreign Workers
Start-Up Visa
What Criteria is needed for a Start-Up Visa
Approved Canadian investors will fund the idea
Know English/French
At least a year of post-secondary experience
Have enough money to support themselves until business proceeds can take over
What are the Classes of the Social and Humanitarian Immigrants (2)
Family Class
Sponsor
Refugees
Asylum Seekers (Apply for refugee status within Canada)
Resettled Refugees (Apply for refugee status outside of Canada)
Population Distribution
The pattern showing where people live in an area. (How people are spread out across a geographic area)
[XX]% of Canadians live in the _____ (within [XXX]km of the border of the U.S.)
90 percent, within 600km
This means that almost all the people in Canada live on only 10% of our land
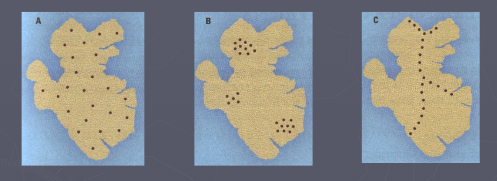
(3) Types of Population Distribution
A) Scattered
B) Clustered
C) Linear

Population Density
The calculation of how many people live in one square kilometer of land (people/km2)
T/F | Population density is higher in urban areas compared to rural areas.
TRUE, Population density is higher in urban areas than it is in rural areas.
Over 80% of Canada’s population lives in urban areas (cities or towns)
Urbanization
The process of a location changing from rural to urban over time
Urban Sprawl
New development that happens around an area that is already urban. The new development often comes with low-density residential dwellings long and endless pavements, and increased car dependency. Urban sprawl has high social and infrastructure costs (mainting the roads & Mr. Owen story)
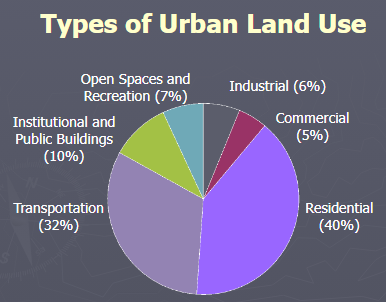
Types of Urban Land Use // Examples
Residential
Low Density
Single or semi-detached homes
Medium Density
Townhouses
High Density
Apartments/Condos
Transportation Land
Roads, highways, expressways
travel paths, sidewalks, bike lanes
Train tracks, train stations and airfields/airports
Institutional & Public Buildings
Schools, government offices/buildings, parliaments (legislative assemblies)
Hospital
Open Space and Recreational
Park Land, golf courses, trails, playing fields, green fields, arenas
Industrial
Factories, warehouses, large production plants, (GM factory in Oshawa, ON), etc.
Commercial
Shopping centers (community & regional), neighborhood plazas, power centers(RONA & Walmart plaza), central business district

Types of Urban Land Use (Greatest to Smallest) (6)
Residential
Transportation
Institutions and Public Buildings
Recreational and Green Space
Industrial
Commercial
Principles of Smart Growth
The principles of Smart Growth includes producing higher-density, compact homes (townhouses) and communities with plenty of bike lanes, pathways, sidewalks and walking trails; all surrounded by greenspaces and farmland. The objective is to crease a twenty minute walk between all the essential locations (grocery store, plaza, doctors office, etc.).
Intensification
The process of increasing density in areas that are already urban.
Ecological Services // Importance of Keeping Ecological Services
Natural services that nature, farmland and greenspaces provide. For example, clean air and water, healthy soil, and habitat for wildlife. In other words, stuff (services and products) that nature just does.
If we got rid of all these services, we would have to artificially created them; which would cost us a lot of money which is why it’s important to keep them.
Problems with Urban Sprawl
Creates endless pavements resulting in increased car dependency and higher amounts of traffic resulting in high social and infrastructure costs.
If this continues, it poses a threat to our families, out communities, and the ecosystems that sustain us.
Urban Food Belts
Green spaces, farmland and forests that are restricted from development. First adapted by Markham and aims to protect Markham’s remaining farmland, green spaces, and forests from being paved over.
How many points is required for skilled workers to past the points system?
67 points (minimum)