Chapter 3
 Call Kai
 Learn
Learn Practice Test
 Spaced Repetition
 Match
Match Flashcards
 Knowt Play
1/17

There's no tags or description
Looks like no tags are added yet.
Name | Mastery | Learn | Test | Matching | Spaced | Call with Kai | Chat |
|---|
No analytics yet
Send a link to your students to track their progress
18 Terms
What is?
Variability →
Covariability→
What else is important for Psychological Measurment?
Variability (differences among scores)
Covariability (consistency between sets of scores): how much does one affect the other?
Test score interpretation.
Measurement theory assumes that psychological differences exist and can be quantified.
Difference between Inter/Intraindividual Differences.
What does central tendency mean?
The typical or representative score, most commonly expressed as the arithmetic mean:

Remember the difference between variability, variance, and Standard Deviation?
Variability: The degree to which scores deviate from the mean.
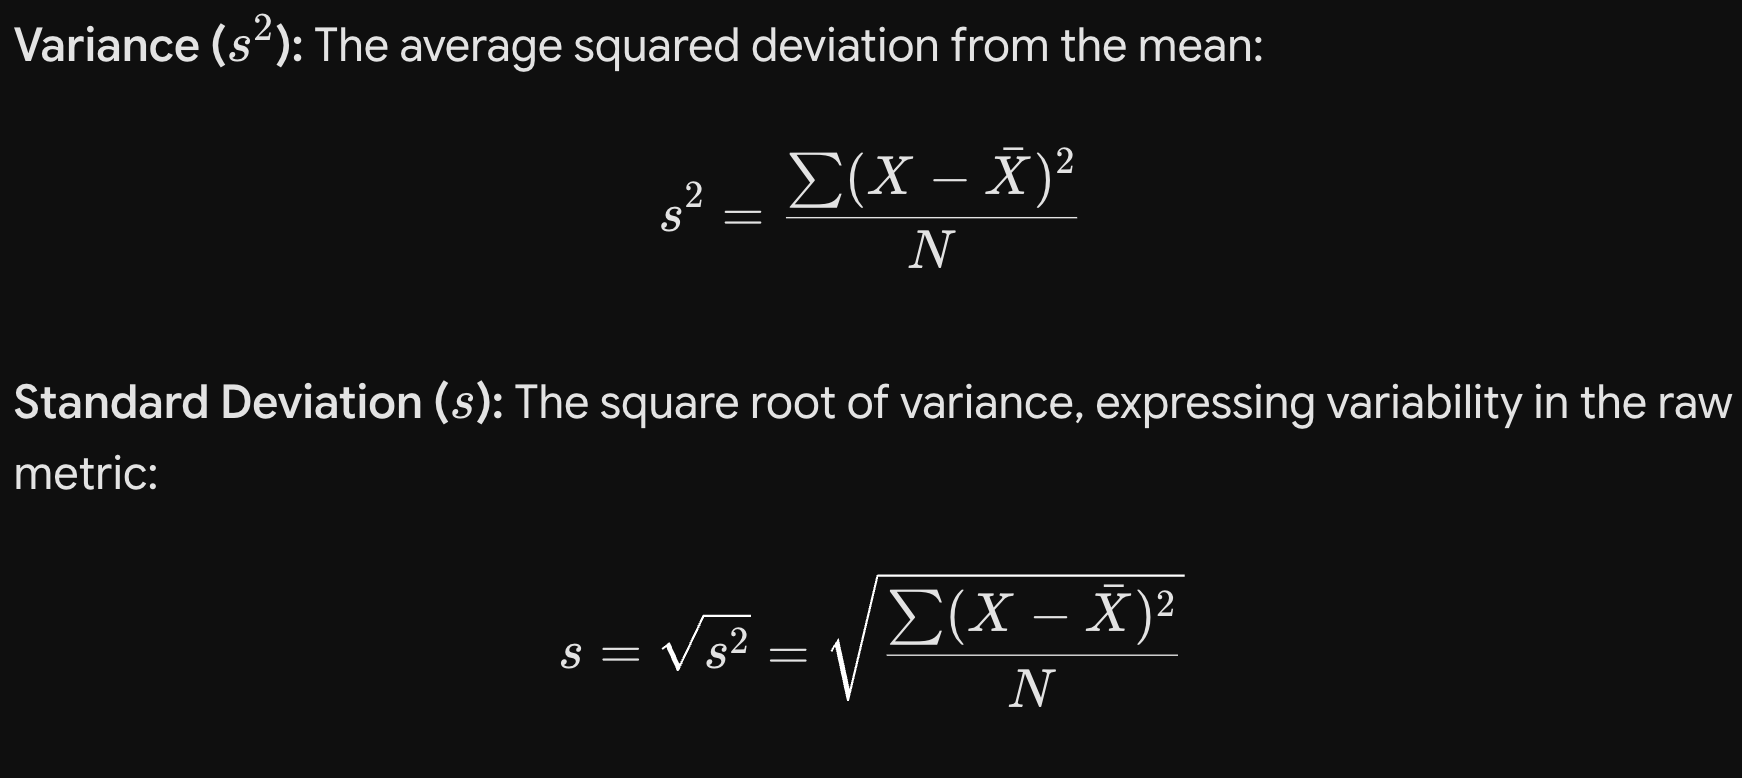
Variance (s2): The average squared deviation from the mean:
Standard Deviation (s): The square root of variance, expressing variability in the raw metric:
Interpretation Factors: s^2 and $s$ can never be negative ($0$ indicates no variability); their magnitude depends on both true variability and the scale metric (e.g., GPA vs. IQ); and $N$ (rather than $N-1$) is used here because psychometric descriptions focus on distribution properties rather than inferential statistics.
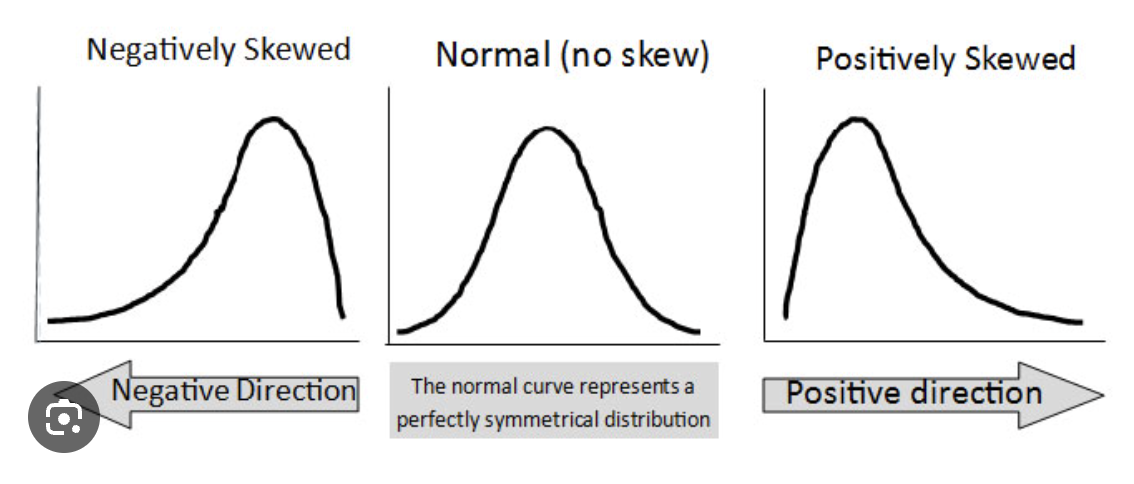
Skew this im flying to another planet!!! What is a Normal Distribution / Positive and Negative skewed one?
Normal Distribution: Symmetrical, bell-shaped distribution where Skew=0.
Positive Skew: Tail points to the right; relatively few values above the mean (\text{Skew} > 0).
Negative Skew: Tail points to the left; relatively few values below the mean (\text{Skew} < 0).
Reminder a rocked would launch into which direction if placed on the slope?
Into the negative direction → Negative skew
Into positive direciton → Positive skew
We want to measure Covariability and association. What do we need for that, and why do we do it?
Examining covariability requires at least two scores per participant to assess direction (positive or negative) and magnitude (strength/consistency).
Covariance (cxy): The mean cross-product of deviation scores:
Indicates direction (positive or negative) clearly, but its magnitude is metric-dependent and difficult to interpret directly.
Correlation (rxy): The standardized linear association bounded between -1 and +1
Reflects both direction and absolute magnitude regardless of the original units of measurement.
Measurement Scales: Pearson r is used for interval/ratio variables; Spearman, polychoric, or Kendall’s tau are used for ordinal variables; and tetrachoric is used for binary pairs.
What is a Variance-Covariance Matrix?
A square grid of numbers that summarizes how a group of variables behave individually and together:
Main Diagonal (top-left to bottom-right):
Contains the variances of each variable (how spread out each one is on its own).
Off-Diagonal (everything else):
Contains the covariances between pairs of variables (how they move together).
Positive: They tend to move in the same direction.
Negative: One tends to rise when the other falls.
Zero: No linear relationship.
Key Rule: It is always symmetric because the relationship between $A$ and $B$ is identical to the relationship between $B$ and $A$.

What is Two-Item Composite Variance?
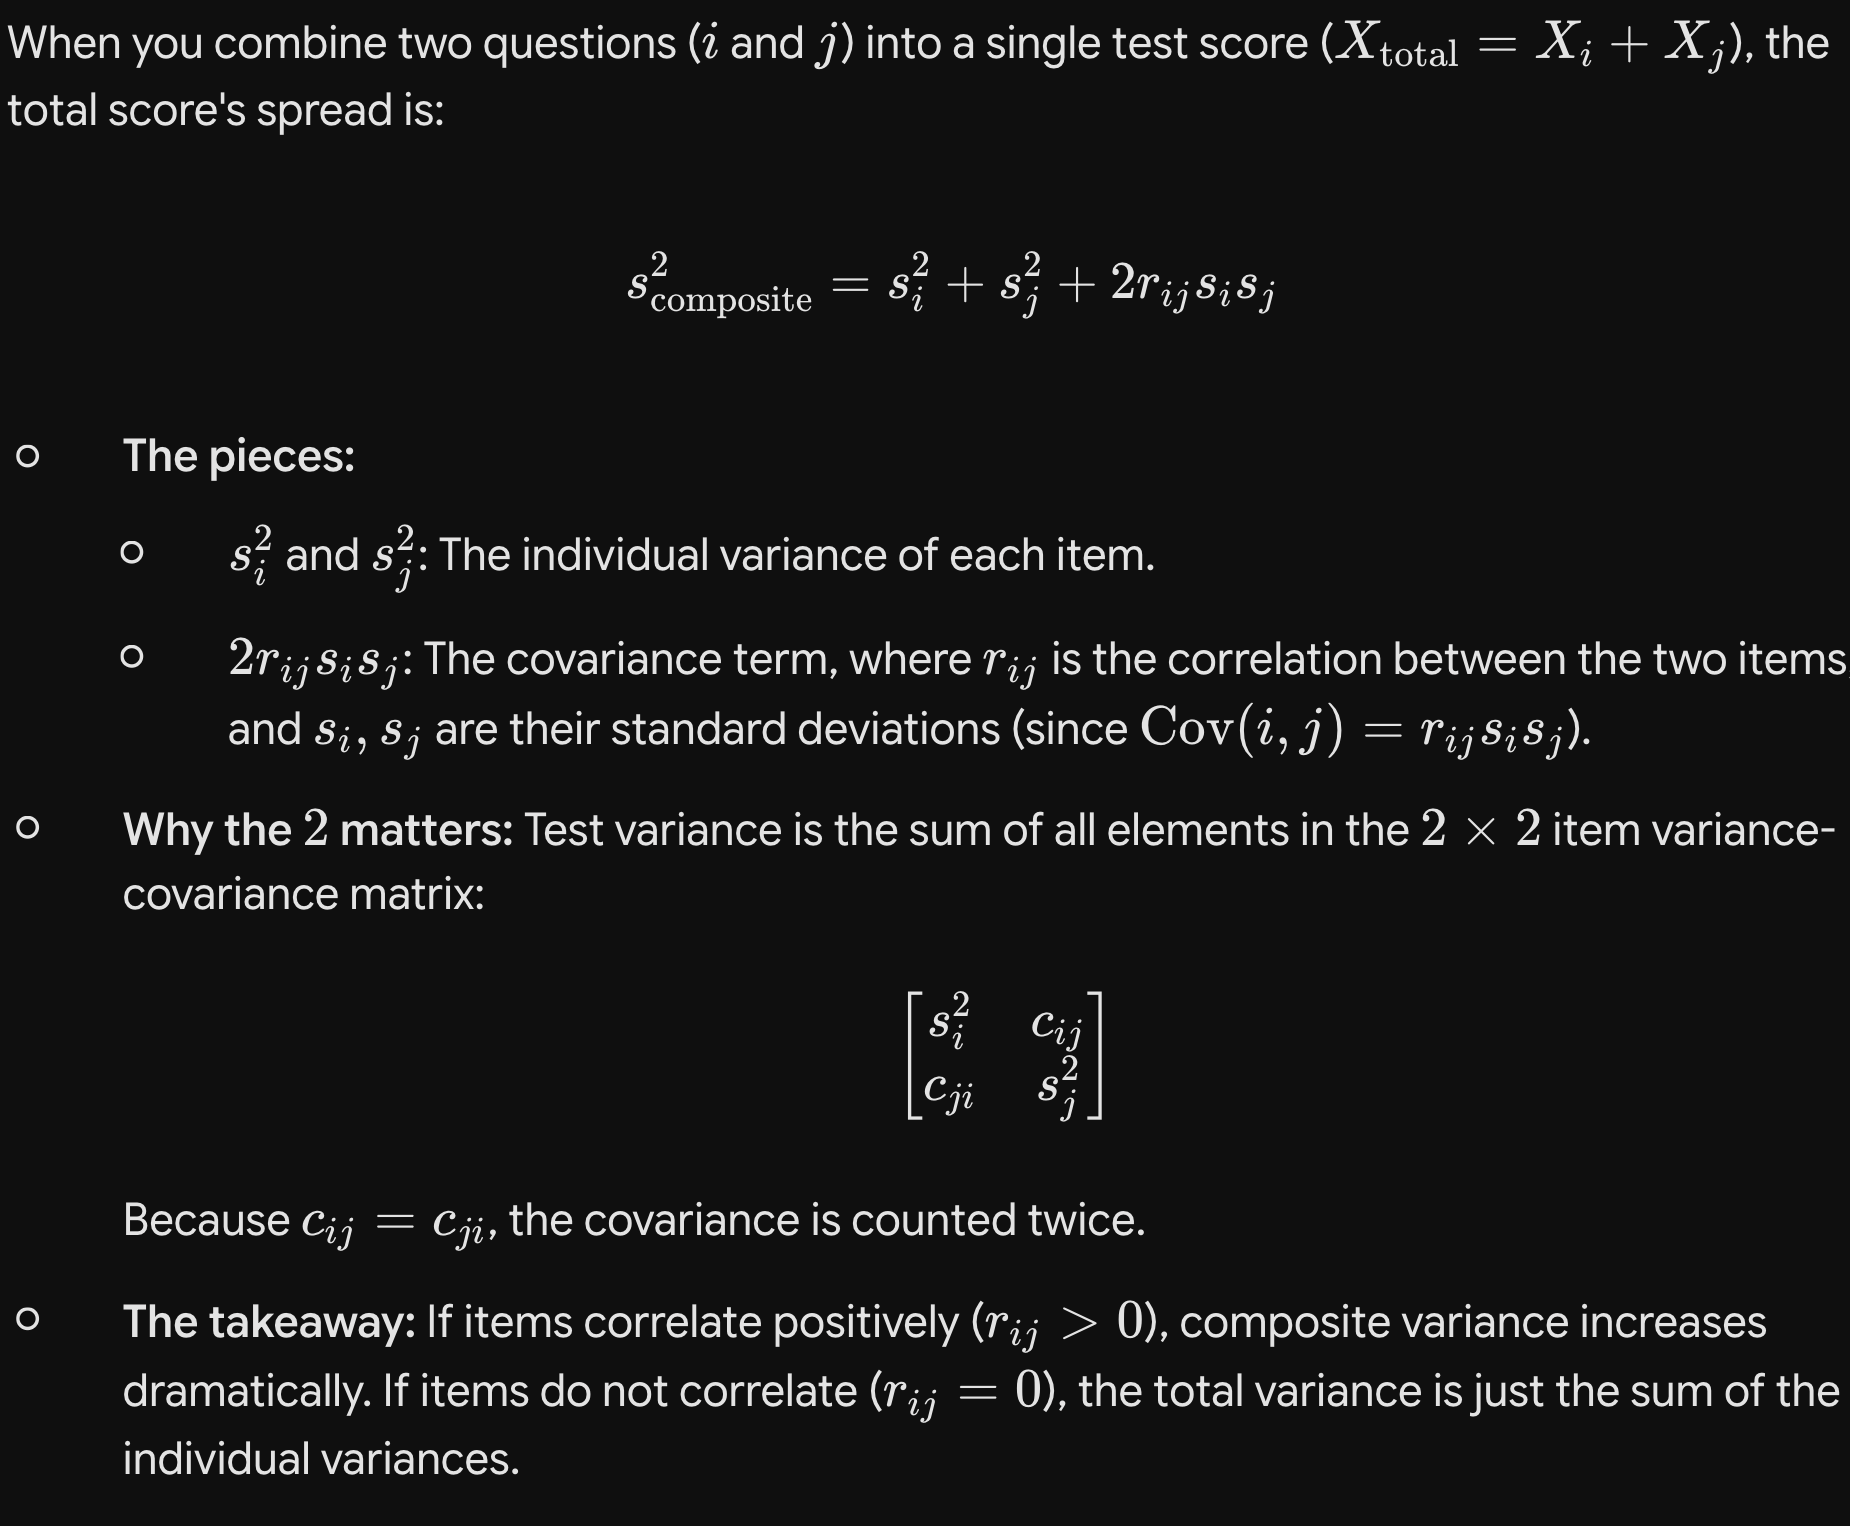
What is Composite Covariance?
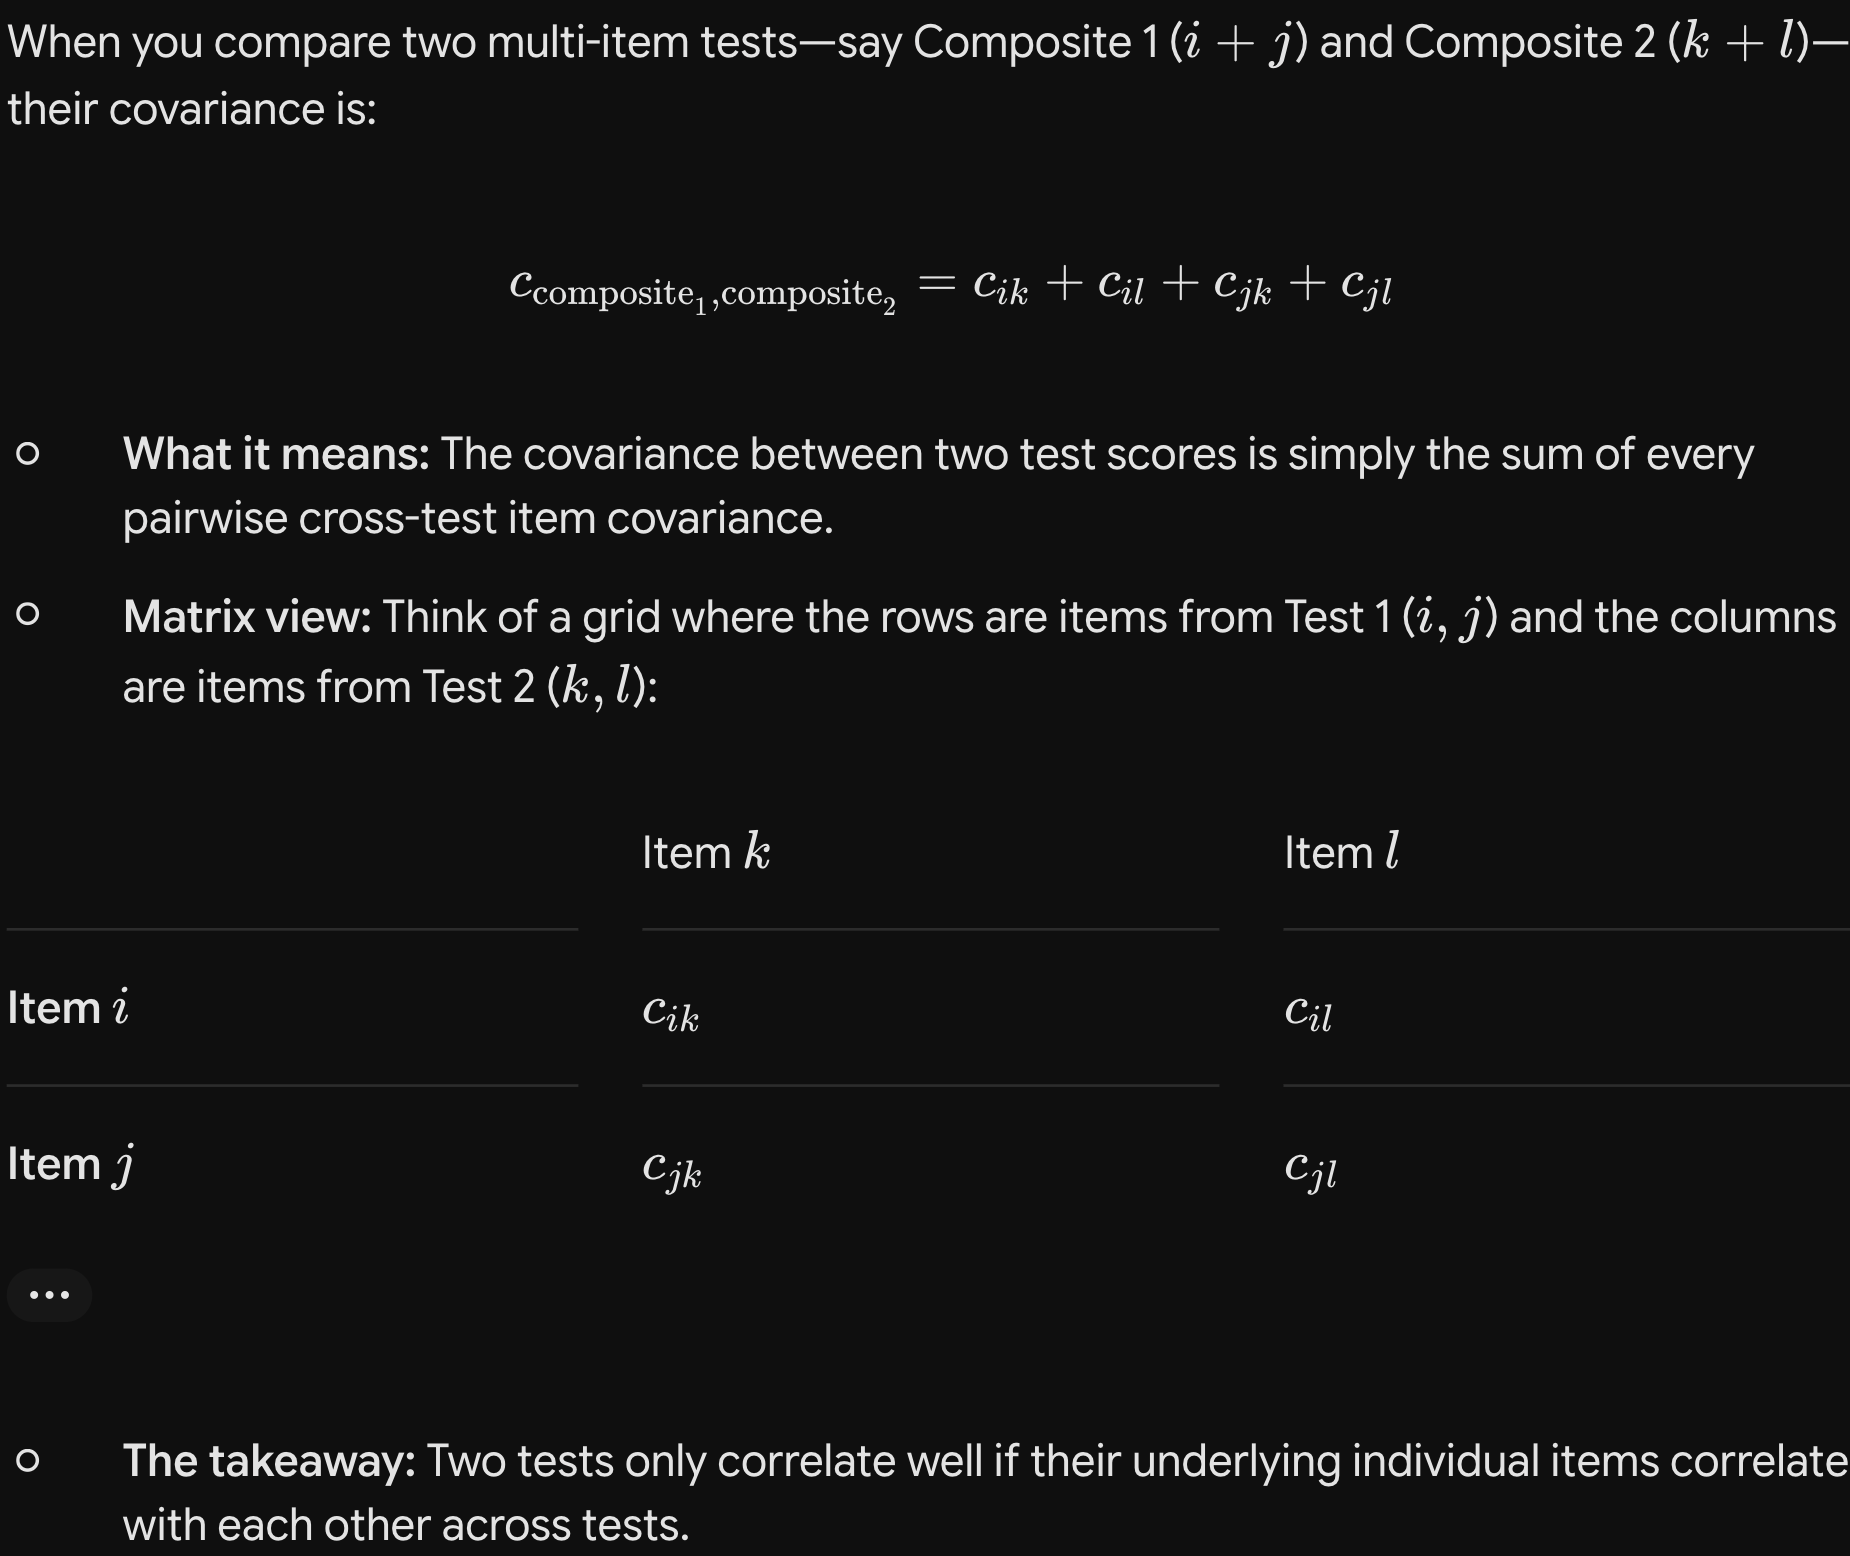
What are Binary (Dichotomous) Items?

Interpret
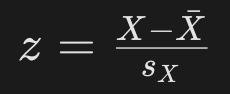
Standard Score (z-Score)
Mean = 0, SD = 1.0.
Expresses distance from the mean in standard deviation units. Bypasses raw score metrics to enable cross-test comparisons. Can be negative or fractional
Interpret
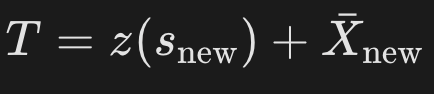
Converted Standard Score (T-Score)
Rescales z-scores to eliminate negative numbers and decimals (e.g., MMPI scales: Mean = 50, SD = 10
Interpret
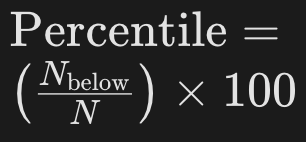
Percentile Rank (Empirical)
The percentage of test takers scoring below a given raw score. Calculated directly when all raw scores are available
Interpret
Percentile Rank (Theoretical / Normal)
Estimated via z-score and standard normal distribution tables
→ Used when complete raw data are unavailable; valid only if the underlying psychological construct is normally distributed
Interpret
Normalized Standard Scores
1. Calculate empirical percentile ranks.
2. Find corresponding normal-curve z-scores.
3. Rescale to the target metric
Area transformation used by test developers when the theoretical construct is normal but the sample raw data show non-normal skew
What is a reference Sample
A large representative group whose scores form the "norms" (interpretive baseline) for scoring future individuals.
Research vs. Applied Testing
Applied testing heavily relies on norms for individual classification, whereas basic research focuses primarily on associations (correlations) between variables rather than individual score interpretation.
Probability Sampling vs Nonprobability Sampling
Probability Sampling: Ensures representativeness through random, stratified, or cluster selection.
Nonprobability Sampling: Convenience or voluntary recruitment; poses risks of bias and poor population representativeness.