Booklet 10 - Aggregate Demand & Aggregate Supply
1/47
There's no tags or description
Looks like no tags are added yet.
Name | Mastery | Learn | Test | Matching | Spaced |
|---|
No study sessions yet.
48 Terms
What do you Discuss when Asked About - The Aggregate Demand (AD) Curve
Define Aggregate Demand
Formula for Aggregate Demand
Draw the Aggregate Demand Curve
Explain the Reasons for the Negative Slope of the AD Curve
Define Aggregate Demand
The total amount of demand for final goods and services in the economy at a point in time.
Formula for Aggregate Demand
Aggregate Demand = C + I + G + (X – M)
Draw the Aggregate Demand Curve
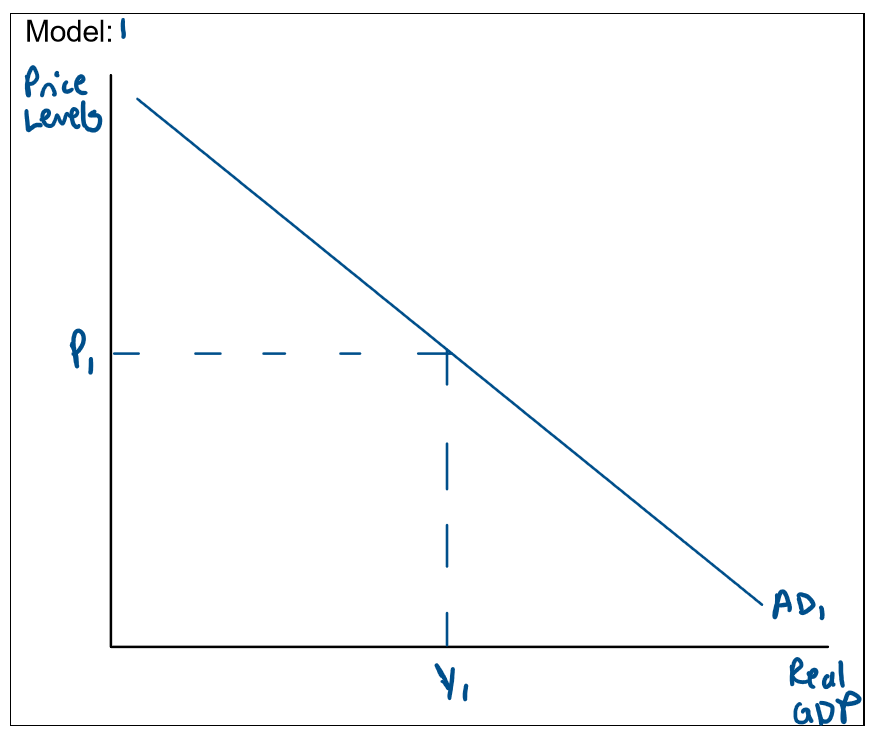
Explain the Reasons for the Negative Slope of the AD Curve
The Wealth Effect: When prices increase (high inflation), the real wealth of households tends to fall (more expensive to hold assets), which reduces the level of consumption.
The Interest Rate Effect: As the price level rises, interest rates rises which decreases consumption and investment.
The Foreign Purchases Effects: as the price level rises, imports become more attractive, while exports become less competitive in overseas markets
What do you Discuss when Asked About - Factors that Cause a Movement Along the AD Curve
Increase in General Price Levels + Diagram
Decrease in General Price Levels + Diagram
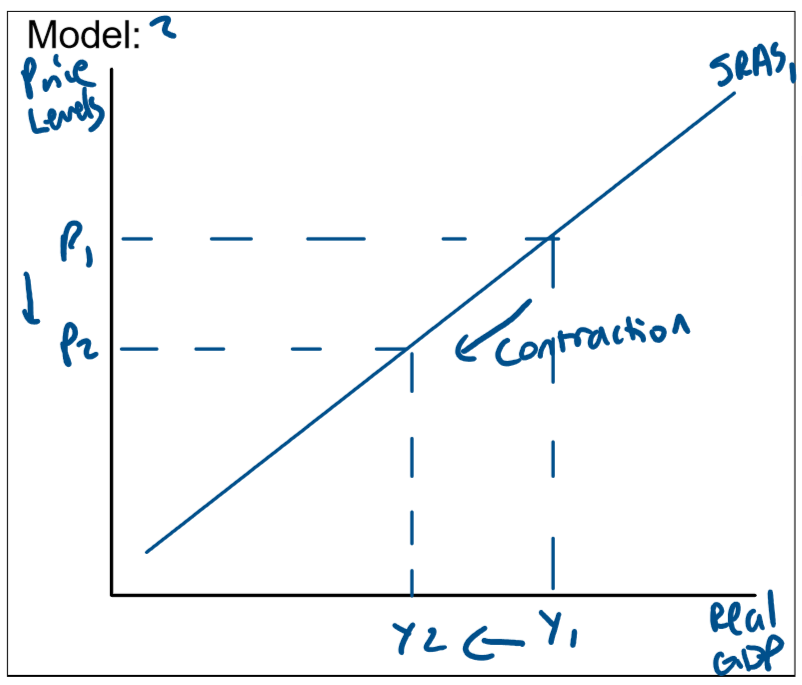
Describe & Draw a Diagram explaining Increase in General Price Levels as a Factor that Causes a Movement Along the AD Curve
Due to the negative slope of the AD curve, an increase in the general price level (inflation) can be expected to reduce total spending in the economy- a movement up and to the left along the AD curve.
An increase in the general price level and inflation from P1 to P2 will cause a decrease in real GDP, output, income and employment from Y1 to Y2. This causes a movement up the AD curve and a contraction in AD.

Describe & Draw a Diagram explaining a Decrease in General Price Levels as a Factor that Causes a Movement Along the AD Curve
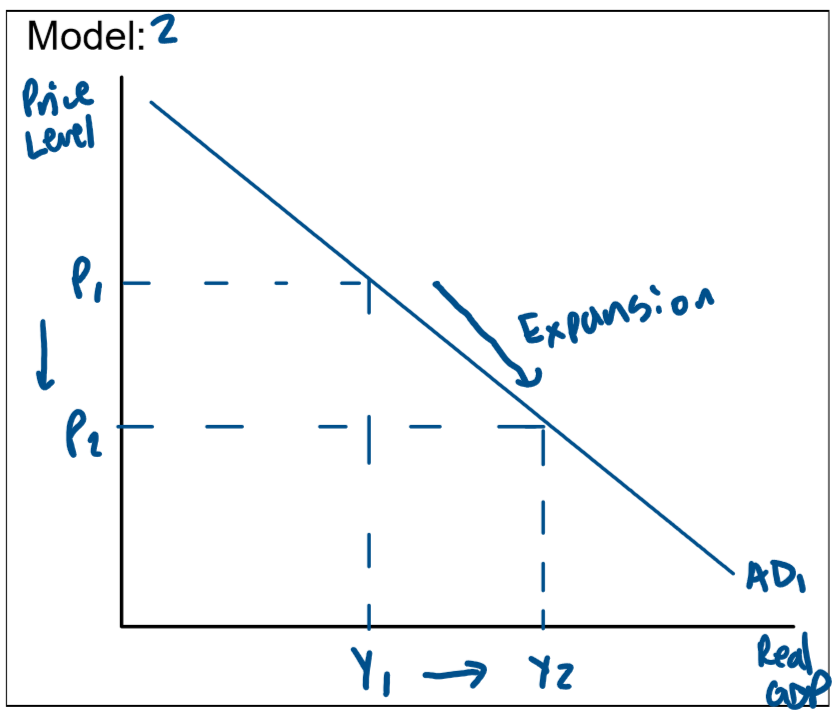
A fall in the price level, will increase total spending in the economy and cause a movement down and to the right along the AD curve.
A decrease in the general price level and inflation from P1 to P2 will cause an increase in real GDP, output, income and employment from Y1 to Y2. This causes a movement down the AD curve and an expansion in AD.
What do you Discuss when Asked about - Factors that Can Cause a Shift of the AD Curve
Factors Affecting the Components of AE/AD:
Consumption (C)
Level of Disposable Income
Asset Prices
Consumer Sentiment
Interest Rates
Demographics
Government Policy
Investment (I)
Interest Rates (Cost of Credit)
Level of Past Profits
Business Confidence
Government
Government Spending (G)
Stabilising Macroeconomic Fluctuations
Discretionary Changes (Optional)
Automatic Changes (Forced Changes)
Net Exports (X-M)
Terms of Trade
Exchange Rates
Level of Economic Activity
Protection – Presence of Trade Barriers
Using a Diagram Demonstrate an Increase in Aggregate Demand - Caused by an increase in; Consumption, Investment &/or Net Exports (Increase in Exports, Decrease in Imports)
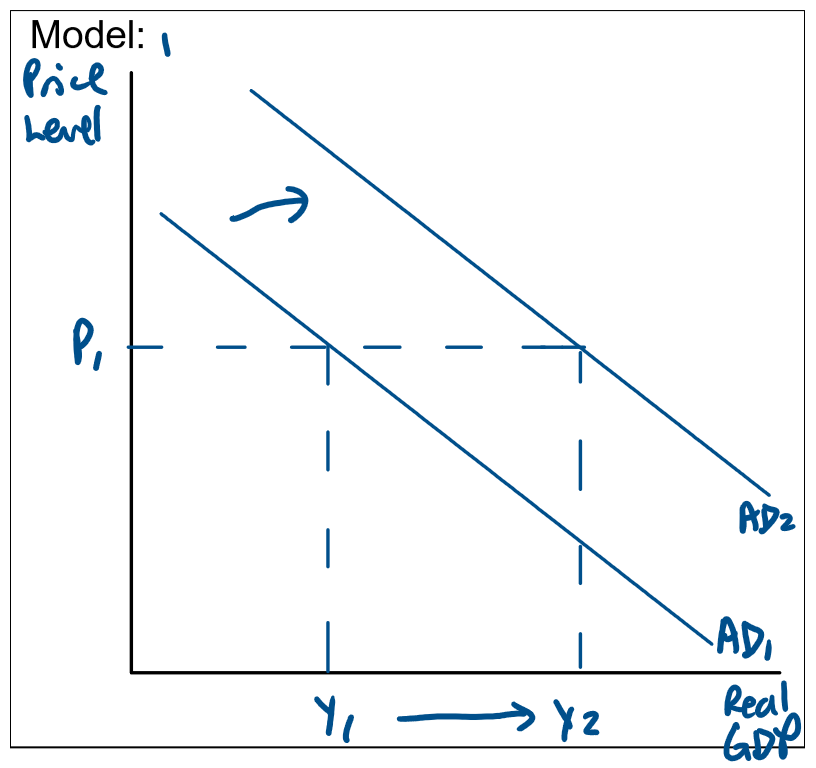
An increase in consumption, investment, government spending or net exports will increase AD, causing a shift right of the AD curve to the right from AD1 to AD2. This causes the price level and inflation to stay constant at P1 and an increase in real GDP, employment, output and income from Y1 to Y2.
This triggers the positive multiplier effect as the increase n AD causes a larger increase in real GDP/Output
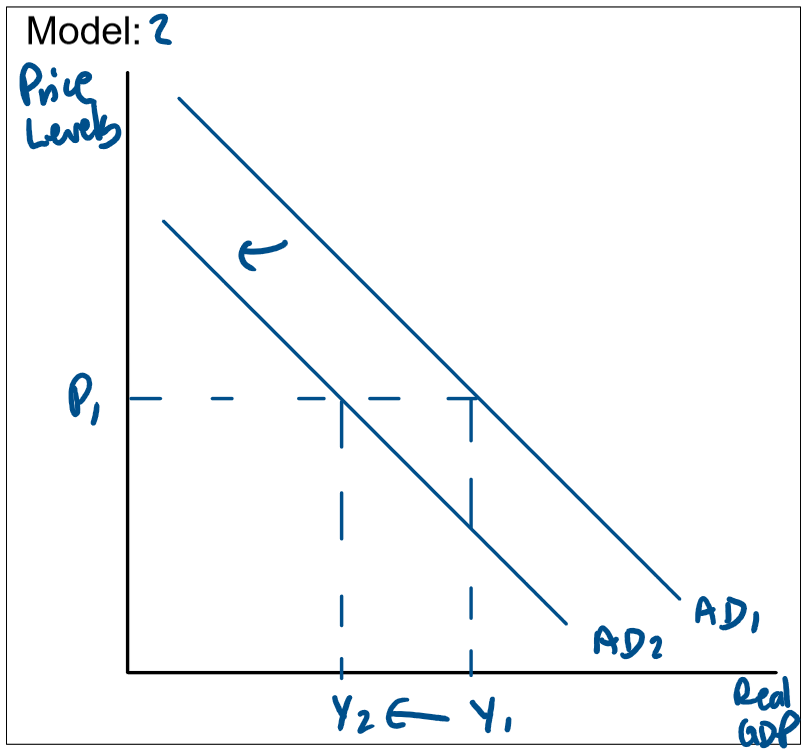
Using a Diagram Demonstrate a Decrease in Aggregate Demand – Caused by a decrease in; C + I + G &/or Net Exports (Decrease in Exports, Increase in Imports)
A decrease in consumption, investment, government spending or net exports will decrease AD, causing a shift left of the curve from AD1 to AD2. This causes the price level and inflation to stay constant at P1 and a decrease in real GDP, output, employment and income from Y1 to Y2.
This triggers the negative multiplier effect as the decrease in AD causes a larger decrease in real GDP/Output
What do you Discuss when Asked About - The Short Run Aggregate Supply Curve (SRAS)
Define Short Run Aggregate Supply (SRAS)
SRAS Diagram
Explain why the SRAS Curve is Positively Sloped
Define Short Run Aggregate Supply (SRAS)
The total annual volume of Australia’s output that firms are willing and able to supply or produce.
SRAS Diagram
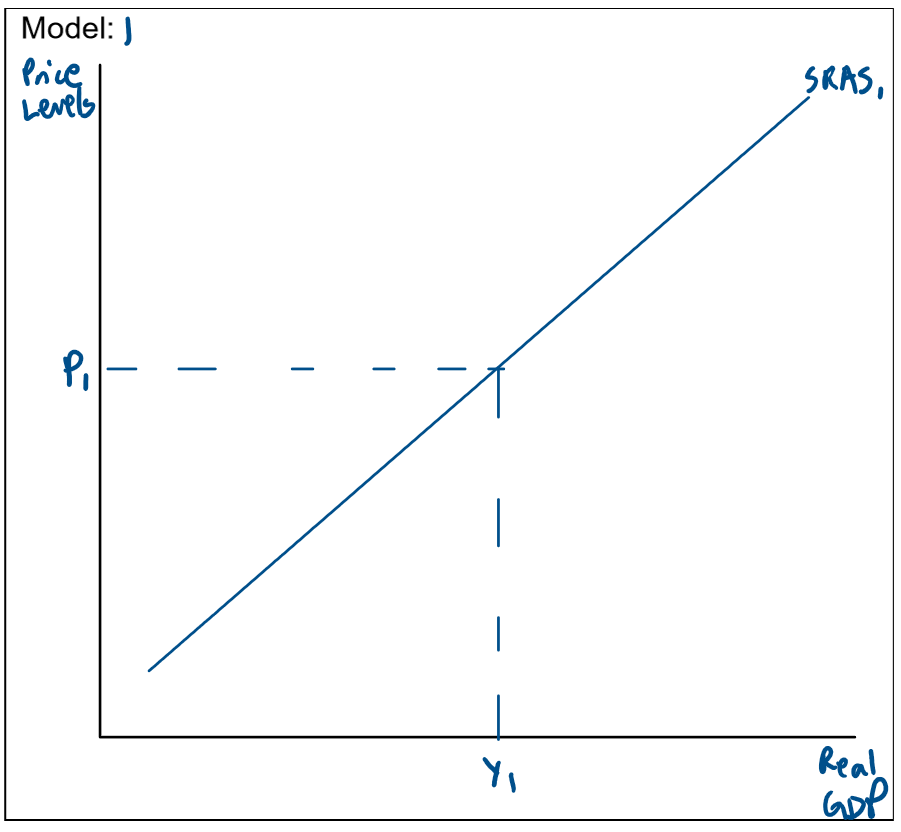
Explain why the SRAS Curve is Positively Sloped
The Short Run Aggregate Supply (SRAS) curve is positively sloped because it focuses on the cost of production. This curve illustrates the relationship between the total production of goods and services and the general price level in the economy. As firms increase production, they require more labour and capital, which puts upward pressure on resource prices. The most significant cost of production is the price of labour (wages)
What do you Discuss when Asked about the Long Run Aggregate Supply Curve (LRSAS)
Define Long Run Aggregate Supply (LRAS)
Diagram for Long Run Aggregate Supply (LRAS)
Explain why the LRAS Curve is Vertical
Discuss how the Position of the LRAS Curve is Determined
Define Long Run Aggregate Supply (LRAS)
Shows the economy’s maximum or potential level of GDP when all resources are fully employed.
Diagram for Long Run Aggregate Supply (LRAS)
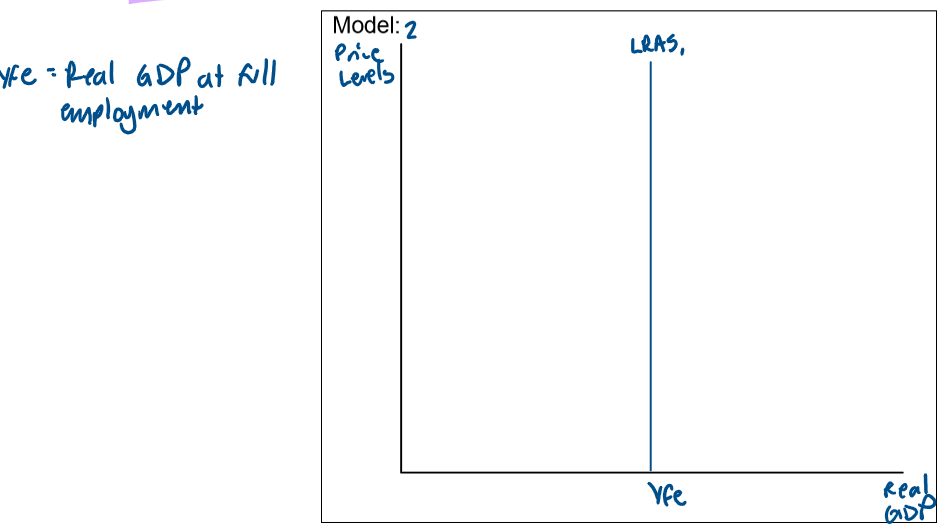
Explain why the LRAS Curve is Vertical
Because it represents the maximum level of output at a particular point in time. Price level does not influence potential output.
Discuss how the Position of the LRAS Curve is Determined
The Size of the population (number of households buying goods & services & the potential size of the workforce)
Participation in the workforce
Productivity of labour influenced by the stock of capital equipment & the state of technology
What do you Discuss when Asked About - Factors that Cause a Movement along the SRAS Curve
Increase in Population
Decrease in Production
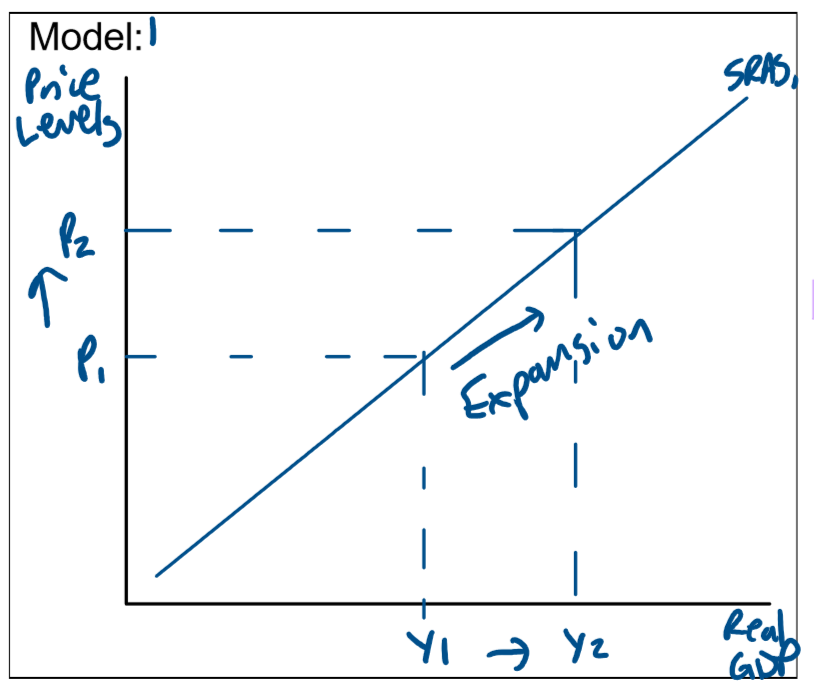
Discuss an Increase in Production as a Factor that Causes a Movement along the SRAS Curve
The SRAS curve is positively sloped meaning that as the level of economic activity increases, the price level rises.
This occurs because for firms to increase their production they require more resources, more labour, capital and natural resources.
This increased demand for resources will cause input prices to rise.
For example, if firms increase their production there is an increased demand for labour which will result in wages increasing.
This will cause an increase in the general price level.
An increase in real GDP, output, income and employment from Y1 to Y2 will cause an increase in the general price level and inflation from P1 to P2.
This causes a movement up the SRAS curve and an expansion is SRAS.
Discuss an Decrease in Production as a Factor that Causes a Movement along the SRAS Curve
A decrease in production causes a movement downward along the SRAS curve, reflecting a lower level of economic activity and a lower price level.
As firms reduce output, their demand for resources such as labour, capital, and raw materials falls.
This decrease in resource demand leads to lower input costs, for example, wages may decrease due to reduced labour requirements. Consequently, the overall price level in the economy declines, moving along the SRAS curve to a lower point.
A decrease in real GDP, output, income and employment from Y1 to Y2 will cause a decrease in the general price level and inflation from P1 to P2.
This causes a movement down the SRAS curve and a contraction in SRAS.
What do you Discuss when Asked About - Factors that Cause a Shift of the SRAS Curve
Changes in Input (Resources) Prices:
Changes in the Labour Force:
Changes in Capital Stock:
Exogenous (External) Events:
Factors that Cause a Shift of the SRAS Curve
Any event that affects the availability of resources and/or the cost of production in the short term will shift the SRAS only. This includes:
Changes in Input (Resources) Prices: Changes in the price of wages, energy prices (e.g. oil), prices of raw materials, cost of capital equipment & levels of taxation.
Changes in the Labour Force: Such as changes in the labour force, human capital & labour productivity.
Changes in Capital Stock: Changes in the availability of capital stock & government infrastructure.
Exogenous (External) Events: Such as extreme weather events including floods, bushfires &/or drought.
What do you Discuss when Asked About - Factors that Cause a Shift of the SRAS & LRAS Curve
Change in the quantity of labour in the economy
Discovery/depletion of natural resources
Change in Technology
Change in Productivity
Factors that Cause a Shift of the SRAS & LRAS Curve
A change in the quantity of labour in the economy
The discovery/depletion of natural resources (increasing labour resources)
A change in technology
A change in productivity
Macroeconomic Equilibrium using the AD/AS Model
The intersection of the AD, SRAS and LRAS describes the long run macroeconomic equilibrium of the economy.
This implies that actual output equal potential output. Yfe (income at full employment) or Yp (income at potential) are the labels commonly used to illustrate the macroeconomic equilibrium in AD/AS curves.
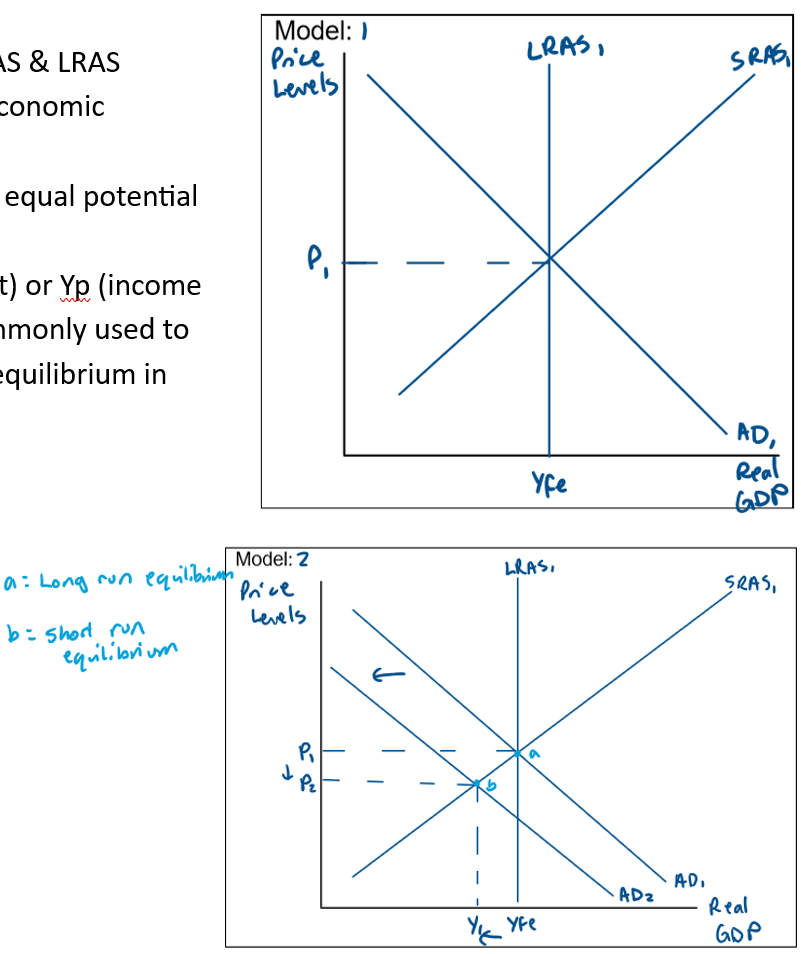
A shift in either the AD curve or the SRAS curve will cause short run equilibrium to diverge from the economy’s potential output, with some impact on the price level.
This is shown in Model 2:
Over time, all three curves will shift to the right due to economic growth.
The population and labour force grow because of natural increases and migration, the level of capital stock will increase as businesses and households continue to invest and develop.
This means that SRAS and LRAS are both shifting right.
AD will shift to the right as well due to changes in consumption but be aware the curves may not always shift at the same rate.
This creates contractionary and inflationary gaps in the market.
What do you Discuss when Asked About - the Contractionary Gap
Define Contractionary Gap
Draw the AD/AS Model & AE Model
Characteristics of a Contractionary Gap
Define Contractionary Gap
The contractionary gap is the distance between the current level of output (Y1) and the potential level of output (Yfe).
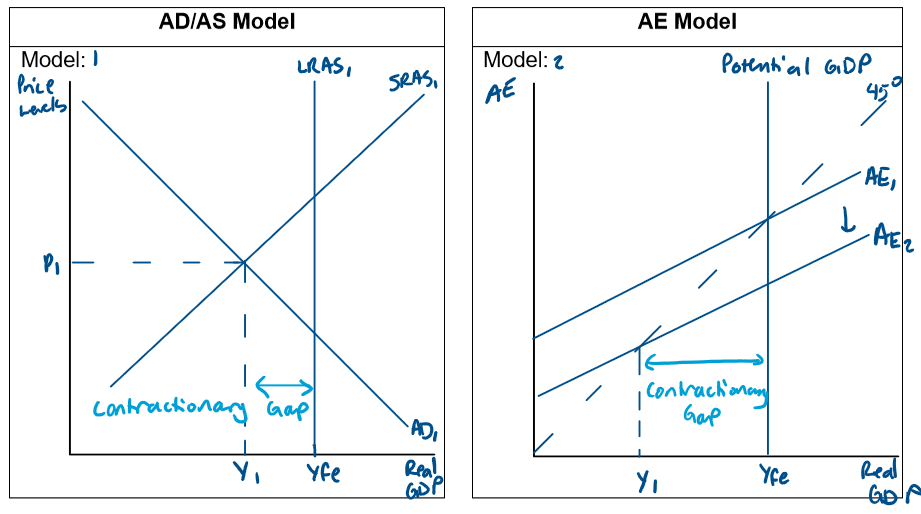
Draw the AD/AS Model & AE Model
When short run equilibrium is below the long-term equilibrium (below the potential level of output), the Aggregate Demand (AD) and Short-Run Aggregate Supply (SRAS) curves intersect to the left of the Long Run Aggregate Supply (LRAS) curve.
The contractionary gap is the distance between the current level of output (Y1) and the potential level of output (Yfe). Economic indicators will reflect this gap in output.
Characteristics of a Contractionary Gap
Lower rate of inflation (CPI): Due to excess capacity in the economy, price pressures are reduced, leading to a lower rate of inflation.
Higher levels of cyclical unemployment: As economic output falls below potential, cyclical unemployment rises because there is less demand for labour.
Fall in labour force participation rate: Unemployed workers may become discouraged and leave the labour force, reducing the participation rate.
Lower company profits, therefore lower investment: Reduced demand leads to lower sales and profits for businesses.
Slower growth in consumption: Especially noticeable in durable goods, as consumers tend to cut back on spending.
Increased need for social welfare/transfer payments: Higher unemployment leads to a greater need for social welfare programs, such as the Jobseeker allowance.
Lower interest rates: Central banks may lower interest rates to stimulate economic activity.
Changes in the Current Account Balance (CAB)
What do you Discuss when Asked About - the Expansionary (Inflationary) Gap
Define Expansionary Gap
Draw the AD/AS Model & the AE Model
Characteristics of an Expansionary Gap
Define Expansionary Gap
The distance between the current level of output (Y2) and the potential level of output (Yfe). Economic indicators will reflect this gap in output
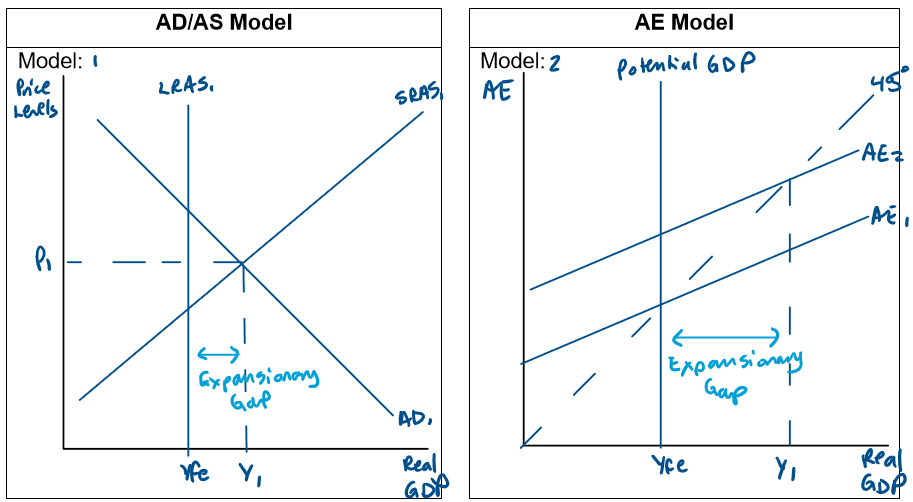
Draw the AD/AS Model & the AE Model
When short run equilibrium is above the long term equilibrium (below the potential level of output), the Aggregate Demand (AD) and Short-Run Aggregate Supply (SRAS) curves intersect to the right of the Long Run Aggregate Supply (LRAS) curve.
The expansionary gap is the distance between the current level of output (Y2) and the potential level of output (Yfe).
Economic indicators will reflect this gap in output.
For example, unemployment will decrease, wages rise, and there would be an increase in inflation.
Characteristics of an Expansionary Gap
Lower levels of cyclical unemployment: Consumer demand for goods and services is high, so firms need to employ labour to produce those goods and services.
Wages inflation will increase (WPI): Since there is competition in the labour market.
An increase in the participation rate: As people expect they will be able to find a job if they seek work.
An increase in company profits, confidence and investment.
Increases in consumer confidence and sales of durable and luxury items.
Reduced need for transfer payments/welfare payments such as Jobseeker
Changes in the current account balance (CAB
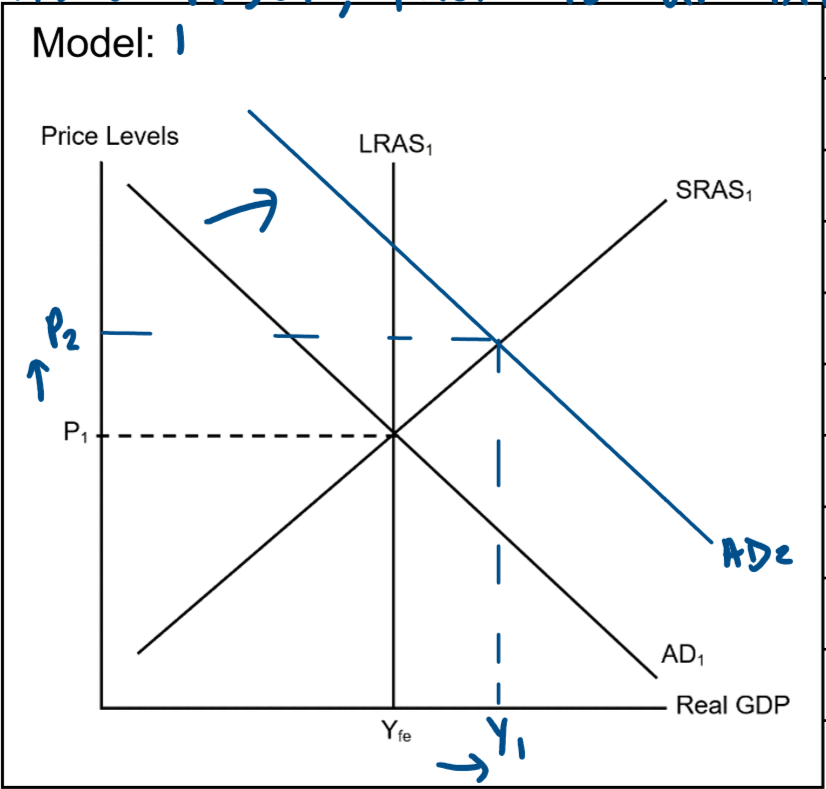
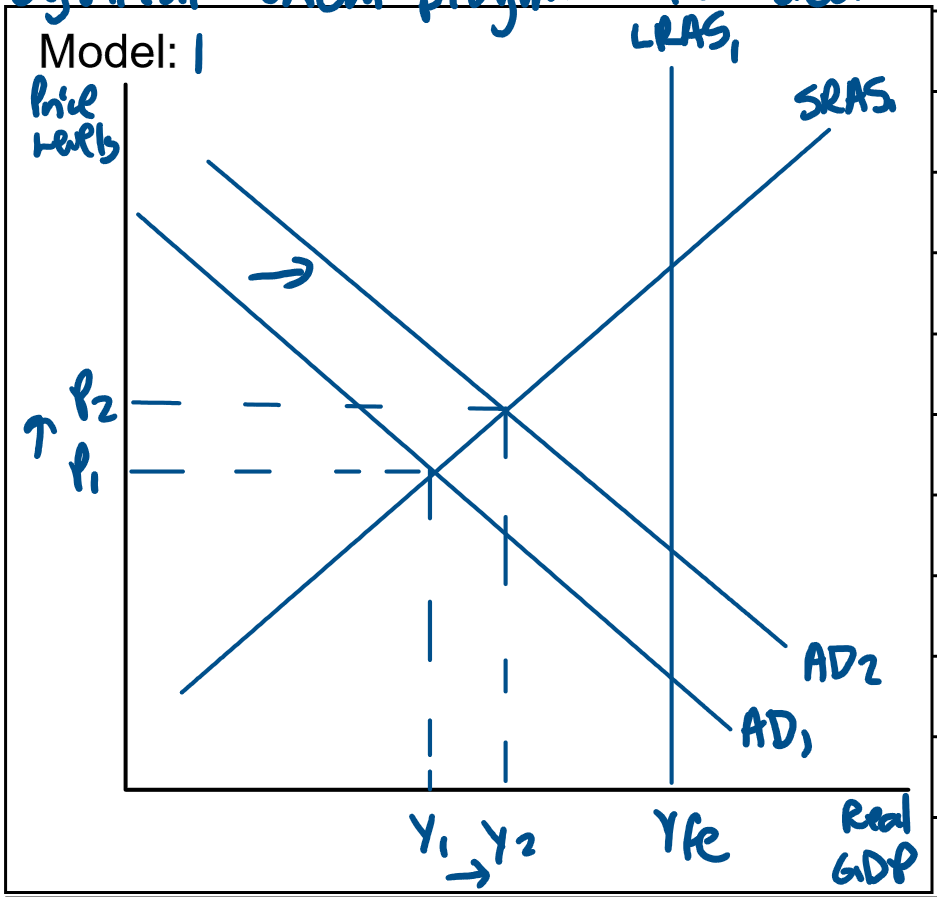
Demonstrate the Impact of Changes in Aggregate Demand & Aggregate Supply on the Equilibrium Level of Income/Output using the AD/AS Model (INCREASE IN AD)
An increase in a component of AD (C, I, G &/or (X-M) will cause an increase in aggregate demand.
As seen in model 1, this causes the AD curve to shift to the right from AD1 to AD2.
As a result there is an increase in real GDP, employment, income, & output from Yfe to Y1 & an increase in price levels & inflation from P1 to P2.
This increase in AD triggers the positive multiplier effect resulting in a greater increase in income & consumption relative to the increase in AD in the macroeconomy.
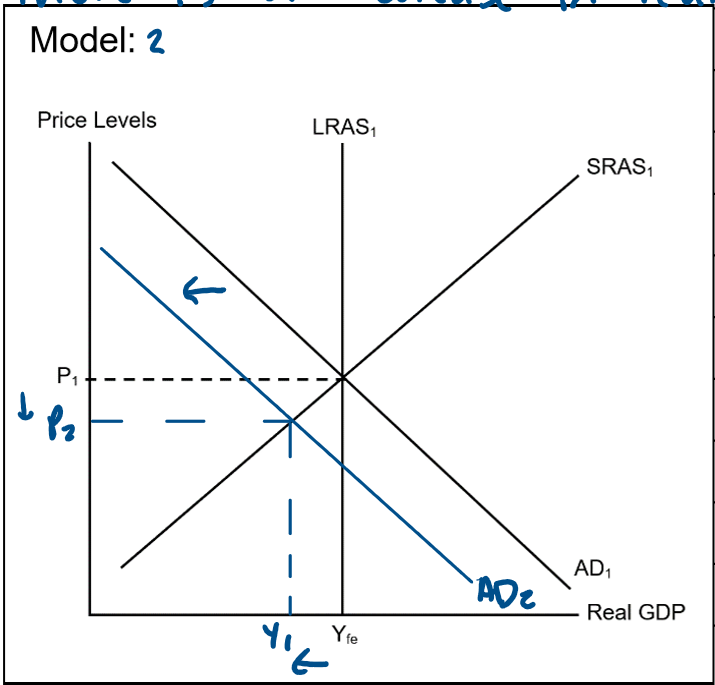
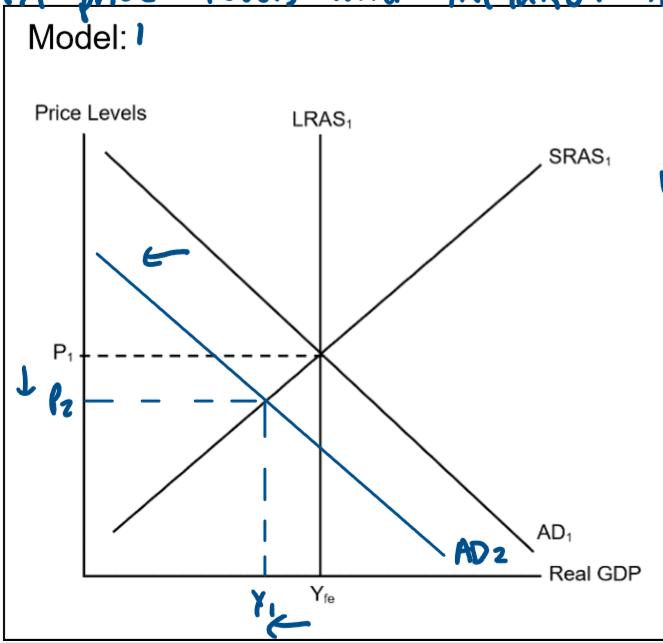
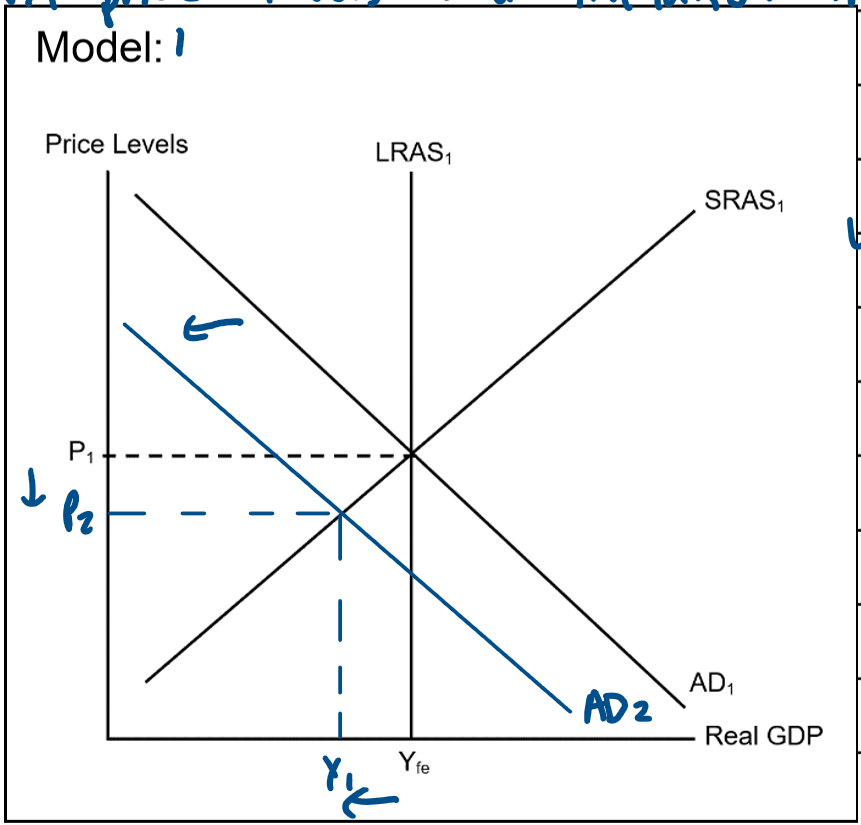
Demonstrate the Impact of Changes in Aggregate Demand & Aggregate Supply on the Equilibrium Level of Income/Output using the AD/AS Model (DECREASE IN AD)
A decrease in a component of AD (C, I, G &/or (X-M) will cause an decrease in aggregate demand.
As seen in model 1, this causes the AD curve to shift to the left from AD1 to AD2.
As a result there is an decrease in real GDP, employment, income, & output from Yfe to Y1 & an decrease in price levels & inflation from P1 to P2.
This decrease in AD triggers the negative multiplier effect resulting in a greater decrease in income & consumption relative to the decrease in AD in the macroeconomy.
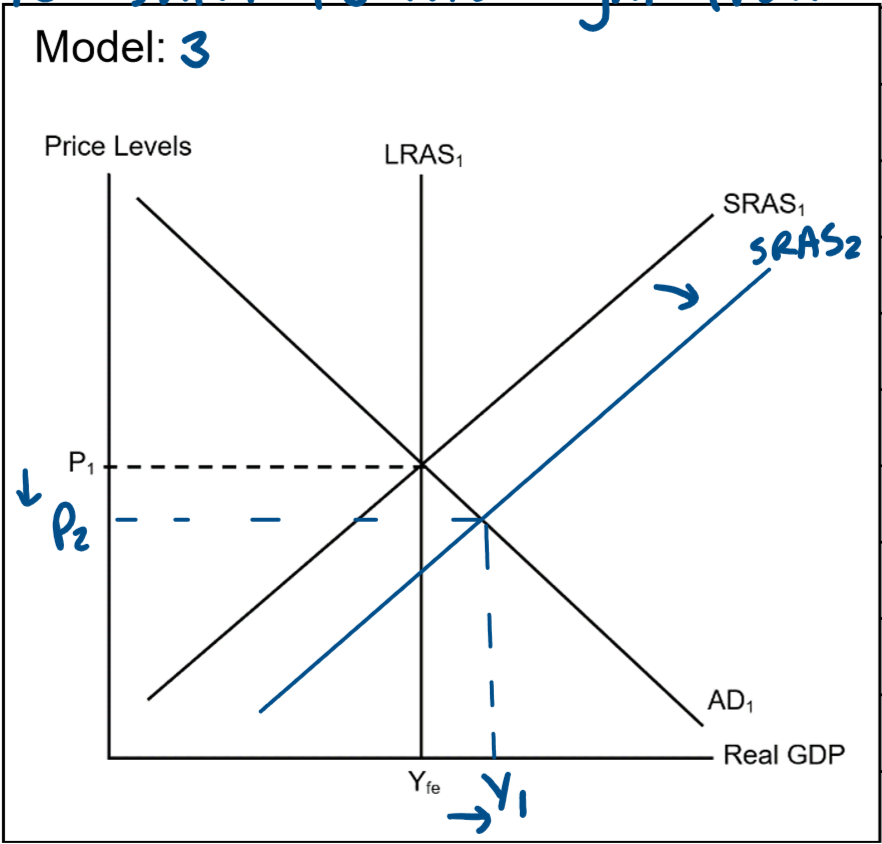
Demonstrate the Impact of Changes in Aggregate Demand & Aggregate Supply on the Equilibrium Level of Income/Output using the AD/AS Model (INCREASE IN SRAS)
A decrease in the cost of production &/or an increase in the availability of resources will increase short run aggregate supply.
In model 3, a decrease in SRAS will cause the SRAS curve to shift to the right from SRAS, to SRAS2.
As a result, there is an increase in real GDP, output, employment & income from Yfe to Y1 & a decrease in price levels & inflation from P1 to P2.
This increase in real GDP & decrease in price levels creates a deflationary gap (benign deflation).
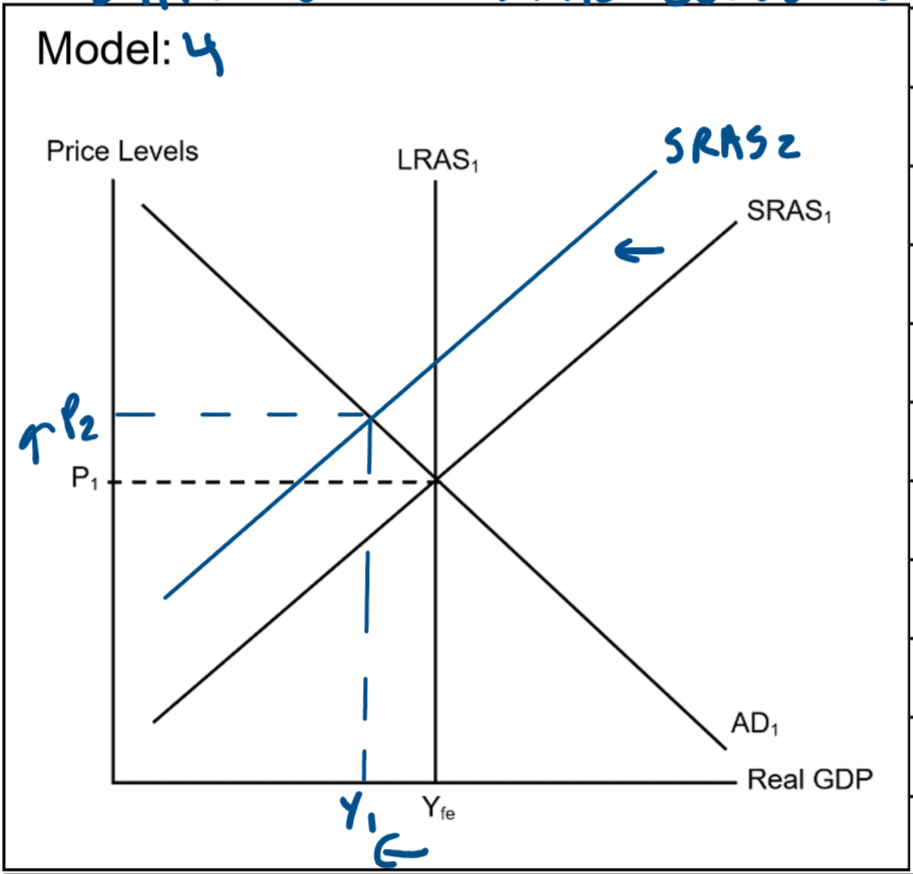
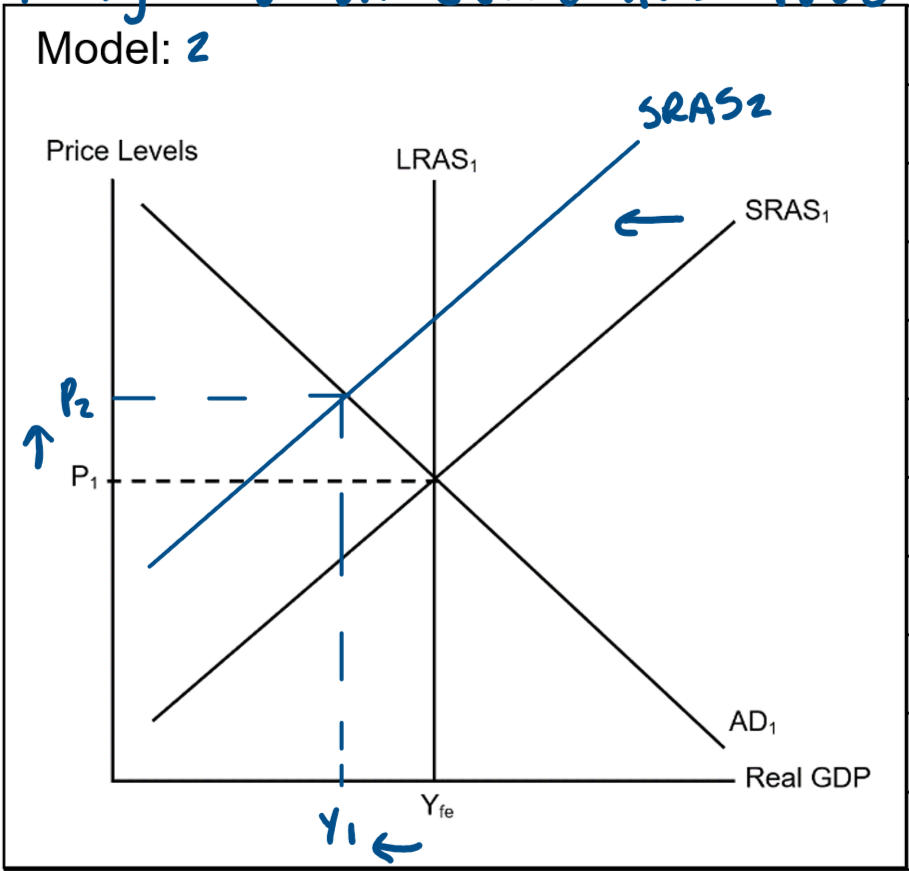
Demonstrate the Impact of Changes in Aggregate Demand & Aggregate Supply on the Equilibrium Level of Income/Output using the AD/AS Model (DECREASE IN SRAS)
An increase in the cost of production &/or the decrease in the availability of resources would cause a decrease in short run aggregate supply.
In model 4, a decrease in SRAR would cause a shift of the SRAS curve to the left from SRAS1 to SRAS2.
As a result, this decreases real GDP, output, income, & employment from Yfe to Y1 & increase price levels & inflation from P1 to P2.
This decrease in GDP & an increase in price levels/inflation creates stagflation.
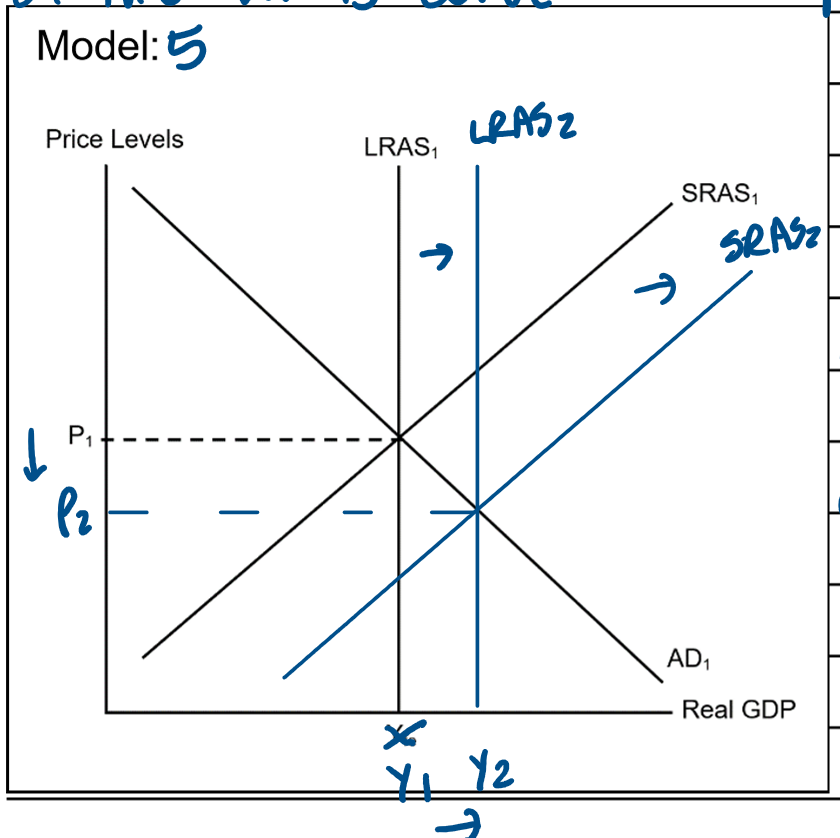
Demonstrate the Impact of Changes in Aggregate Demand & Aggregate Supply on the Equilibrium Level of Income/Output using the AD/AS Model (INCREASE IN SRAS & LRAS)
An increase in the quantity of resources &/or an improvement in technology & productivity will cause an increase in short run & long run aggregate supply.
In model 5, an increase in SRAS causes a shift of the SRAS curve to right from SRAS1 to SRAS2.
It also causes an increase in LRAS & a shift of the LRAS curve to the right from LRAS1 to LRAS2.
This causes an increase in real GDP, income, employment, & output from Y1 to Y2 & a decrease in price levels & inflation from P1 to P2.
This increase in Real GDP & decrease in inflation creates a deflationary gap.
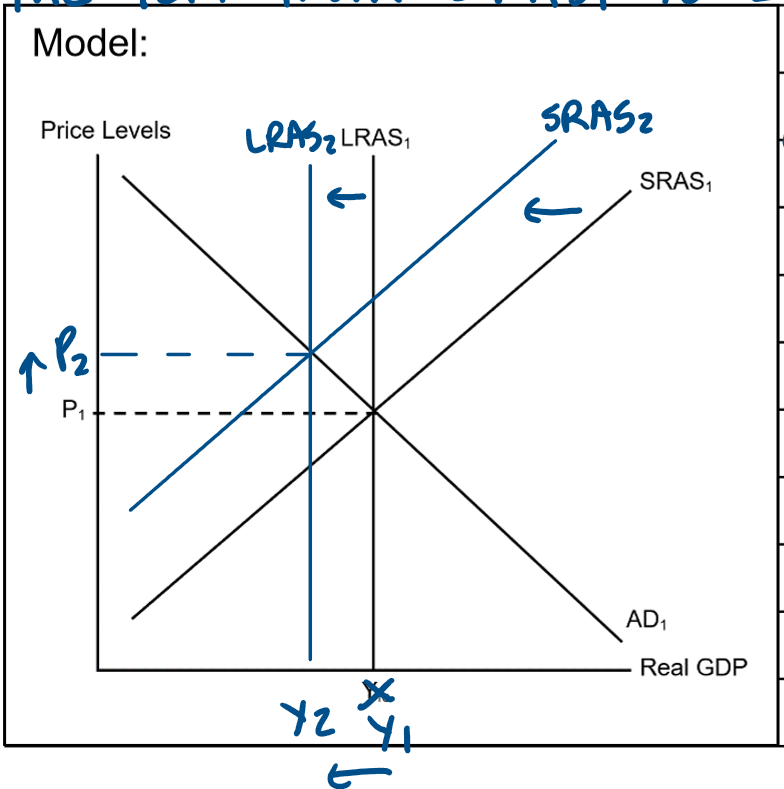
Demonstrate the Impact of Changes in Aggregate Demand & Aggregate Supply on the Equilibrium Level of Income/Output using the AD/AS Model (DECREASE IN SRAS & LRAS)
A decrease in the quantity of resources &/or a decrease in productivity will cause a decrease in SRAS & LRAS.
In Model 6, a decrease in SRAS causes a shift of the SRAS curve to the left from SRAS1 to SRAS2.
It also causes a decrease in LRAS & a shift of the LRAS curve to the left from LRAS1 to LRAS2.
This causes a decrease in real GDP, income, employment, output from Y1 to Y2 & an increase in price levels & inflation from P1 to P2.
This decrease in GDP & increase in inflation creates stagflation.
Use the AD/AS Model to Explain the Peak/Boom Phase of the Business Cycle
As shown in model 5, when the economy is at full employment (LRAS1=SRAS1=AD), price levels are P1 & output & employment is Yfe.
During the boom phase there is an increase in aggregate demand caused by an increase in a component of AD (C,I,G &/or (X-M)) & causes a shift of the AD curve to the right from AD1 to AD2, moving the economy below full employment (Yfe).
This causes an increase in price levels & inflation from P1 to P2 & an increase in real GDP, output, employment & income from Yfe to Y1.
Production levels are high which causes low cyclical unemployment therefore the unemployment rate decreases below the 4-4.5% target.
This triggers the positive multiplier effect as the increase in AD causes a larger increase in income & consumption in the macroeconomy.
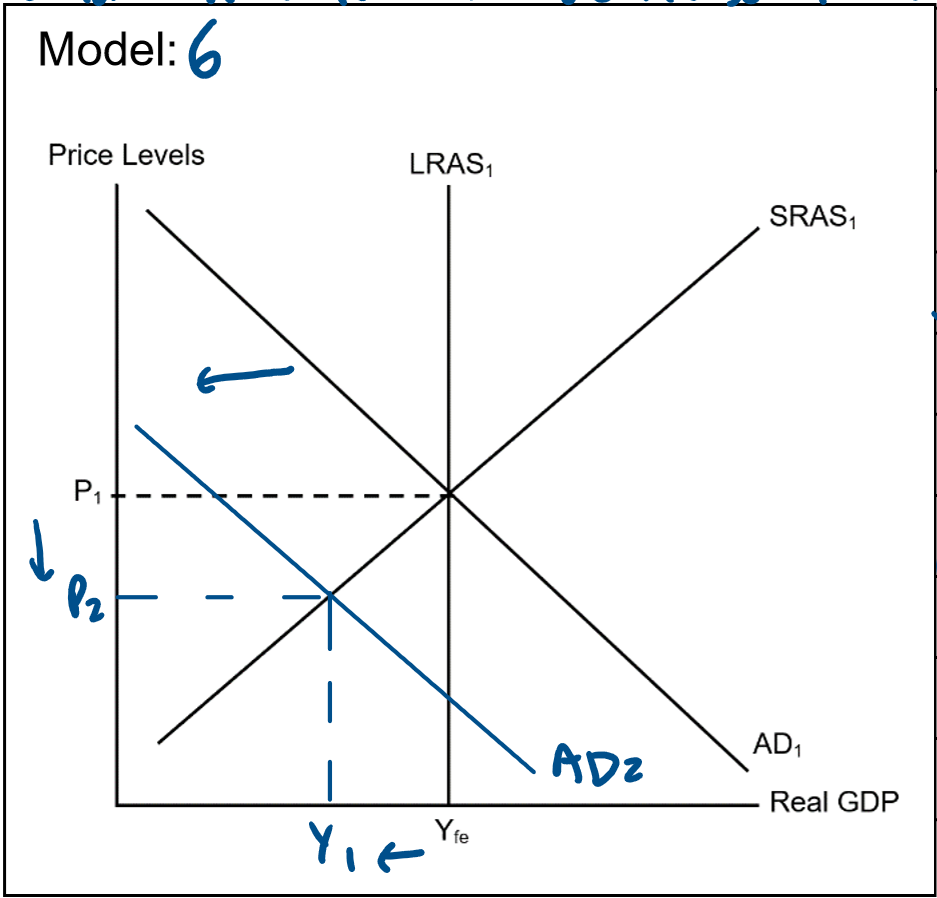
Use the AD/AS Model to Explain the Trough Phase of the Business Cycle
As shown in model 6, when the economy is at full employment (LRAS1 = SRAS1 = AD1), price levels are at P1 & output & employment is at Yfe.
During the trough phase aggregate demand is at its lowest due to decreases in the components of AD (C, I, G, &/or (X-M)).
This causes a shift of the AD curve to the left form AD1 to AD2, moving the economy below full employment (YFE).
This causes real GDP, output, employment, & income to decrease form Yfe to Y1 & price levels & inflation to decrease from P1 to P2.
Production/output levels are low which causes cyclical unemployment to be high therefore the unemployment rate is above the target range of 4-4.5%.
This triggers the negative multiplier effect as the decrease in AD creates a larger decrease in consumption & income in the macroeconomy.
Use the AD/AS Model to Explain the Contraction/Downswing Phase of the Business Cycle (Decrease in Aggregate Demand)
Decrease in Aggregate Demand
E.g., A decrease in aggregate demand (negative aggregate demand shock) causes the level of real GDP to fall below potential GDP (full employment).
As shown in model 1, when the economy is at full employment (LRAS1 = SRAS1 = AD), price levels are at P1 & output & employment is at Yfe.
During the contractionary phase, such as prior to the Covid recession in 2020, there is a decrease in aggregate demand due to a decrease in a component of AD (C, I,G &/or (X-M)).
This causes a shift of the AD curve from AD1 to AD2, moving the economy below full employment (Yfe).
Consequently, real GDP, output, employment & income to decrease from Yfe to Y1 & a decrease in price levels & inflation
from P1 to P2.
As a result, cyclical unemployment increases since production/output decreases causing the unemployment rate to increase above the target of 4-4.5%.
This decrease in AD will trigger a negative multiplier effect resulting in a decrease in income & consumption that is larger than the decrease in AD.
Use the AD/AS Model to Explain the Contraction/Downswing Phase of the Business Cycle (Decrease in SRAS)
E.g., A Decrease in SRAS (negative AS shock) causes the Level of Real GDP to Fall below Potential GDP (Full Employment).
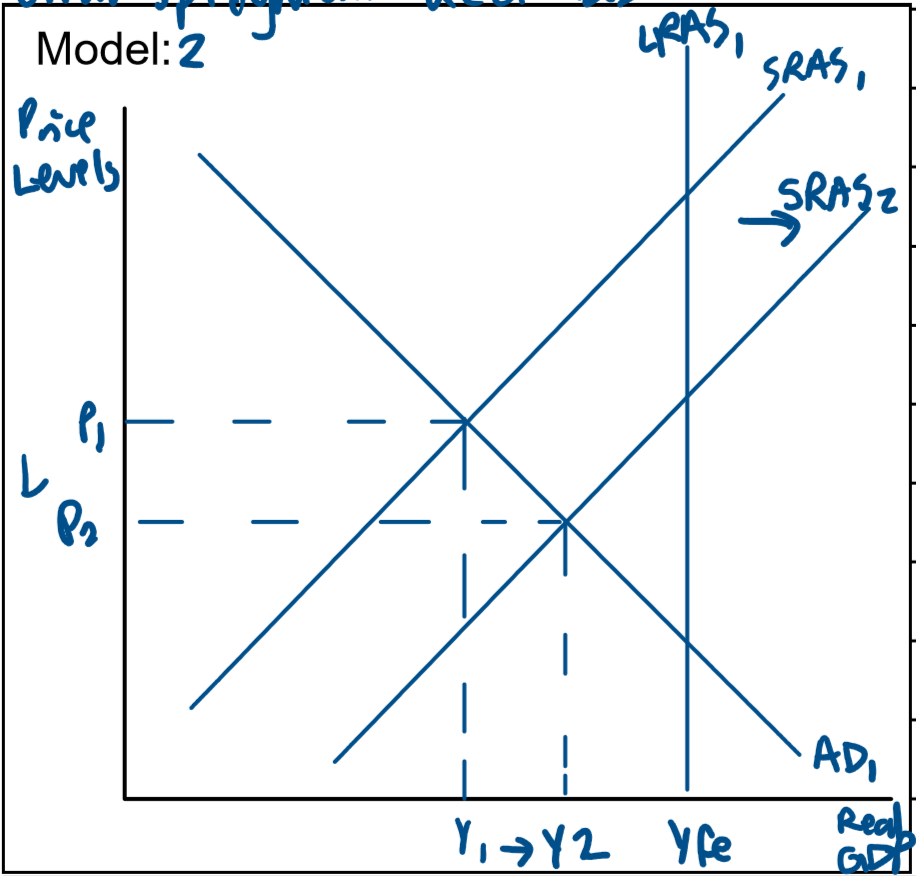
As shown in model 2, the economy is at full employment (LRAS1 = SRAS1 = AD1).
Here price levels are P1 & employment & output is at YFE.
A contraction caused by a negative supply shock (e.g., a natural disaster) decreases SRAS shifting the SRAS curve to the left from SRAS1 to SRAS2 moving the economy below full employment (Yfe).
This causes real GDP, output, employment & income to decrease from Yfe to Y1, & an increase in price levels & inflation from P1 to P2.
This causes an increase in cyclical unemployment because of a decrease in production/output therefore increasing unemployment above the 4-4.5% target.
When economic face increasing prices (inflation) & unemployment as well as decreasing GDP growth, this is known as stagflation which is often caused by negative supply shocks (e.g., 1970s oil shocks).
Use the AD/AS Model to Explain the Expansion/Upswing Phase of the Business Cycle (Increase in Aggregate Demand)
An increase in aggregate demand (positive AD shock) causes the level of real GDP to increase towards potential GDP (Yfe).
As shown in model 3 the economy is below full employment at SRAS1 = AD1.
Here prices are at P1 & output & employment is at Y1.
During an expansion there is an increase in aggregate demand due to an increase in a component of AD (C,I,G &/or (X-M)) causing a shift of the AD curve to thr right from AD1 to AD2, moving the economy towards full employment (Yfe).
This causes price levels & inflation to increase from P1 to P2 & real GDP, output, employment & income to increase form Y1 to Y2.
Production levels increase causing cyclical unemployment to decrease therefore unemployment decreases causing the unemployment rate to decrease towards 4-4.5% target.
This triggers the positive multiplier effect as the increase in AD creates a larger increase in income & consumption in the macroeconomy.
Use the AD/AS Model to Explain the Expansion/Upswing Phase of the Business Cycle (Increase in SRAS)
An increase in SRAS (positive AS shock) also causes the level of real GDP to increase towards potential GDP.
As shown in model 2, the economy is below full employment at SRAS = AD1.
Here price levels are at P1 & output & employment is at Y1.
An expansion caused by a positive supply side shock increases SRAS & causes a shift of the SRAS curve to the right from SRAS1 to SRAS2, moving the economy towards full employment (Yfe).
This causes price levels & inflation to decrease from P1 to P2 & real GDP, output, employment & income from Y1 to Y2.
Production levels increase causing cyclical unemployment to decrease therefore unemployment decreases towards the 4-4.5% target.