Ecology final
 Call Kai
 Learn
Learn Practice Test
 Spaced Repetition
 Match
Match Flashcards
 Knowt Play
1/38

There's no tags or description
Looks like no tags are added yet.
Name | Mastery | Learn | Test | Matching | Spaced | Call with Kai | Chat |
|---|
No analytics yet
Send a link to your students to track their progress
39 Terms
What are the positive interaction types facilitation, mutualism and commensalism? Give one example
of each type of interaction between two species. It is fine to use broad types of species (e.g.
pollinators and flowering plants) rather than a precise species
Facilitation: A where one species has a positive effect on another. Often this is through altered environmental conditions, such as in succession. Lots of examples exist: a nurse plant and the recipient (other) plant; a nitrogen-fixing plant adding nitrogen to new soil to help other plant species colonize.
mutualism: A ++ interaction, where each species benefits. E.g., plants gain pollination and pollinators gain nectar rewards, or corals gain photosynthate and the zooxanthellate gain physical protection; other examples were in lecture and the textbook. Some mutualisms are obligate, indicating a requirement for survival/growth, others are non-obligate.
commensalism: A +0 interaction where one species receives benefit from and it does not have a positive effect on the other species. Many examples exist. Animals that pick parasites off of other species are good examples, e.g., oxpeckers and large mammals in Africa south of the Sahara.
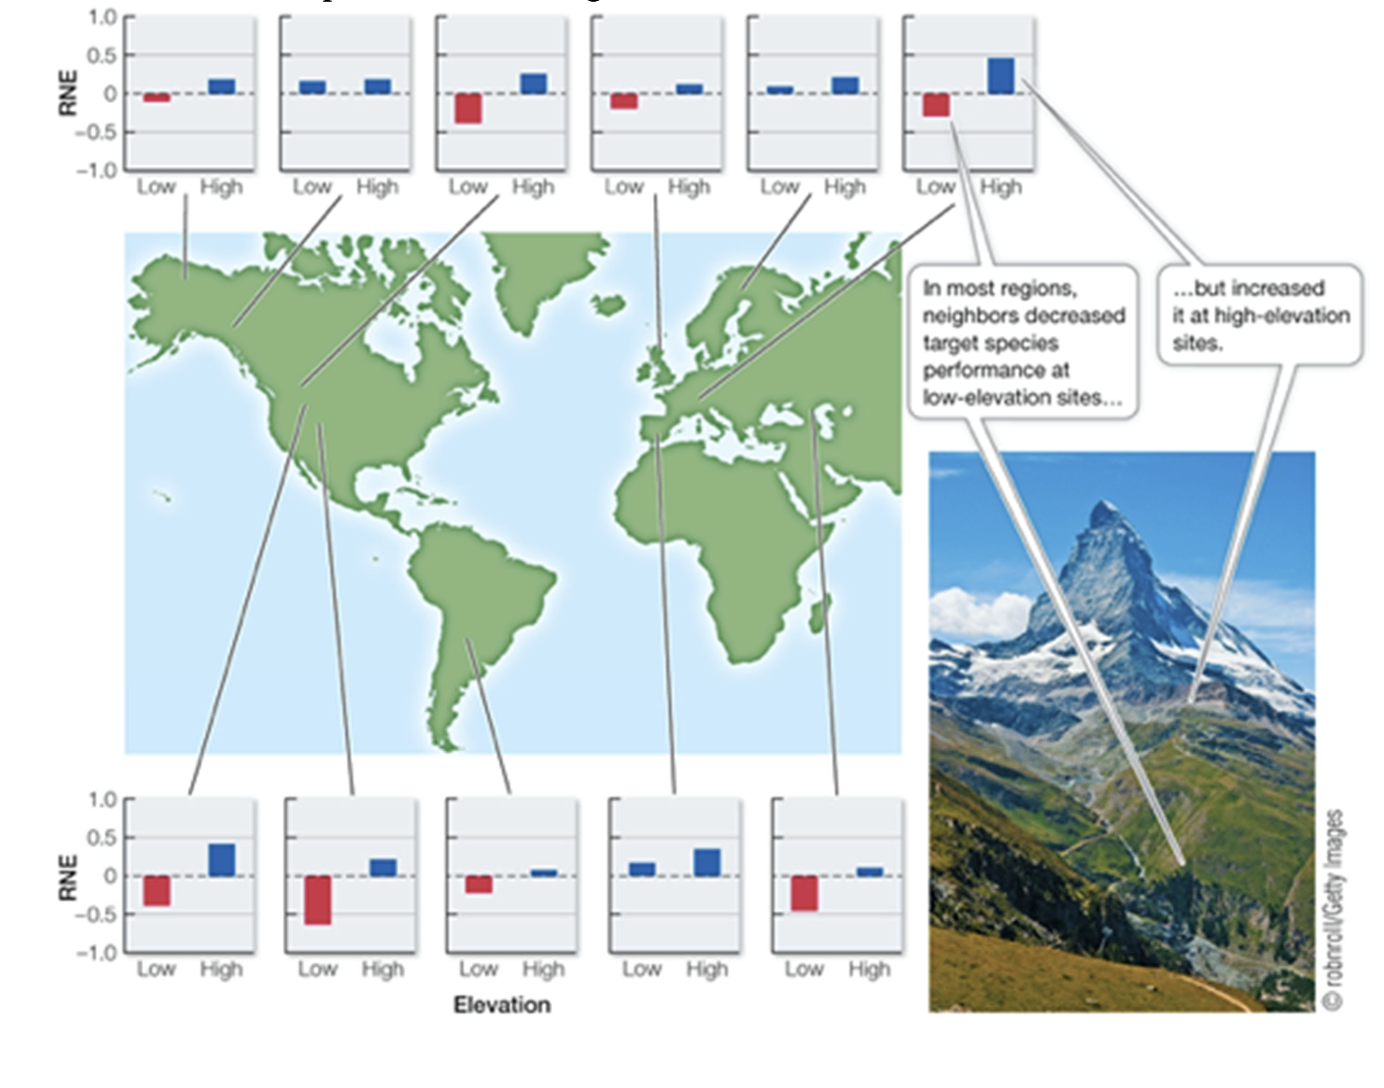
What type of positive interaction phenomenon is the following figure an example of? In what kind of environment is the phenomenon strongest?
The diagram illustrates nurse plant effects, when plants have positive interactions (facilitation)
whereby one plant protects another from harsh environmental conditions (e.g. cold or desiccation).
Stronger effects are found in extreme environments, such as high mountains or deserts.
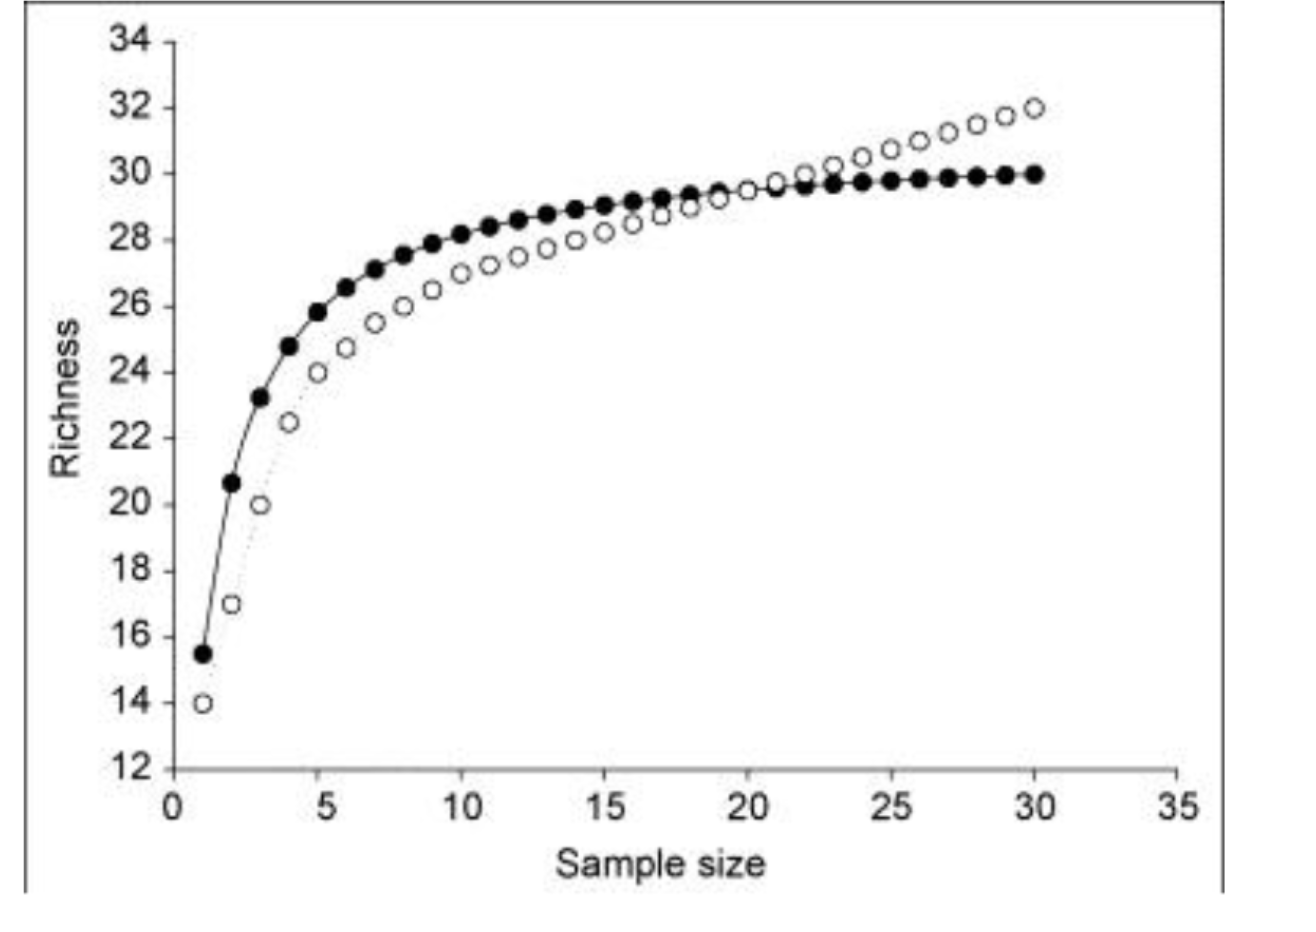
Be able to identify and explain which of these two collector curves likely came from an old-growth
forest, and which came from a second-growth forest (i.e., a forest regrowing from disturbance in
the last few decades).
The complexity of old-growth forests mean that they are likely to be extremely rich in species. Hence, we expect species richness to still be increasing despite having taken 30 samples. By comparison secondary-growth forests have a simpler structure and lower species richness, so we are more likely to have discovered almost all the species with 30 samples. The filled circles are second-growth and the unfilled old-growth forest.
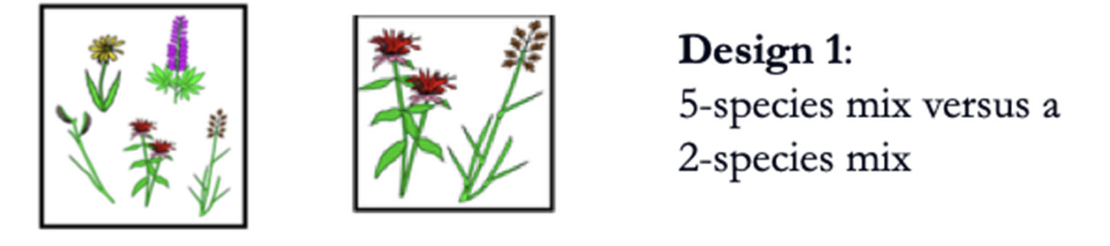
A researcher is planting different species of prairie plants into plots of grassland. Why might the
study design shown below show misleading results about the relationship between species richness and
ecosystem services (e.g., biomass stability, C or N fixation, resistance to disturbance)?
We would not know if differences between the 5-species mix and 2-species mix were due to
the identity of species (functional roles, phylogenetic differences, or taxonomic differences)
or due to richness.
What is functional diversity and how can we distinguish between functional
diversity and species richness effects on ecosystem functioning?
The number of types of functions in a community (collection of species) that are related to a specific ecosystem function. For example, leguminous plants, C3 and C4 plants are functional types that produce plant biomass in different ways, where plant biomass production is the ecosystem function.
What is functional diversity and how can we distinguish between functional
diversity and species richness effects on ecosystem functioning? (but explained more)
A community could have many species but all doing the same job → low functional diversity.
Or it could have only a few species but each doing very different things → high functional diversity
2. What the example in the answer is saying
“Leguminous plants, C3 and C4 plants are functional types that produce plant biomass in different ways.”
This means:
Legumes fix nitrogen → they add nitrogen to the soil
C3 plants photosynthesize using the C3 pathway
C4 plants photosynthesize using the C4 pathway (more efficient in hot/dry environments)
These are three different strategies for producing biomass.
Even if you only had three species, if each belongs to one of those groups, you’d have high functional diversity, because the ecosystem has three different “tools,” “roles,” or “ways of making biomass.”
🌼 3. How do we distinguish species richness effects from functional diversity effects?
Scientists often use designs like the image you posted:
Example:
5-species mix might have 5 different functional groups
2-species mix might only have 2 functional groups
If the 5-species mix produces more biomass, how do we know if it’s because:
There are simply more species? (species richness), or
There are more types of functions present? (functional diversity)
To tell the difference, researchers:
Create mixes with the same number of species but different functional group diversity
OR mixes with the same number of functional groups but different species richness
This allows them to tease apart the two effects.
🌻 4. A simple way to picture it
Imagine tools in a toolbox:
Species richness = number of tools
5 tools vs. 2 tools
Functional diversity = kinds of tools
A hammer, a screwdriver, and a wrench (high functional diversity)
vs.
3 types of screwdrivers (low functional diversity)
Your toolbox might have many tools, but if they all do the same thing, it doesn’t help the system function better.
🌈 Summary in one sentence
Functional diversity is about what species do, while species richness is about how many there are. We distinguish their effects by designing experiments where we independently vary the number of species and the number of functional types.
Name and describe the four main ways biodiversity supports ecosystem functions
Complementarity: each species uses resources differently, so the resource pool is most fully used by a diverse mix of species.
Averaging or portfolio effect: each species responds differently to disturbances.
Functional redundancy: when a species is lost, another species from the same trophic level or functional type can replace its function
Selection or sampling effect: a more diverse community is more likely to contain the over-achiever species (e.g., most productive)
Define each of the following and describe the difference between alpha, beta, and gamma diversity.
Alpha is local richness, beta is turnover (change) of species across space, and gamma is regional (total) species diversity
Under the Clementsian concept, two samples of the same community (e.g., two stands of
Douglas-fir forest in different locations) will have nearly identical sets of species (T / F)
T
Under the Clementsian concept, succession will follow a predictable sequence of species that is
always the same for any given vegetation type (T / F)
T
The fossil record of post-glacial plant community change, as studied by Margaret Davis, shows
patterns that best fit the Gleasonian concept (T / F)
T
The Gleasonian concept assumes that species in a community often have strong mutualistic
relationships (T / F)
F
It’s harder to map plant communities if the Gleasonian concept is true than if the Clementsian
concept is true (T / F)
T
Two examples of primary succession – name the community, the disturbance, at least one early-
successional species, and the climax community
Eruption of Mt Saint Helens, volcanic eruption, alpine meadow flowers (choose one) and old growth conifer trees (e.g. Douglas fir)
Glacial retreat in Alaska, with the scouring from the glacier as disturbance. Lichens and mosses were early (pioneer) species, and spruce and hemlock trees as the climax.
Rocky intertidal boulder fields in S California. Disturbance due to boulders turning over. Ulva a green alga is early successional, and Gigartina, a red alga is late successional (climax)
Rocky intertidal boulder fields in Oregon. Disturbance due to boulders turning over. Barnacle Chthamalus is the first colonizer, three species of macroalgae are the climax community.
Sand Dunes on the shores of Lake Michigan that start with bare sand are primary succession or if they are partly disturbed could be secondary succession, wind blowing of sand is the disturbance, beach grass is an early successional species, and pine trees as the climax vegetation
Two examples of secondary succession – name the community, the disturbance, at least one early-successional species, and the climax community
Elton studied pine forests after logging (the disturbance). Sphagnum moss was early successional and pine or mixed pine/deciduous forest was the climax community.
Salt marshes in New England, wave/tidal action as disturbance. Distlichis (spike grass) is early successional. Spartina (cordgrass) and Juncus (sedge) are the climax communities.
Sand Dunes on the shores of Lake Michigan that start with bare sand are primary succession or if they are partly disturbed could be secondary succession, wind blowing of sand is the disturbance, beach grass is an early successional species, and pine trees as the climax vegetation.
Two examples of facilitation – name the community, the facilitating species, at least one
facilitated species, and the mechanism of facilitation
Spruce colonization in Glacier Bay was aided by Dryas that increased soil nitrogen (etc.).
Also in the same system alders increased Spruce germination through more organic matter, nitrogen and mycorrhizae.
In salt marshes in New England Presence of Distichlis helped to shade the soil surface, thus decreasing salt accumulation and reducing stress for Juncus.
Two examples of inhibition – name the community, the inhibiting species, the inhibited species, and the mechanism of inhibition
Spruce germination in Glacier Bay was inhibited Dryas and Alder presence and lower growth resulted, and more seed predation, effects were due to cover of other species and more seed predators present when other plants were present. (There are other examples in the same system.)
In Rocky intertidal boulder fields in S California, Ulva is able to inhibit other seaweed species, why doesn’t it always dominate? Through a series of further experiments, Sousa found that grazing crabs preferentially fed on Ulva, thus initiating a transition from the early Ulva stage to other mid- successional algal species.
A community of aquatic algae in a lake is sampled by taking water samples. Estimate the total
number of species in the lake (S est ) if the total observed number of species in 20 samples (Sobs ) is 338, and one sample (L) contains 70 species and two samples (M) contains 90 species
Chao’s Richness Estimator: S est = S obs + L 2 /2M, where S est = estimated true # of species, S obs = total observed species, L = # species found in one sample, M = # species found in two samples
Sest=338+(70x70/(2*90)) = 365.22 = 365 species
Succession and Restoration. You’re an ecologically-trained land manager, whose goal is to restore a
meadow to an oak forest as rapidly as possible.
a) Define facilitation, inhibition and tolerance (in the context of succession)
Facilitation – one species helps another establish. The classical examples are early successional
species (e.g. lichens and mosses) helping to form soil that is required by later colonizing species, ornurse plant effects
Inhibition: early colonizing species inhibit (retard or prevent) growth of later successional species and need to be removed to allow the later colonizing species to come into the community
Tolerance, species tolerate one another without strong effects on one-another. Species that disperse earlier into the community are the ones that are early successional, and slower dispersing species tend to be later in succession. Hence dispersal is a clue to this type of mechanism.
If you think facilitation is the dominant process in this successional sequence, how would you
proceed? (1) plant oaks; weed out all other species (2) plant oaks and don’t bother weeding out
other species; (3) plant herbs and grasses, then cedars, then oaks
Same as (a), but for inhibition
Same as (a), but for tolerance
Which model (facilitation, inhibition, or tolerance) is least likely to be important in this case,
based on general patterns in primary and secondary succession?
(3) plant herbs and grasses, then cedars, then oaks
(1) plant oaks; weed out all other species
(2) plant oaks and don’t bother weeding out other species;
inhibition because the species are coexisting at the same time and there is no indication that one
species has to decline before the next species can grow/colonize after it.
You could also make an argument for facilitation because the environment is not particularly
harsh and soil is already present.
2) Graph what classically happens to the following variables over time in primary succession:
a) Biomass: increases to an asymptote
b) Productivity: increases to peak and either stays there or declines.
c) Diversity: increases to peak and either stays there or declines.
d) the average longevity (or other ‘K-selected’ trait) of species: increases from r to K selection as
time since disturbance increases
have to draw
a) For oceanic islands, the exponent z of the species-area relationship is ̃0.30. When you sample an island of 100 hectares, you find 20 bird species. On a nearby island of 1000 hectares, how many bird species would you expect to find?
Log(20)=intercept+0.30Log(100),
Intercept=log(20)-0.30Log(100)
using log base 10
intercept=1.301-0.6=0.701.
Log(S) = 0.701+0.30Log(1000) = 1.601
S = 10^1.601 = 39.9 species
Or S 2 = S 1 x (A2 /A1 ) z =20 x (1000/100)^0.3 = 39.9
b) A 10,000-hectare forest with 50 bird species is reduced to a 2,000 hectare remnant fragment. If
the exponent z of the species-area relationship is ̃0.2, how many bird species would you expect
would remain in the fragment?
S 2 = S 1 x (A2 /A1 ) z =50 x (2000/10,000)^0.2 = 36.2 = 36 species
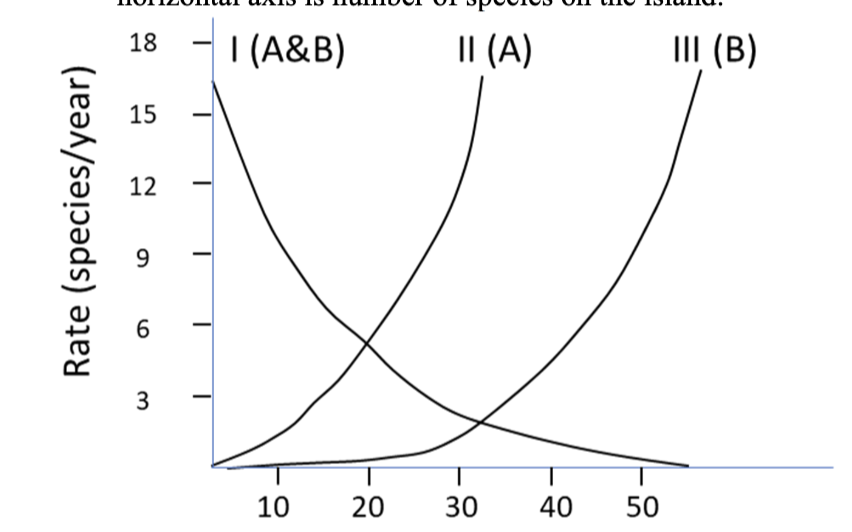
MacArthur-Wilson Island Biogeography Theory. Questions a-e refer to this figure where the
horizontal axis is number of species on the island
a) Curves II and III represent the extinction rate as a function of the number of species on an island.
b) Curve I represents the colonization rate as a function of the number of species on an island.
c) The equilibrium number of species for island B is about 33 species.
d) Based upon the curves, in what geographical attribute is Island A different from Island B? A is smaller than B
e) There is a turnover rate of about 5 or 6 species/year (give number and units) on island A
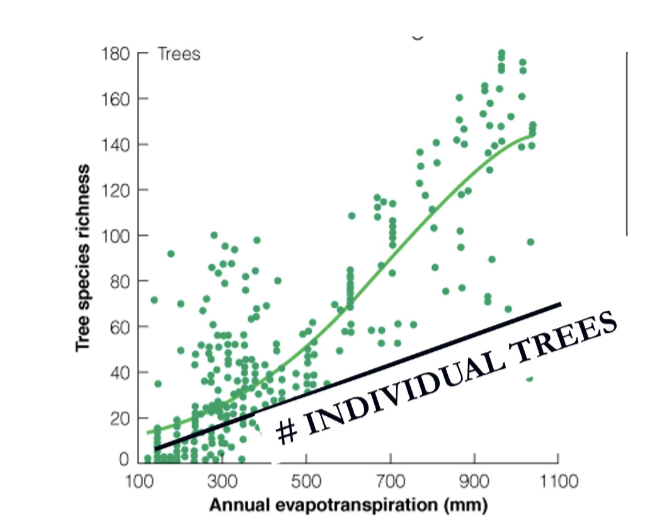
Tropical Diversity. One theory of why there are more species in the tropics is represented in the
following graph
a) What idea does this figure convey that relates to diversity patterns? What does it lead us to
conclude about this idea?
That tree species richness cannot be explained by carrying capacity (being higher in the tropics because of higher productivity), which is indicated by the number of individual trees
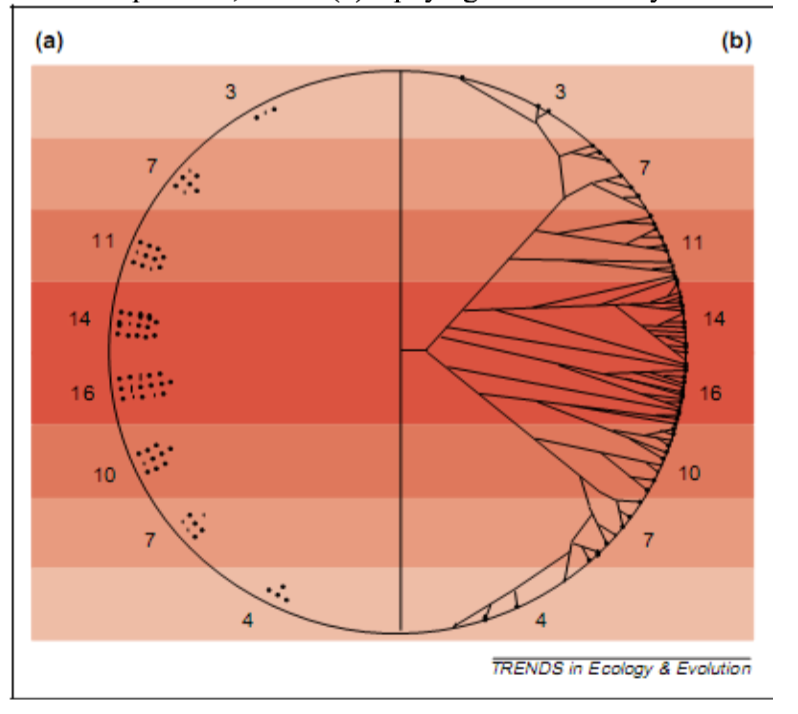
Tropical Diversity. One theory of why there are more species in the tropics is represented in the
following graph
b) What TWO THINGS does this figure (from Wiens and Donoghue 2004) BEST illustrate about tropical versus non-tropical latitudes? In the figure the circle represents planet Earth and darker red colors represent warmer temperatures. In (a) numbers of species (dots) are correlated with temperature, and in (b) a phylogenetic diversity is shown to be correlated with temperature.
a. Higher species richness in the tropics
b. Higher phylogenetic diversity in the tropics
c. Higher functional diversity in the tropics
d. Higher ‘carrying capacity’ for species in the tropics
e. Faster speciation in the tropics
a. Higher species richness in the tropics
b. Higher phylogenetic diversity in the tropics
Describe three processes that take up CO2 from the atmosphere and three processes that add CO2 to the atmosphere
Remove CO2 from the atmosphere Photosynthesis, calcification, CO2 dissolution/dissolving in the oceans
Add CO2 to the atmosphere: fossil fuel burning, land clearing, volcanic eruptions
What is the residence time of a molecule of C in the deep oceans and how would you calculate it
based on the total pool and flux rate? What is the importance of this for climate change?
36,000 Gt pool, leaves at a rate of (flux) 40 GtC/year (to atmosphere) + 0.23 GtC/year to sediments
=> 36000/40.23 = 894.85 years. This is a long time and means that this carbon is locked up for a long
time and not going back to the atmosphere rapidly.
8) For each of the following explain what change is expected with climate change in a temperate region:
a) Summer, winter and spring/fall temperatures? Which changes most?
b) Number of frost days?
c) Number of extreme hot days?
d) Length of the growing season?
a) Spring/fall temperatures change the most because of differences in timing. Summer temperature
extremes are also more extreme than changes in extremes at other times of the year. Winter temperatures become milder and fewer extremely cold days
b) Declines
c) Increases a lot because of increased average and variation in temperature
d) Increases because of earlier spring and later fall/autumn
9) The following questions relate to range shifts of species:
a) What is a climate envelope?
b) Why might more dispersive species be more impacted by warming than less dispersive species?
c) Why might species with small geographic ranges be more impacted than species with larger
ranges?
d) Why might survival during a warming climate be more likely for species on a mountain than
species on a flat plane?
a) The set of suitable climatic conditions within which a species is found.
b) They are not, less dispersive species are more impacted by warming because they cannot move to stay within their climate envelope of suitable conditions.
c) They would have to disperse in order to survive, or they could adapt evolutionarily.
d) Distances needed to move to maintain a climate envelope (set of climatic conditions) are smaller on mountains than in lowlands, providing the top of the mountain is not reached.
Describe two examples of ecological changes in phenology that are expected in temperate regions because of climate change.
In temperate regions! Earlier flowering in spring, Earlier leaf-out in spring, earlier migration, earlier breeding, etc. Also, later flowering in fall, longer breeding seasons, etc.
Describe an example of a policy mechanism (e.g., a treaty) that has helped slow climate change. How did it come about? Why was it possible?
Montreal Protocol, international agreement to reduce CFC and HCFC production and emissions that break down Ozone (a greenhouse gas) and reduce UV exposure. It was a voluntary agreement. It was possible because the chemistry was known and alternative compounds were available to CFC and HCFC’s.
Planting trees and increasing algal growth in the oceans are two major proposed climate mitigation measures. Explain how each works and processes that make it more or less successful
Trees lock up CO2 through photosynthesis and put into wood that is slow to decompose. Algal growth is limited by iron and so adding iron to the oceans can increase algal growth, some of the algae sink when they die, getting locked up in deep long residence time sediments
Habitat restoration and creation will be essential for climate change adaptation of ecological
communities and for imperiled species. Describe an example of a habitat restoration or creation
process that is designed to help an imperiled species
Many examples are possible. Salmon along Putah Creek and creation of shallow breeding habitat., Red-cockaded woodpeckers and fire restoration in the SE USA are two examples we talked about
What is assisted migration (managed relocation)? What is a potential benefit and a potential problem with it?
Human movement of species to areas outside of their current geographic range. Could allow
colonization of new habitats that will remain suitable in the face of climate change, especially
important for dispersal-limited species.
Risks of disease spread, creating communities that we don’t know what will happen in them, creating
invasive species, genetic mixing with other species that alters evolution, etc. It is costly and we
cannot do it for all species.
Describe two different ways that the concept of fundamental and realized niche can be used in
ecology and give an example of each
There are many uses: showing how climate change impacts the potential distribution of a species
(lots of possible examples), showing how different factors (competition, predation, diseases,
climate) combine to impact a species, showing that a species has a potential geographical area that
is not yet occupying (e.g. kangaroos early in the course).
Under climate warming, Xlandia (a fictional country) is expected to become warmer and drier. What
types of plants might become more common there (broad types of plants, and photosynthesis
type)?
C4 or CAM photosynthesis plants and the kinds of species that have each of these types of photosynthesis.
A warm arid region is expected to greatly increase in rainfall because of climate change. What
change might you see in biomass production (net primary productivity), and is it expected to be
limited by temperature or rainfall before and after climate change? In your answer include actual
and potential evapotranspiration to help explain what is happening.
NPP increases, before climate change is rainfall limited and could be temperature limited afterwards. Potential evapotranspiration is greater than precipitation before change, whereas is lower after climate
change.
If you were trying to design a network of nature reserves what would you prioritize for those
reserves in terms of size of reserves, edge habitat, and dispersal corridors? Think about this in
relation to (i) the equilibrium theory of biogeography, and separately to (ii) a metapopulation of an endangered predator and its prey
Larger is better for reducing extinction and maximizing species diversity in both theories.
Connectivity and dispersal corridors aid dispersal (and gene flow) as a source of recolonization/immigration in both theories
Minimize edge habitat because it is degraded relative to non-edge habitat. It is not in either of the
theories.