BusAn _ L3 : Introduction 2 Data Visualization
1/24
There's no tags or description
Looks like no tags are added yet.
Name | Mastery | Learn | Test | Matching | Spaced |
|---|
No study sessions yet.
25 Terms
Introduction to Data Visualization for Hospitality Management
Lesson Outline
1. Purpose and Importance of Data Visualization in Hospitality
2. Benefits and Limitations
3. Impact on Future Careers
4. Types of Charts & When to Use Them
5. Hands-On Examples (Using Excel)
6. Summary and Key Takeaways
7. References and Further Reading
Lesson Objectives
By the end of this lesson, students will be able to:
1. Understand the role and purpose of data visualization in hospitality management
2. Identify key benefits and potential drawbacks
3. Recognize various types of charts and their applications
4. Apply basic data visualization techniques using Microsoft Excel
5. Evaluate how visualization supports hospitality operations and strategy
Purpose of Data Visualization
• Data visualization is the art and science of turning data into visual formats such as charts, graphs, and dashboards. It enables hospitality professionals to:
1. Quickly interpret complex data
2. Identify patterns, trends, and outliers
3. Support evidence-based decision-making
4. Communicate insights to both technical and non-technical stakeholders
Importance in Hospitality Management
• The hospitality industry operates in a fast-paced, datadriven environment. Every guest, booking, and transaction generates data. Visualization transforms raw data into insights that support:
1. Revenue management
2. Customer satisfaction analysis
3. Labor scheduling
4. Operational efficiency
5. Strategic marketing
Benefits of Data Visualization
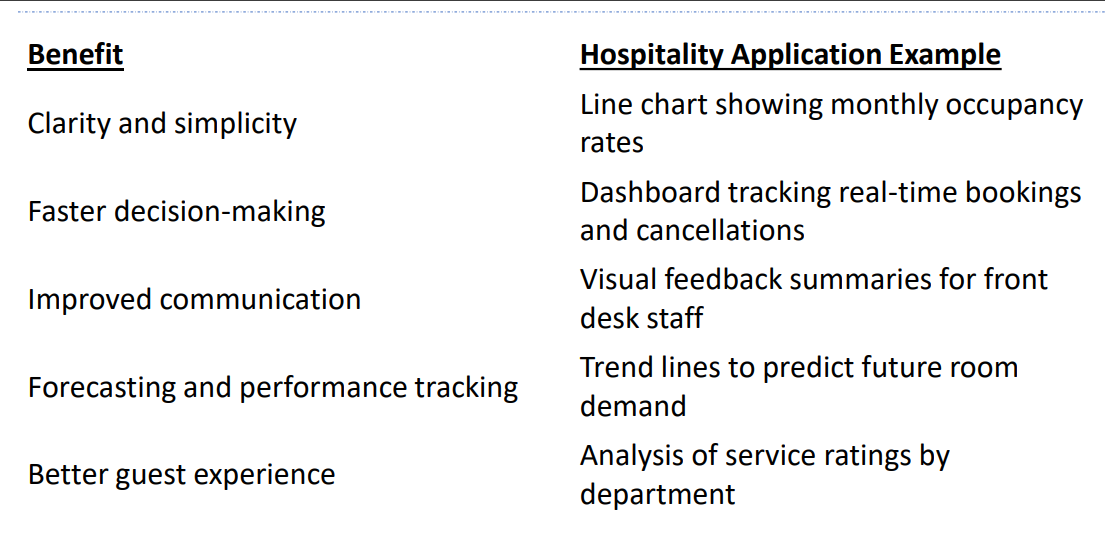
Benefit
Clarity and Simplicity
Hospitality Application Example
Line chart showing monthly occupancy rates
Benefit
Faster decision-making
Hospitality Application Example
Dashboard tracking real-time bookings and cancellations
Benefit
Improved communication
Hospitality Application Example
Visual feedback summaries for front desk staff
Benefit
Forecasting and performance tracking
Hospitality Application Example
Trend lines to predict future room demand
Benefit
Better guest experience
Hospitality Application Example
Analysis of service ratings by department
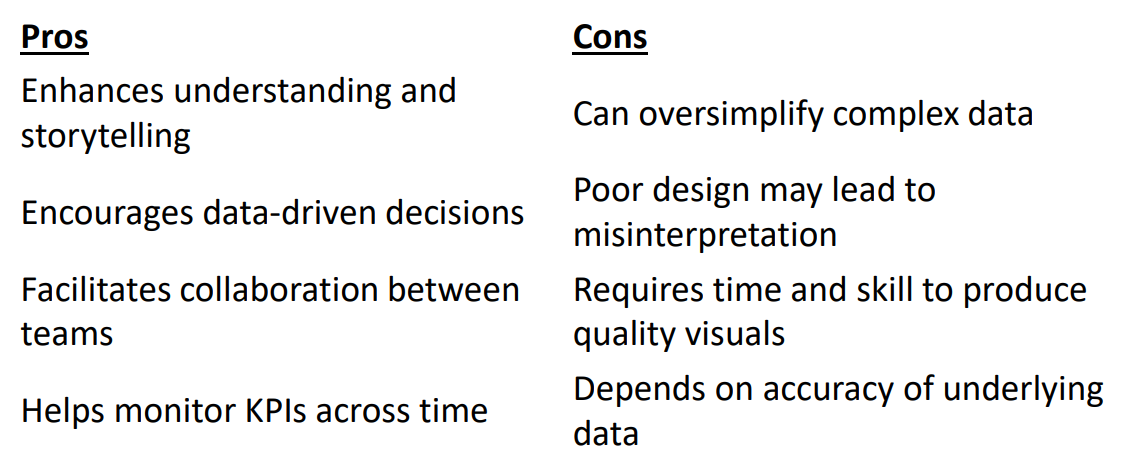
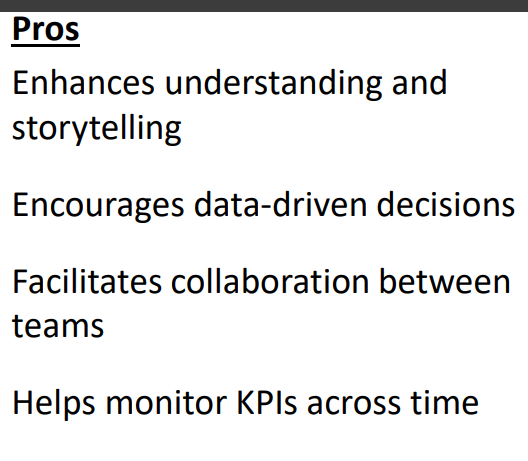
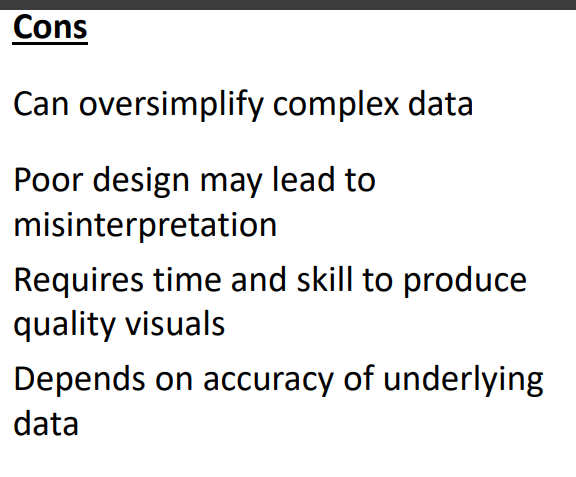
Pros and Cons
Impact on Future Hospitality Careers
• Mastering data visualization will benefit you in roles such as:
1. Hotel Manager: Track revenue, bookings, and staffing needs
2. Marketing Coordinator: Visualize campaign performance
3. Event Manager: Use Gantt charts for scheduling logistics
4. Revenue Analyst: Build dashboards for RevPAR, ADR, and occupancy trends
• With data literacy, you'll be equipped to make smarter, faster, and more competitive decisions.
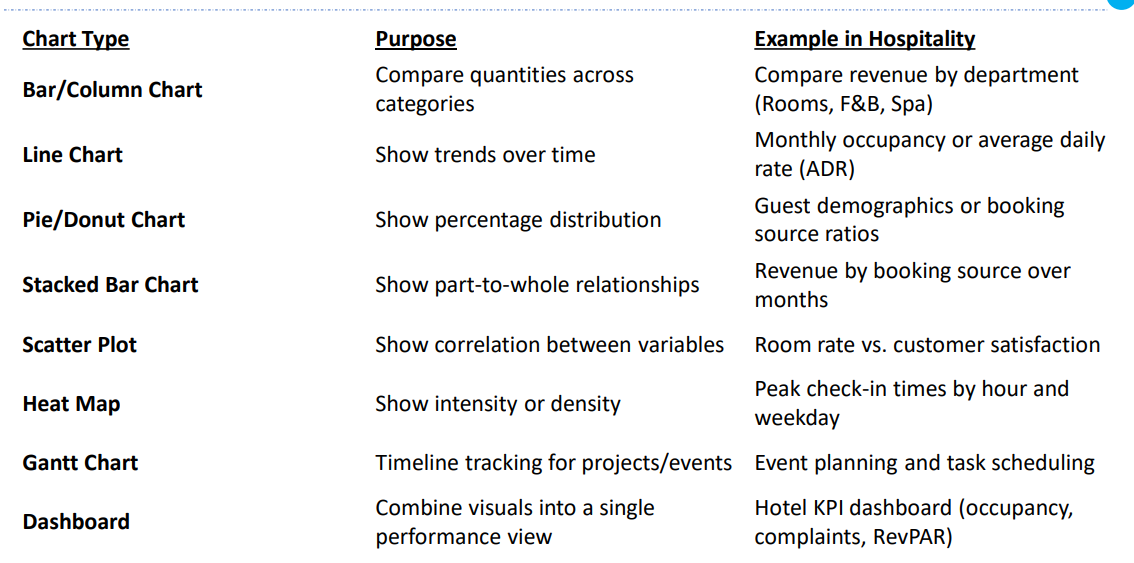
Types of Charts and When to Use Them


Summary
• Data visualization is a critical skill in the data-rich hospitality industry.
• It turns information into insight and enables better decisions and communication.
• Mastering Excel chart types helps you track performance, monitor trends, and enhance service quality.
• It is a key competency for future hospitality professionals across all departments.
Related Literature & References
Books: • Few, Stephen (2012). Show Me the Numbers: Designing Tables and Graphs to Enlighten. Analytics Press. • Knaflic, Cole Nussbaumer (2015). Storytelling with Data: A Data Visualization Guide for Business Professionals. Wiley. • McCandless, David (2012). Information is Beautiful. HarperCollins. Online: • Microsoft Excel Charts – Official Guide • Hospitality Net: Data & Analytics in Hotels • Tableau Hospitality Analytics • Google Data Studio Tutorials