29 - Electrical activity during cardiac performance. Origin, registration, and evaluation of the ECG.
1/6
There's no tags or description
Looks like no tags are added yet.
Name | Mastery | Learn | Test | Matching | Spaced | Call with Kai | Chat |
|---|
No analytics yet
Send a link to your students to track their progress
7 Terms
sectiosn
electrocardiography
leads of electrocardiography
electrodes of ECG (electrocardiography)
PQRS complex
depolarisation
electrocardiography
Method for recording the summated bioelectrical activity of a beating heart
leads of electrocardiography
1. Limb Leads (Frontal Plane) – 6 leads:
These look at the heart from front to back.
Bipolar limb leads:
Lead I: Right arm (–) to Left arm (+)
Lead II: Right arm (–) to Left leg (+)
Lead III: Left arm (–) to Left leg (+)
Augmented unipolar limb leads:
aVR: Right arm
aVL: Left arm
aVF: Left leg (foot)
2. Chest (Precordial) Leads – 6 leads (Unipolar):
These look at the heart from a horizontal view (across the chest).
V1: 4th intercostal space, right of sternum
V2: 4th intercostal space, left of sternum
V3: Between V2 and V4
V4: 5th intercostal space, midclavicular line
V5: Same level as V4, anterior axillary line
V6: Same level as V4, midaxillary line
……………………………………………………………………
ECG since it includes 12 leads – is obtained using 10 electrodes.
electrodes of ECG (electrocardiography)
ECG since it includes 12 leads – is obtained using 10 electrodes.
Electrodes:
yellow - left arm
red - right arm
green - left leg
black - right leg (ground electrode).
how to calculate cardiac axis
ECG and the hexaxial reference system, picture attached
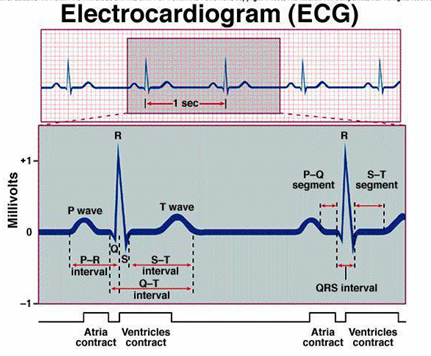
PQRST complex
The P wave is caused by the atrial depolarization prior to contraction.
The QRS complex is caused by currents generated when the ventricles depolarize prior to contraction.
Therefore, both P wave and the components of the QRS complex are depolarization waves.
The T wave is caused by currents generated as the ventricles recover from the state of depolarization.
P-Q interval (normally approximately 0.16 s).
Q-T interval and ordinarily is approximately 0.35 s.
depolarisation
Depolarisation of the cells of the SAN → right atrium → AVN → Bundle of His → Purkinje fibres