Accounting Info Systems 3
 Call Kai
 Learn
Learn Practice Test
 Spaced Repetition
 Match
Match Flashcards
 Knowt Play
1/51

There's no tags or description
Looks like no tags are added yet.
Name | Mastery | Learn | Test | Matching | Spaced | Call with Kai | Chat |
|---|
No analytics yet
Send a link to your students to track their progress
52 Terms
Narratives, flowcharts, diagrams, and other written materials that explain how a system works.
a. System documentation
b. Business process diagram
c. Data flow diagram
d. Narrative description
A
Describes the who, what, why, when, and where of data input, processing, storage, and information output
a. Business process diagram
b. System documentation
c. Data flow diagram
d. Narrative description
B
Documentation tools are important on the following three levels:
For _____ documentation (3)
For reading documentation
For evaluating documentation
For preparing documentation
Which of the following are reasons why system documentation is needed?
a. Accountants must be able to read the documentation to understand how a system works
b. Auditors need to use documentation to help assess risk
c. The Sarbanes-Oxley Act requires documentation to support internal control assessment
d. All of the above
D
Documentation is often supplemented by
a. A business process diagram
b. A data flow diagram
c. A narrative description of the system
d. A visual description of the system
C
What is a narrative description?
a. A visual representation of the activities in a business process
b. A pictorial, analytical tool used to describe elements of an information system
c. A file recording a description of an event, timestamp, and unique identifier
d. A written step-by-step explanation of system components and interactions
D
Which of the following is NOT a requirement set by the sarbanes-oxley act relating to Accounting Information Systems?
a. auditors are required to evaluate internal control measures set in place by management
b. management must assess internal controls
c. management must establish internal controls
d. management must certify that no internal control deficiencies exist
D
What are the 3 types of flowcharts?
System, document, and program
Visual representations of the activities in a business process.
a. Business process diagram
b. Flowchart
c. Data flow diagrams
d. Context diagram
A
A pictorial, analytical tool used to clearly and logically describe elements of an information system
a. Business process diagram
b. Flowchart
c. Data flow diagrams
d. Context diagram
B
What are the 4 categories of flowchart symbols?
Input/output, processing, storage, flow/miscellaneous
Match the following flowchart symbol types with their respective definitions.
Depict input or output from a system
Illustrated where data is stored
Represent manual or electronic data processing
Indicate decision points and mark the beginning and end of flowcharts
Processing symbols, Storage symbols, Flow/miscellaneous symbols, Input/output symbols
Input/output symbols
Storage symbols
Processing symbols
Flow/misc symbols
Which of the following are strengths of flowcharts? (Select all that apply)
a. Flowcharts can easily capture control through the use of decision points
b. Flowcharts eliminate the need for a narrative description of the system
c. Flowcharts automatically detect internal control weaknesses
d. Flowcharts visualize manual processes and automated processes
A & D are correct
Which of the following best describes a document flowchart?
a. A visual representation of the flow of documents within an organization.
b. A graphical representation of hte relationships among various components of a system (input, processing, storage, output)
c. Used to describe, analyze, and evaluate internal controls to identify any weaknesses
d. Illustrates a sequence of the logical operations executed by a computer when carrying out a program
A
Which of the following best describes a system flowchart?
a. A visual representation of the flow of documents within an organization.
b. A graphical representation of the relationships among various components of a system
c. Used to describe, analyze, and evaluate internal controls to identify any weaknesses
d. Illustrates a sequence of the logical operations executed by a computer when carrying out a program
B
Which of the following best describes an internal control flowchart?
a. A visual representation of the flow of documents within ana organization.
b. A graphical representation of hte relationships among various components of a system (input, processing, storage, output)
c. Used to describe, analyze, and evaluate internal controls to identify any weaknesses
d. Illustrates a sequence of the logical operations executed by a computer when carrying out a program
C
Which of the following best describes a Program flowchart?
a. A visual representation of the flow of documents within ana organization.
b. A graphical representation of hte relationships among various components of a system (input, processing, storage, output)
c. Used to describe, analyze, and evaluate internal controls to identify any weaknesses
d. Illustrates a sequence of the logical operations executed by a computer when carrying out a program
D

This image best describes a
a. Document flowchart
b. System flowchart
c. Data flow diagram
d. Program flowchart
e. Context diagram
f. Business process diagram
D; program flowchart

This image best describes a
a. Document flowchart
b. System flowchart
c. Data flow diagram
d. Program flowchart
e. Context diagram
f. Business process diagram
F; business process diagram
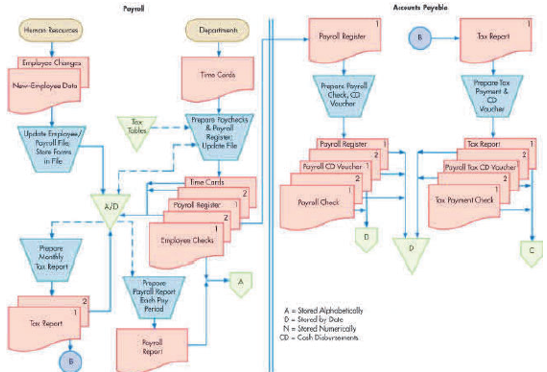
This image best describes a
a. Document flowchart
b. System flowchart
c. Data flow diagram
d. Program flowchart
e. Context diagram
f. Business process diagram
A; document flowchart

This image best describes a
a. Document flowchart
b. System flowchart
c. Data flow diagram
d. Program flowchart
e. Context diagram
f. Business process diagram
B; system flowchart

This image best describes a
a. Document flowchart
b. System flowchart
c. Data flow diagram
d. Program flowchart
e. Context diagram
f. Business process diagram
C; data flow diagram

This image best describes a
a. Document flowchart
b. System flowchart
c. Data flow diagram
d. Program flowchart
e. Context diagram
f. Business process diagram
E; context diagram
Which of the following is NOT true regarding document flowcharts?
a. They are visual representations of the flow of documents within an organization.
b. They help illustrate areas of responsibility and purpose.
c. They illustrate the sequence of logical operations executed by a computer
d. Document flowcharts show the events that occur in the system.
C; Showing the logic a computer makes is a program flowchart
This flowchart edits and records sales data, prints receipts, transmits sales data, and are typically accessible via an inquiry.
a. Document flowchart
b. Program flowchart
c. Business process diagram
d. System flowchart
D
Which of the following weaknesses could be identified by an internal control flowchart?
a. Poor communication
b. Poor segregation of duties
c. Unnecessary complexity
d. Unnecessary delays
All of the above are potential weaknesses that could be identified by an internal control flowchart.
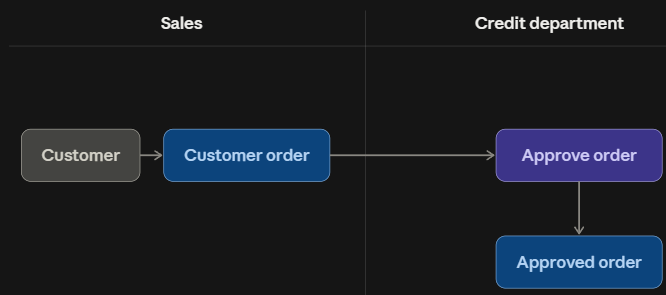
Does this flowchart break a rule? If so, what rule is broken and how would you fix it?
Yes. Documents should be shown leaving and entering each area of responsibility.


What kind of flowchart is this?
a. System flowchart
b. Document flowchart
c. Program flowchart
d. Data flowchart
B; Document flowcharts show the flow of physical documents within an organization, illustrating areas of responsibility as a document moves through the system — this is where the manual file (trapezoid) and alphabetical storage (triangle labeled "A") symbols come from.

Is there anything wrong with this flowchart? If so, how would you fix it and why?
In this case you don’t need to include the manual file icon. If you do, it’ll say, “A document with customer orders goes to a file which goes to a file ordered alphabetically”. That doesn’t make sense.
Describes the basic transformation of data into something useful.
a. Data flow
b. Process
c. Data store
d. Data source/destination
B
Which of the following is true regarding Data Flow Diagrams?
a. They must always be prepared using specialized flowcharting software
b. They show the sequence of logical operations executed by a computer
c. They are visually simple and can be used at a summary or detailed level.
d. They can only represent a process at a single, fixed level of detail
C
What is the highest level of Data Flow Diagrams?
a. Data flow diagrams
b. Business process diagrams
c. Detailed diagrams
d. Context diagrams
D; a level 0 diagram is another name for a context diagram.
This diagram shows the system and entities responsible for providing inputs and receiving outputs.
a. Context diagram
b. System flowchart
c. Business process diagram
d. Program flowchart
A
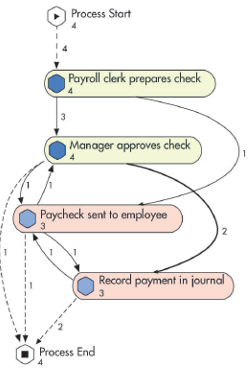
This is an example of a(n):
a. Data flow diagram
b. Process mining diagram
c. System flowchart
d. Program flowchart
B
An event log is best described as:
a. A summary report generated after a business process is completed
b. A backup file used to restore business process data after a system failure
c. A file recording a description of the event, a timestamp, and a unique identifier linking related events
d. A visual diagram showing the flow of documents within an organization
C
Process mining is best described as:
a. A method of predicting future business processes using artificial intelligence
b. A method of discovering, monitoring, and improving actual business processes by visualizing event log data
c. A method of designing new business processes before they are implemented
d. A method of auditing financial statements for regulatory compliance
B
What is each unique path of activities within a process called?
a. A process variant
b. A control account
c. A data flow
d. A transformation process
A
What is the most efficient and effective path through a process called?
a. The control path
b. The happy path
c. The critical path
d. The audit path
B
What distinguishes process mining from other documentation techniques, like flowcharts or DFDs?
a. It uses historical data to show what actually occurred, rather than what is supposed to happen
b. It uses historical data to show what is supposed to happen, rather than what actually occurred
c. It uses numerical data to show what actually occurred, rather than what is supposed to happen
d. It can only be used after a business process has been discontinued
A
Visualizations in process mining can be used to show the timing of steps in a process, which helps identify:
a. Data sources and destinations
b. Bottlenecks
c. Control accounts
d. Areas of responsibility
B
Which of the following is a listed challenge of process mining? (select all that apply)
a. Real-world processes may be overwhelming
b. The initial setup may be complicated
c. It can be expensive to set up process mining
d. It only works for financial transactions
A and B are challenges
Which of the following is NOT a benefit of process mining?
a. It can be expanded to include additional data
b. It is a good tool for monitoring and improving processes
c. It can help show and remove bottlenecks
d. It is generally simple and not complex to set up
D
Sort the following activities into their most efficient and effective order (happy path!):
The checks are sent to the employees
A payroll clerk prepares a paycheck for employees
Payroll expense is recorded in a journal entry
The manager approves each check
a. Manager approves check → Clerk prepares paycheck → Checks sent to employees → Payroll expense recorded
b. Clerk prepares paycheck → Manager approves check → Checks sent to employees → Payroll expense recorded
c. Clerk prepares paycheck → Checks sent to employees → Manager approves check → Payroll expense recorded
d. Payroll expense recorded → Clerk prepares paycheck → Manager approves check → Checks sent to employees
B; Clerk prepares paycheck → Manager approves check → Checks sent to employees → Payroll expense recorded
Another name for a context diagram is a _____
Level 0 diagram. It’s called this because DFDs are often brown down (subdivided) into more detail. Context diagrams are the “highest level” and thus called Level 0. If it were Level 1, it would break down each process.
A business Process Diagram (BPD) is a visual way of
a. Describing the systems program
b. Describing the activities in a process
c. Describing the internal controls of a process
d. Describing the documents in a process
B
Which of the following statements is FALSE?
a. A flowchart is an analytical technique used to describe some aspect of an information system in a clear, concise, and logical manner.
b. Flowcharts use a standard set of symbols to describe pictorially the flow of documents and data through a system
c. Flowcharts are easy to prepare and revise when the designer utilizes a flowcharting software package
d. A system flowchart is a narrative representation to identify system weaknesses
e. A program flowchart uses the logic used in computer programs
D is incorrect. They are pictorial (visual) representations NOT narrative representations.
A data flow diagram (DFD) is a representation of which of the following?
a. Relationship among modules, data, and programs of an AIS
b. Flow of data in an organization
c. Decision rules in a computer program
d. Computer hardware configuration
B
Flowchart symbol practice
What is this symbol?
A beginning, end, or point of interruption in a process; also used to indicate an external party
Terminal

Flowchart symbol practice
What does the N, A, and D mean in a paper document file?
File ordering sequence.
N = numerical, A = alphabetical, D = by Date
Which statement regarding business process diagrams (BPDs) is true?
a. BPDs only describe interactions within an entity; it is never used to describe interactions between entities.
b. There are only a small number of different symbols that can be used in drawing a BPD.
c. The Business Process Modeling Initiative Notation Working Group established standards for drawing BPDs.
d. A BPD for the revenue cycle will only describe the functions performed by the purchasing company.
C
The type of flowchart that illustrates the flow of documents and data among areas of responsibility within an organization is called
a. System flowchart
b. Document flowchart
c. Program flowchart
d. Business process flowchart
B
Which of the following is not a business process diagram (BPD) preparation guideline?
a. Identify business processes, documents, data flows, and data processing procedures
b. Place the name, date, and preparer's name on each page of the completed BPD
c. Show documents as they flow through the system, and show where each is stored
d. Get an understanding of the system using tools, such as observing business processes and data flows, or by walking through the system transactions
C