biostats possible questions
1/31
There's no tags or description
Looks like no tags are added yet.
Name | Mastery | Learn | Test | Matching | Spaced | Call with Kai |
|---|
No analytics yet
Send a link to your students to track their progress
32 Terms
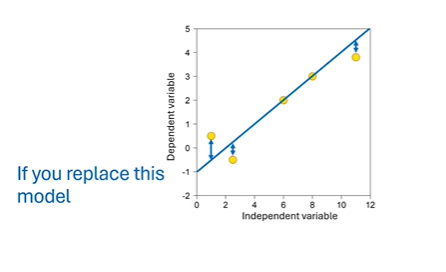
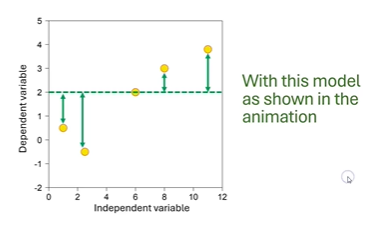
Which statements are true?
The first model is a better model (less error)
The residuals sums of squares increases from the first to the second model
The second model is a better model (less error)
The residuals sums of squares decreases from the first to the second model
The first model is a better model (less error)
The residuals sums of squares increases from the first to the second model
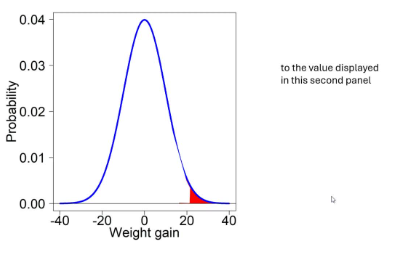
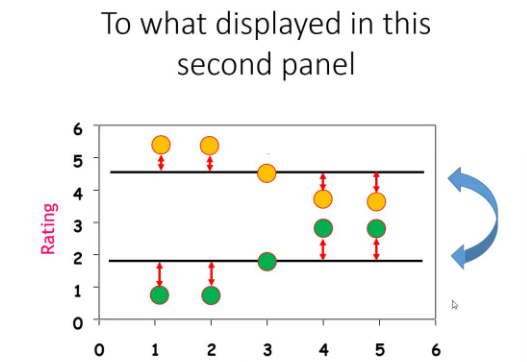
Which statements are true?
If the weight gain of your patient is 20 pound you reject the null hypothesis only in your first but not second panel
You are more likely to commit a type I error in your second panel
If the weight gain of your patient is 20 pound you reject the null hypothesis in both your panels
You are more likely to commit a type I error in your first panel
If the weight gain of your patient is 20 pound you reject the null hypothesis only in your first but not second panel
You are more likely to commit a type I error in your first panel
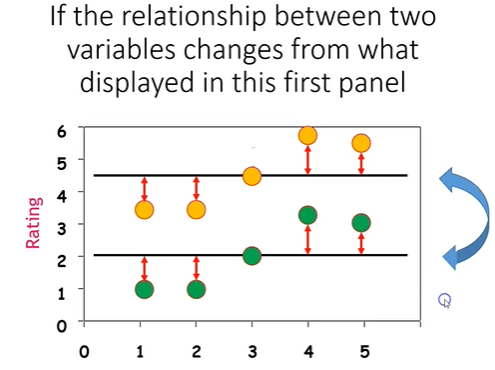
Which statement is true?
The relationship changes from a positive to a negative association
The relationship changes from a negative to a positive association
The sample size decreases
The sample size increases
The relationship changes from a positive to a negative association
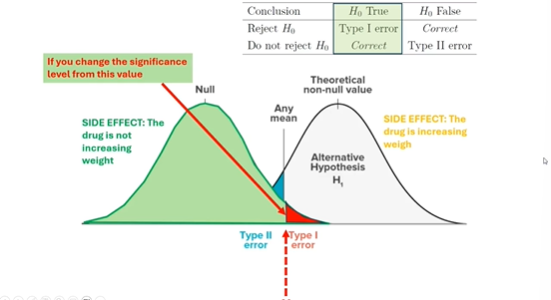
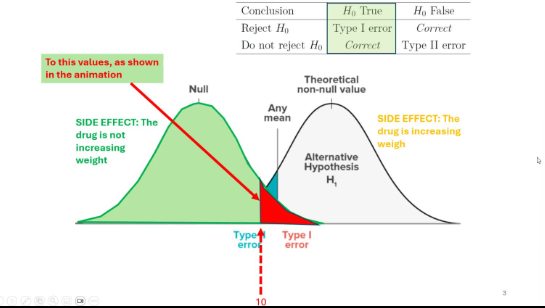
Which Statements are true?
if the the weight gain of the patient is 25 pounds you reject the null hypothesis in both cases
if the the weight gain of the patient is 30 pounds you will reject the null hypothesis in both cases
The null hypothesis is the the drug is not affecting the weight
if the the weight gain of the patient is 9 pounds you will reject the null hypothesis in both cases
if the the weight gain of the patient is 25 pounds you reject the null hypothesis in both cases
if the the weight gain of the patient is 30 pounds you will reject the null hypothesis in both cases
The null hypothesis is the the drug is not affecting the weight

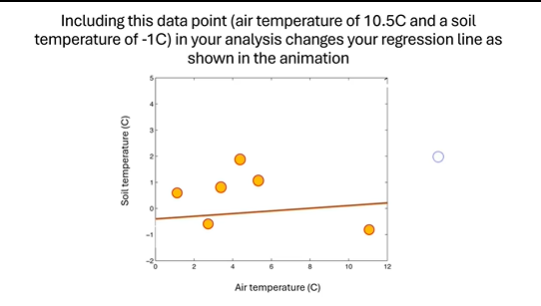
IF you include this datapoint (10.5 and a soil temperature of -1C what statements are true?Including this datapoint (air temp 10.5C and soil temp) will results in a weaker association between the two variables
This datapoint (air temp 10.5C and soil temp) affects the slope of the regression between soil and air temperature
This datapoint (air temp 10.5C and soil temp) is an influential point
Including this datapoint (air temp 10.5C and soil temp) will results in a negative association between the two variables
Including this datapoint (air temp 10.5C and soil temp) will results in a weaker association between the two variables
This datapoint (air temp 10.5C and soil temp) affects the slope of the regression between soil and air temperature
This datapoint (air temp 10.5C and soil temp) is an influential point
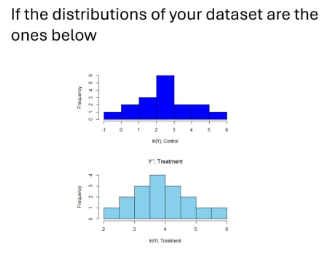
Which statements are true?
The two groups have the same kurtosis
The two distributions are approximately normal
The two groups have different kurtosis
if the original dataset had skewed distributions, the data, that were log-transformed to obtain the distributions shown
The two distributions are approximately normal
The two groups have different kurtosis
if the original dataset had skewed distributions, the data, that were log-transformed to obtain the distributions shown
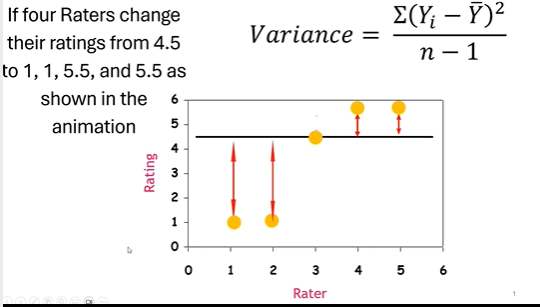
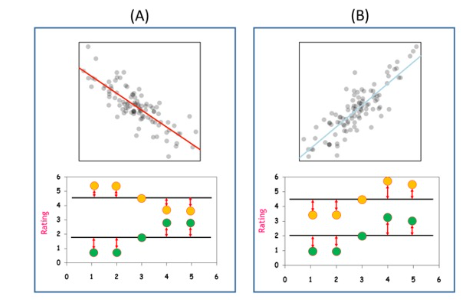
Which statements are true?
The variance of the Ratings increases
The variance of the Ratings decreases
The mean becomes a better model to describe the data
The sample size increases
The variance of the Ratings increases
What is the 95% CI of a sample (95% CI corresponds to a z-score of 1.96), a mean = 1, and a SE = 1? Only one is correct.
0.96 and 2.96
-1 and 1
-1.96 and 1.96
-0.96 and 2.96
-0.96 and 2.96
Which of the following is/are non-directional experiments? More than one can be correct.
Testing if the atmospheric pollution is different between Mexico City and Rome
Testing if the atmospheric CO2 concentration in 2020 is lower than the long term mean
Testing if the drought affects the yield of two varieties of potatoes differently
Testing if the drug A is more effective than drug B in reducing blood pressure
Testing if the atmospheric pollution is different between Mexico City and Rome
Testing if the drought affects the yield of two varieties of potatoes differently
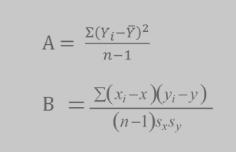
Given the formulas below which is/are true?
A is the always positive
If two variables are positively correlated B is negative
If two variables are negatively correlated B is negative
B is the formula for the correlation coefficient
A is the always positive
If two variables are negatively correlated B is negative
B is the formula for the correlation coefficient
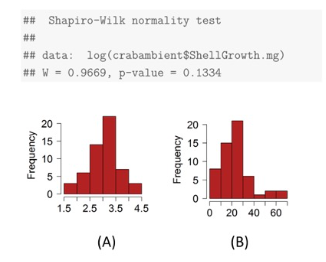
Give the result of the Shapiro-Wilk test below and the two distributions shown in graph A and B, which is/are true? The significance level of this test is =0.05. More than one can be true.
The null hypothesis is that the data are normally distributed
Given the result of the Shapiro-Wilk test it is likely that (B) is the distribution of the data
Given the result of the Shapiro-Wilk test you do not need to transform the data
Given the result of the test you should reject the null hypothesis
The null hypothesis is that the data are normally distributed
Given the result of the Shapiro-Wilk test you do not need to transform the data
Given the graph below, which is/are true? More than one can be correct.
A positive correlation is always associated with a positive covariance
A negative correlation is always associated with a negative covariance
(A) shows a negative correlation and a negative covariance
(B) shows a positive correlation and a positive covariance
A positive correlation is always associated with a positive covariance
A negative correlation is always associated with a negative covariance
(A) shows a negative correlation and a negative covariance
(B) shows a positive correlation and a positive covariance
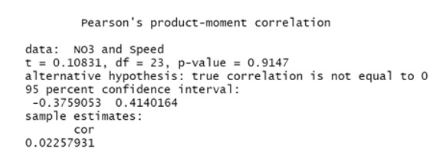
Given the output of the correlation between water flow (Speed) and NO3 concentration below, which is/are true (more than one can be true)?
The water flow (Speed) is significantly correlated with water NO3 concentration
The null hypothesis is that there is no correlation between water flow (Speed) and water NO3 concentration
There is a no significant correlation between water flow (Speed) and water NO3 concentration
The water flow (Speed) explains about 0.05% of the variability in the water NO3 concentration
The null hypothesis is that there is no correlation between water flow (Speed) and water NO3 concentration
There is a no significant correlation between water flow (Speed) and water NO3 concentration
The water flow (Speed) explains about 0.05% of the variability in the water NO3 concentration
A study is trying to assess the probability of graduating by a certain age. A z-score of 2.7 corresponds to completing an undergraduate degree in chemistry at 30 year old. Given the z-score table below, which is/are correct? More than one can be correct.
There is a 0.347% probability of completing an undergraduate degree in chemistry at 30 year old or older (students completing an undergraduate degree in chemistry when 30 year old or older)
There is a 0.347% probability of completing an undergraduate degree in chemistry by 30 year old (students completing an undergraduate degree in chemistry when 30 year old or younger)
There is a 99.653% probability of completing an undergraduate degree in chemistry by 30 year old (students completing an undergraduate degree in chemistry when 30 year old or younger)
There is a 0.99653% probability of completing an undergraduate degree in chemistry by 30 year old (students completing an undergraduate degree in chemistry when 30 year old or younger)
There is a 0.347% probability of completing an undergraduate degree in chemistry at 30 year old or older (students completing an undergraduate degree in chemistry when 30 year old or older)
There is a 99.653% probability of completing an undergraduate degree in chemistry by 30 year old (students completing an undergraduate degree in chemistry when 30 year old or younger)
Which of the following is/are directional experiment/s? More than one can be correct.
Testing if the sales of tennis shoes is different in summer and winter
Testing if the annual mean air temperature is higher in El Centro than in La Jolla
Testing if the drug A is more effective than drug B in reducing blood pressure
Testing if the unemployment rate in 2020 was higher than the long-term mean
Testing if the annual mean air temperature is higher in El Centro than in La Jolla
Testing if the drug A is more effective than drug B in reducing blood pressure
Testing if the unemployment rate in 2020 was higher than the long-term mean
If a patient has a viral infection but tests negative, which is true? Only one.
The result of the test is correct
The positive result is a type I error
The false positive is a type II error
The false negative is a type II error
The false negative is a type II error
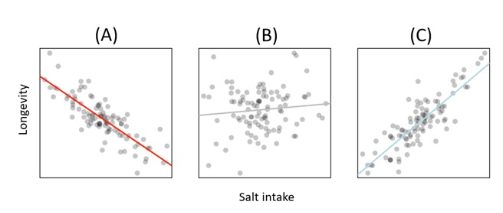
Given the graphs (A,B,C) below, which is/are true? More than one can be correct.
Salt intake is positively correlated with longevity in graph A
Salt intake is strongly correlated with longevity in graph B
Longevity is the independent variable
Longevity is the dependent variable
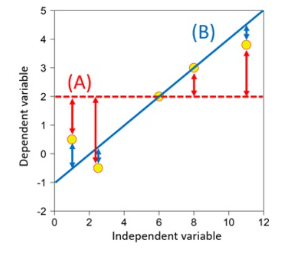
Given the graph below which is/are true? More than one can be correct.
The residual (error) variability is lower in model A than in model B
The error of model B is larger
There is likely no correlation between the dependent and independent variable
The model A corresponds to the mean
The model A corresponds to the mean
We want to measure the effect of drinking water on blood sugar. The main science question is: Is drinking water associated with a decrease in blood sugar? Which is/are true? More than one can be true.
This can be tested only with an observational experiment because of ethical reasons
This can be tested using either a manipulative or observational experiment
Either an observational or manipulative experiment are possible but a manipulative experiment will help establish cause effect relationships
This can be tested only with a manipulative experiment because of ethical reasons
This can be tested using either a manipulative or observational experiment
Either an observational or manipulative experiment are possible but a manipulative experiment will help establish cause effect relationships
An experiment is testing if a certain drug is effective in reducing weight, which is/are correct? More than one can be correct.
The null hypothesis is that the drug is not effective in reducing weight
The alternative is that the drug is effective in reducing weight
The null hypothesis is that the drug is effective in reducing weight
The alternative hypothesis is that the drug is not effective in reducing weight
The null hypothesis is that the drug is not effective in reducing weight
The alternative is that the drug is effective in reducing weight
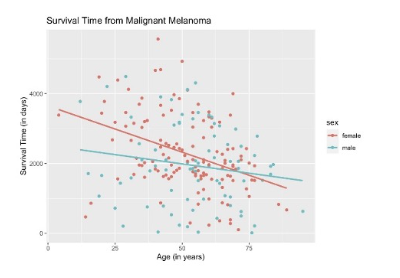
Given the graph below which is/are true? More than one can be correct.
There are two categories
The graph shows the relationship between the survival time from malignant melanoma and age in males and females
The survival time increases with age in both females and males
The survival time increases with age only in males
There are two categories
The graph shows the relationship between the survival time from malignant melanoma and age in males and females
Given the graph below, which is/are true? More than one can be correct.
(1) is a skewed distribution
(A) is the mean of group 1
(A) is the median of group 1
The distributions of group 1 is normal
(1) is a skewed distribution
(A) is the median of group 1
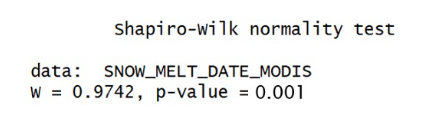
Given the output of the Shapiro-Wilk test below which is testing if a sample of snow melt dates across 11 sites in Alaska is normally distributed, and given a significance level of 0.05, which is/are correct (more than one can be correct)?
There is compelling evidence to reject the null hypothesis
The data are likely normally distributed
The data are not normally distributed
You do not need to transform the data before doing any parametric statistics
There is compelling evidence to reject the null hypothesis
The data are not normally distributed
What of the following should not occur when performing a random sampling? More than one can be correct.
Each individual should be sampled as many times as possible
Inclusion of one individual in the sample should not be influenced by the selection of other members
Each individual is sampled only once
Every individual in the population should have an equal chance of being included in the sample
Each individual should be sampled as many times as possible
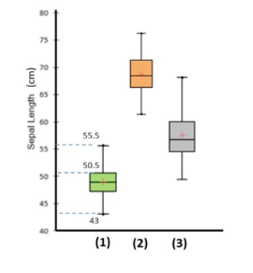
Given the graph below, which is/are true? More than one can be correct.
Group 1 and 3 are likely from different populations
Group 1, 2, and 3 have the same median sepal length
In group 3 the mean= median
25% of sepal lengths of group 1 are between 50.5 cm and 55.5 cm
25% of sepal lengths of group 1 are between 50.5 cm and 55.5 cm
A biologist is interested in understanding the influence of rainfall on plant growth. She hypothesizes that increase in rainfall will increase plant growth. If the correlation coefficient between rainfall and plant growth is 0.7, what percent of the variation in plant growth is explained (accounted for) by temperature (only one)?
Group of answer choices
49%
70%
4.9%
0.7
49%
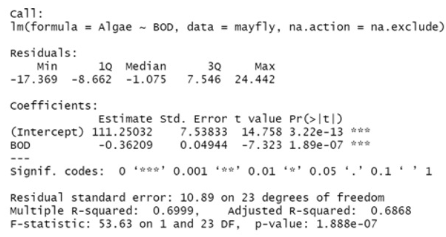
Given the output of the regression between algae percent cover and BOD (biological oxygen demand) which is/are true? More than one can be correct
The regression line of the model is: y=111.25 - 0.36x
BOD is significantly and negatively associated with Algae percent cover
The regression line of the model is: y=111.25 + 0.36x
The regression line of the model is: y= -0.36 + 111.25x
The regression line of the model is: y=111.25 - 0.36x
BOD is significantly and negatively associated with Algae percent cover
You have to design a poll to evaluate what people in San Diego think of a tighter gun control legislation. The main science question is: Should the US government perform a background check on people purchasing guns? Given that different areas in San Diego might be associated with very different attitudes about gun control, what should you do when you design this poll?
You should rely on voluntary response sampling
You should perform a random sampling and interview people only in the neighborhood further from you to reduce the bias
You should consider possible bias and confounding variables when creating your sampling protocol
You should perform a stratified sampling and interview people in each of the main San Diego neighborhoods
You should consider possible bias and confounding variables when creating your sampling protocol
You should perform a stratified sampling and interview people in each of the main San Diego neighborhoods
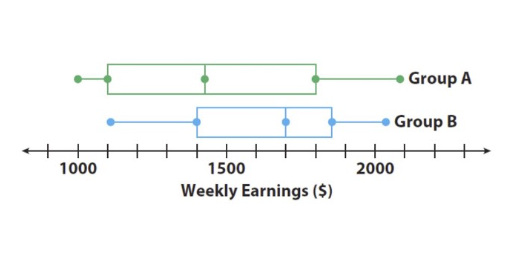
Given the graph below, which is/are correct? More than one can be correct.
The minimum weekly earning of group A is lower than the minimum weekly earning of group B.
A total of 25% of group B has weekly earnings between $1700 and about $1850
A total of 50% of group A has weekly earnings below about $1100
The median weekly earnings of group A is higher than the median weekly earnings of group B
The minimum weekly earning of group A is lower than the minimum weekly earning of group B.
A total of 25% of group B has weekly earnings between $1700 and about $1850
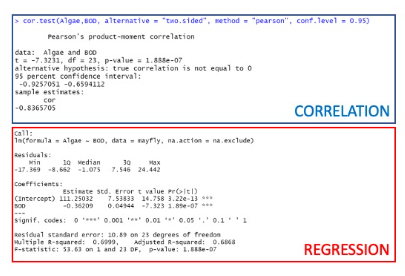
Given the two outputs of a correlation and a regression between the indicated variables which is/are true? More than one can be correct.
Based on just the regression output we would not be able to determine if BOD is positively or negative associated with Algae percent cover.
The outputs of both analyses show that BOD is significantly associated with Algae percent cover.
Both the correlation and regression output allow us to determine if BOD is positively or negative associated with Algae percent cover.
Based on the outputs of both analyses BOD is positively associated with Algae percent cover.
The null hypotheses for both tests is that BOD is not significantly associated with Algae percent cover
The outputs of both analyses show that BOD is significantly associated with Algae percent cover.
Both the correlation and regression output allow us to determine if BOD is positively or negative associated with Algae percent cover.
The null hypotheses for both tests is that BOD is not significantly associated with Algae percent cover
A study is trying the identify the impact of physical activity on weight gain. Different people included in the study can have different diets. Which is/are true? Select all the correct answers, more than one can be correct.
An observational experiment is less prone to confounding variables
A manipulative experiment will help to identify cause-and-effect relationships
If you can, you should perform a manipulative experiment to avoid the confounding effect of diet
You can only perform an observational experiment to identify cause-and-effect relationships
A manipulative experiment will help to identify cause-and-effect relationships
If you can, you should perform a manipulative experiment to avoid the confounding effect of diet
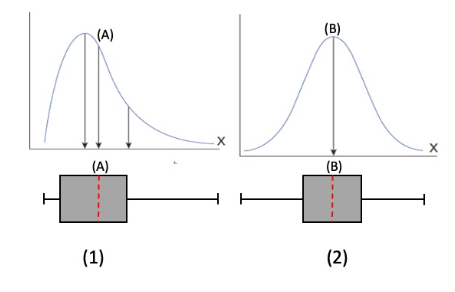
Given the two distributions below (a,b), which is/are true? More than one can be true.
Distribution (a) and (b) are not normal
(3) is the mean for both distributions
(2) is the median for both distributions
(1) is not the mode for the two distributions
Distribution (a) and (b) are not normal
(3) is the mean for both distributions
(2) is the median for both distributions