Price determinations
1/17
There's no tags or description
Looks like no tags are added yet.
Name | Mastery | Learn | Test | Matching | Spaced | Call with Kai |
|---|
No analytics yet
Send a link to your students to track their progress
18 Terms
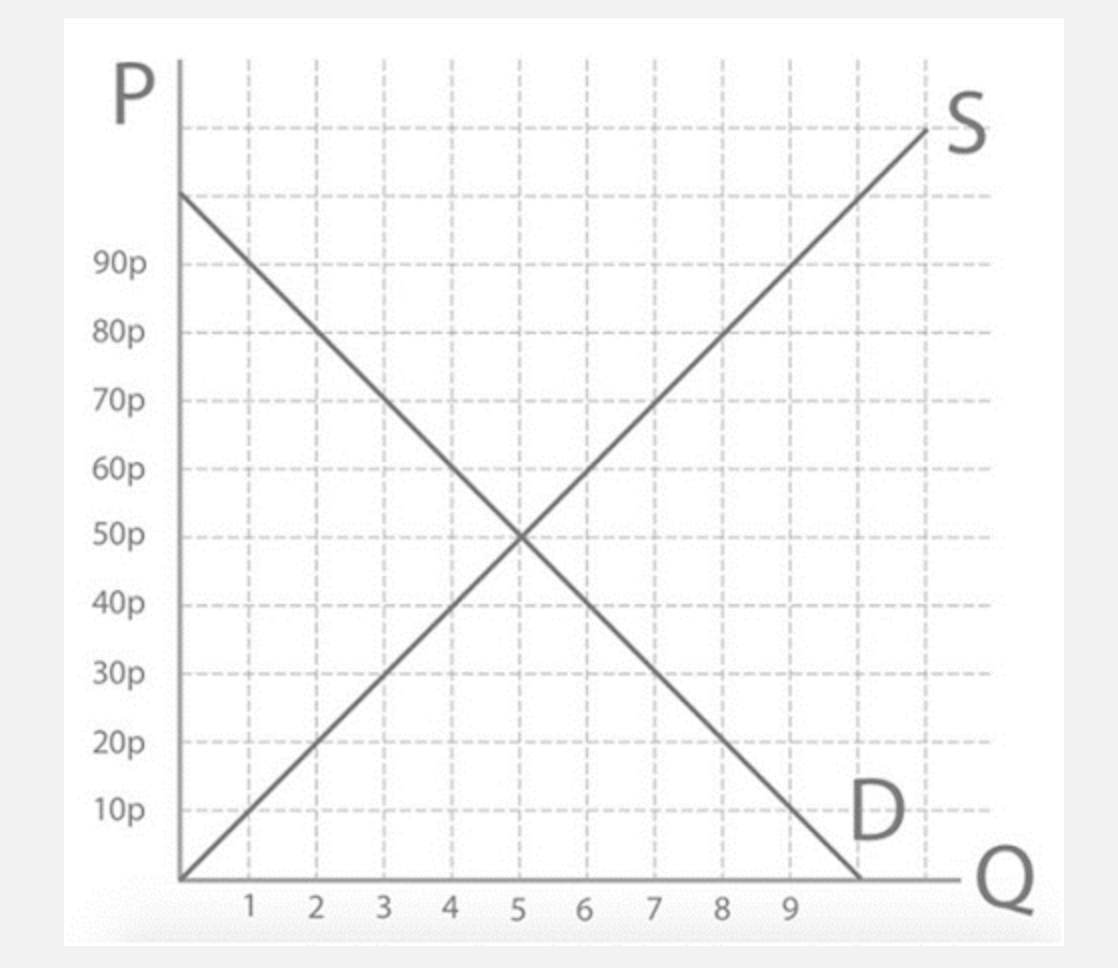
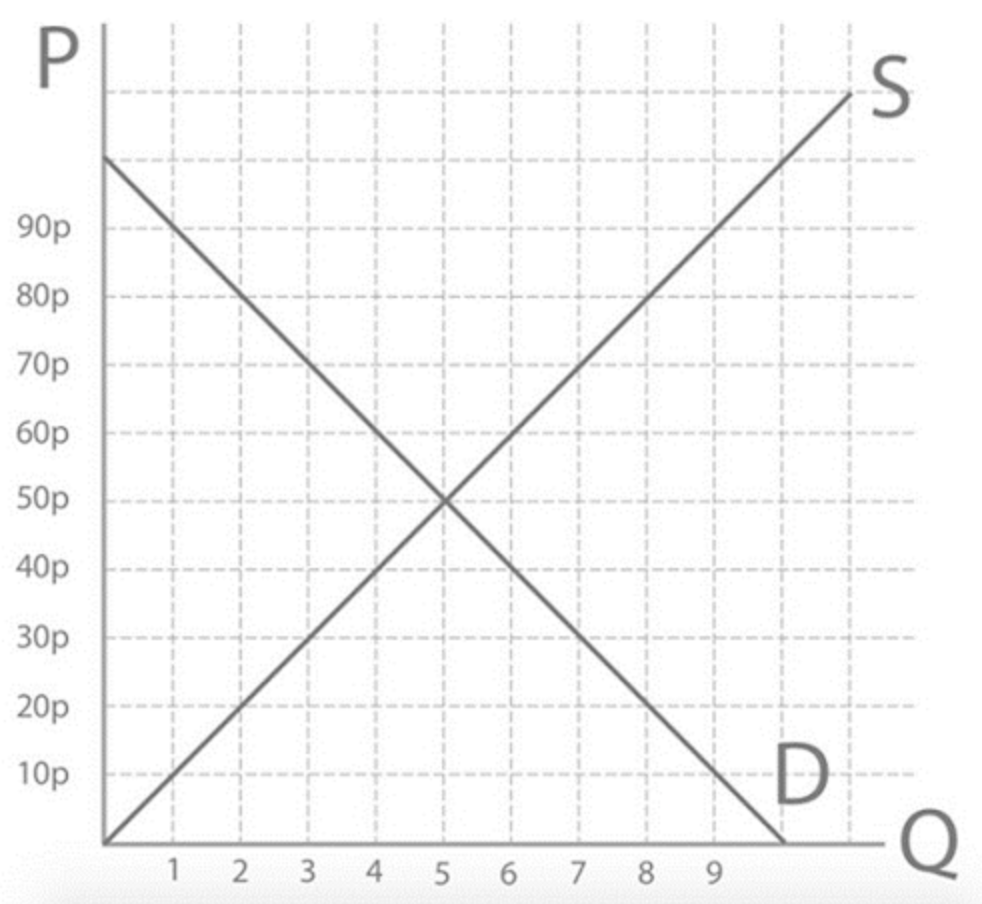
Step 1: The quantity demanded and quantity supplied at 70p will be..
Qs=7 Qd= 3
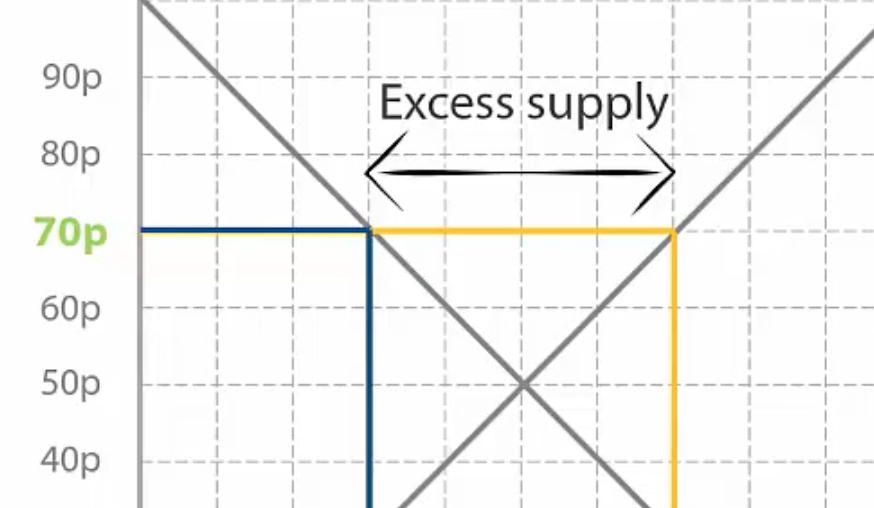
Step 2: So how many more apples are being supplied than demanded at a price of 70p?
4 more apples are being supplied (excess supply/ surplus)
Step 3: How might Lord Sugar change the price of his apples so that he doesn’t end up with another excess supply or surplus?
decrease his price to increase quantity demanded
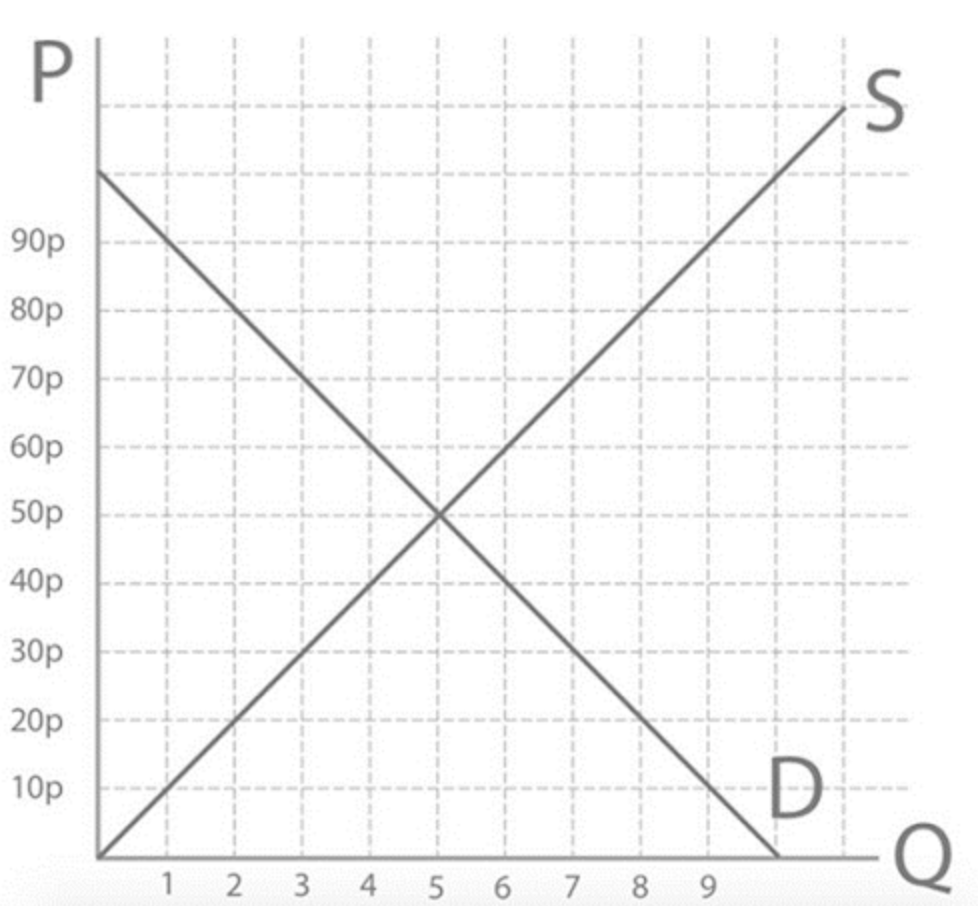
Step 4: So at the new price of 60p, what’s the quantity demanded and the quantity supplied?
Qs=6
Qd=4
(there still is an excess supply of 2 apples)
Another price decrease will have to take place to get to equilibrium price of 50 p to sender no waste
Step 1: if the price was 30p, what would the quantity supplied and demanded be?
Qs= 3
Qd=7
so 4 more apples are being demanded
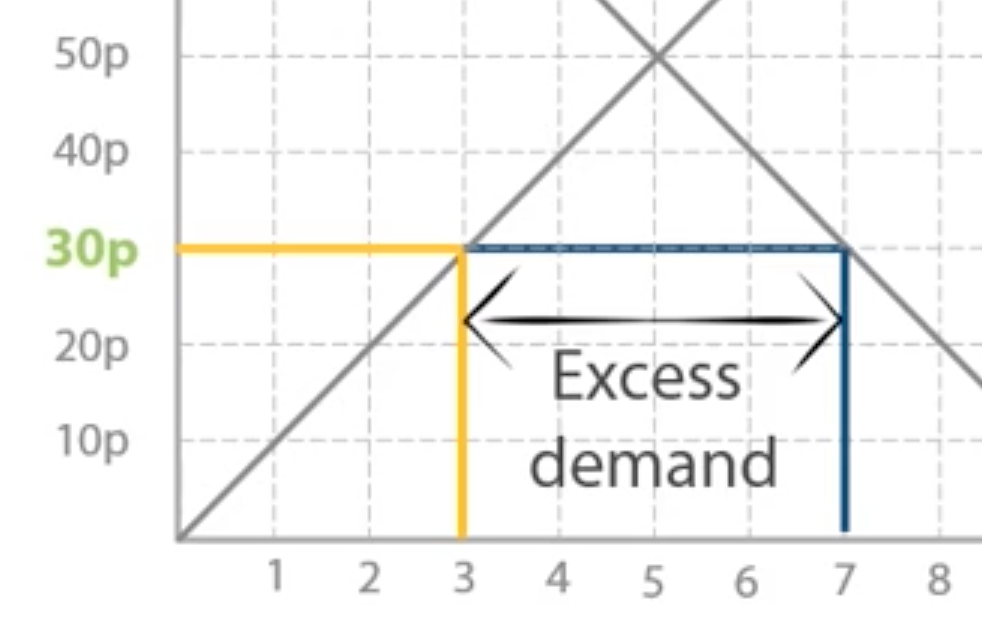
Step 2: We call these 4 extra apples being demanded...
Excess demand or shortage
Step 3: instead of paying 30p per apple, how might you change the price you offer Lord Sugar to make sure he sells to you?
increase the price you offer Lord Sugar to make sure he sells to you, instead of the other consumers to get to equilibrium
What is the price mechanism?
the interaction of supply and demand to determine prices
How else is the price mechanism referred to?
as an invisible hand- moves supply and demand until at equilibrium
What are the functions of the price mechanism?
signalling
incentivising
rationing
What is disequilibrium?
not at equilibrium
What is the function: signalling (for excess supply)?
a falling price signals to producers that consumers want fewer goods reducing quantity supplied
(leads to a contraction in supply)
What is the function: incentivising (for excess supply)?
a falling price reduces incentive to sell as less profit can be made reducing Qs
(leads to a contraction in supply)
What is the function: signalling (for excess demand)?
rising prices signals to producers that consumers want more increasing Qs
(leads to an extension in supply)
What is the function: incentivising (for excess demand)?
rising price creates incentives supply as more profit can be made increasing Qs
(leads to an extension in supply)
What is the function: rationing (for excess demand)?
rising prices means some consumers are not willing and able to demand at higher prices
(contraction in demand- rationed to consumers that CAN pay more)
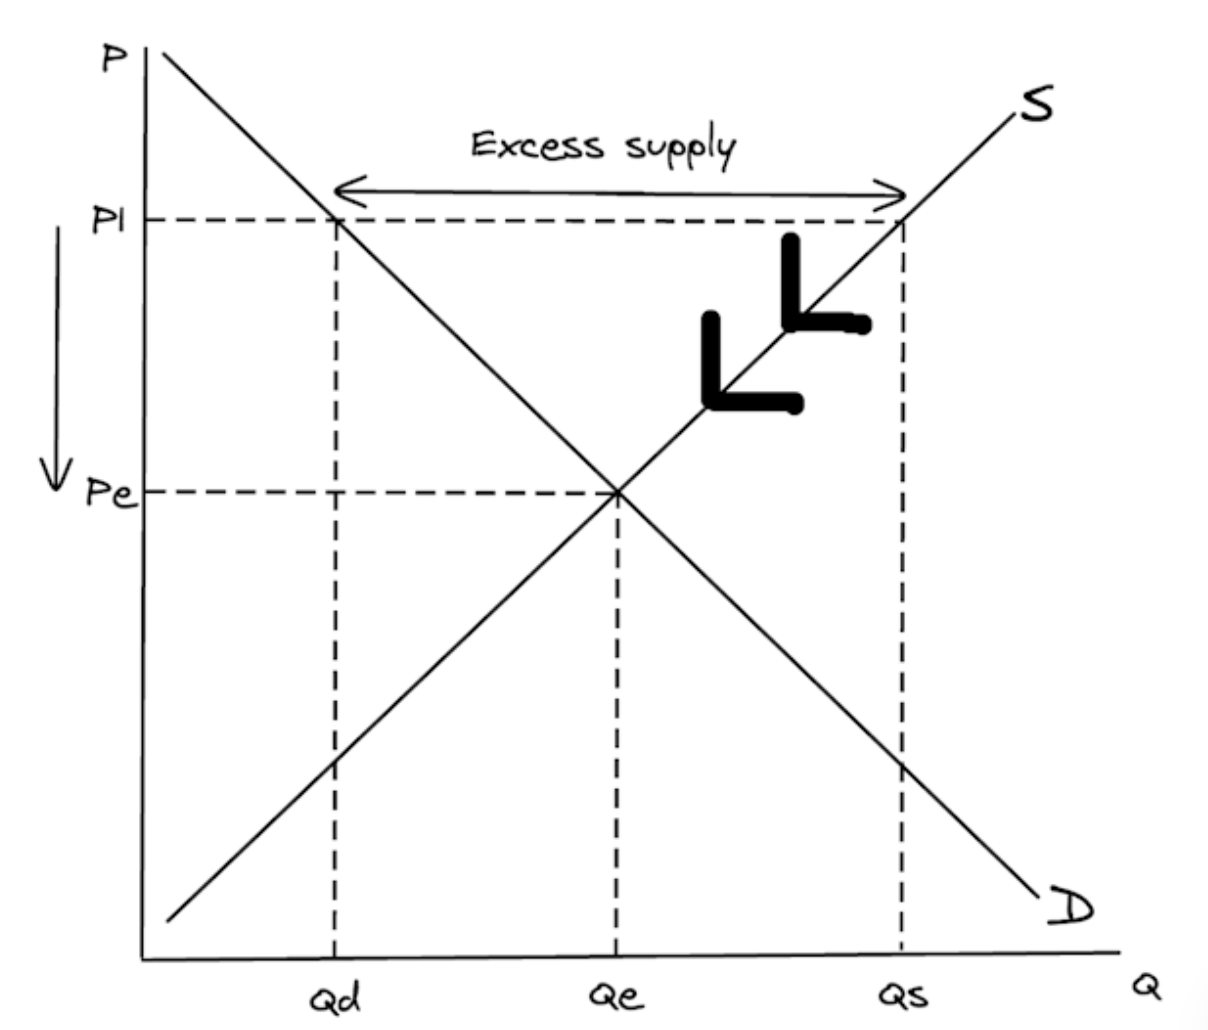
Draw a diagram to show how the functions of the price mechanism eliminate excess supply in a market.
To score full marks in your exam, make sure your diagram includes ALL of the following (you will lose marks if you miss any of these out):
- Labelled axes (P and Q)
- Labelled curves (S and D)
- Equilibrium price (Pe)
- Equilibrium quantity (Qe)
- Price above equilibrium (P1)
- Quantity demanded (Qd) and quantity supplied (Qs) at P1
- Excess supply
- Downward arrow showing price falling from P1 back to Pe
- Two arrows on supply curve to show signalling and incentivising
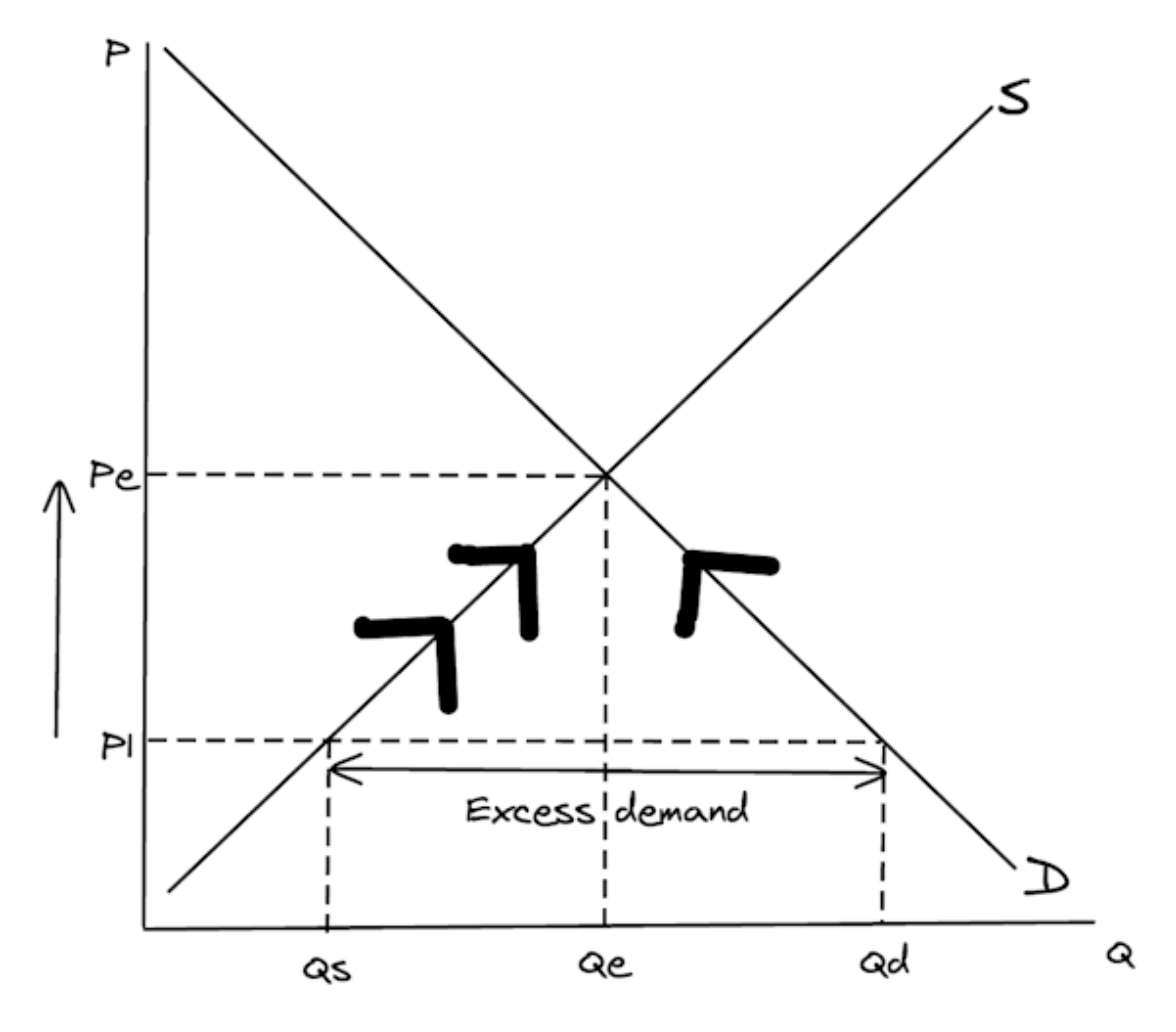
Draw a diagram to show how the functions of the price mechanism eliminate excess demand in a market.
To score full marks in your exam, make sure your diagram includes ALL of the following (you will lose marks if you miss any of these out):
- Labelled axes (P and Q)
- Labelled curves (S and D)
- Equilibrium price (Pe)
- Equilibrium quantity (Qe)
- Price below equilibrium (P1)
- Quantity demanded (Qd) and quantity supplied (Qs) at P1
- Excess demand
- Upward arrow showing price rising from P1 back to Pe
- Two arrows on supply curve to show signalling and incentivising
- One arrow on demand curve to show rationing