Feb 17, 2025 Yuan Fang, PhD
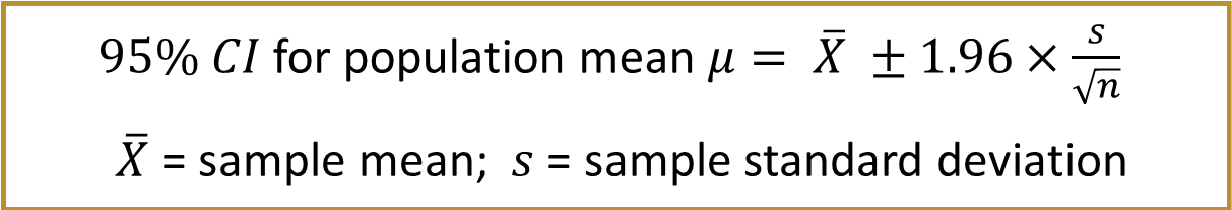
CI for the population mean μ
Cl = point estimate ± critical value (at a confidence level) x SE (point estimate)
Higher confidence levels have larger z values, which translate to larger margins of error and wider CIs
If you use 99% confidence rather than 95% confidence, you will have a wider interval
i.e. If you want more certainty in your estimates, you will need a wider
This formula works for a large sample size. For smaller sample size, we use t-distribution to obtain the critical value instead of normal distribution
The t distribution is another probability model for a continuous variable
The t distribution takes a slightly different shape depending on the exact sample size
t distributions are indexed by degrees of freedom (df) which is defined as n - 1
If df = ∞, the t distribution is the same as the normal distribution
It is important to note that appropriate use of the t distribution assumes that the variable of interest is approximately normally distributed
Specifically, the t values for the CIs are larger for smaller samples, resulting in larger margins of error
i.e., there is more imprecision with small samples
Critical Values of the t Distribution
Table entries represent values from t distribution with upper tail area equal to α
Dichotomous outcome
Outcome variable is dichotomous (p = population proportion)
Risks = Number of subjects with disease / Total number of subjects
One study sample
Data
On each participant, measure outcome (yes/no)
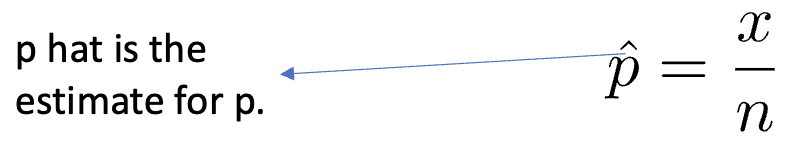
n, x = number of positive responses
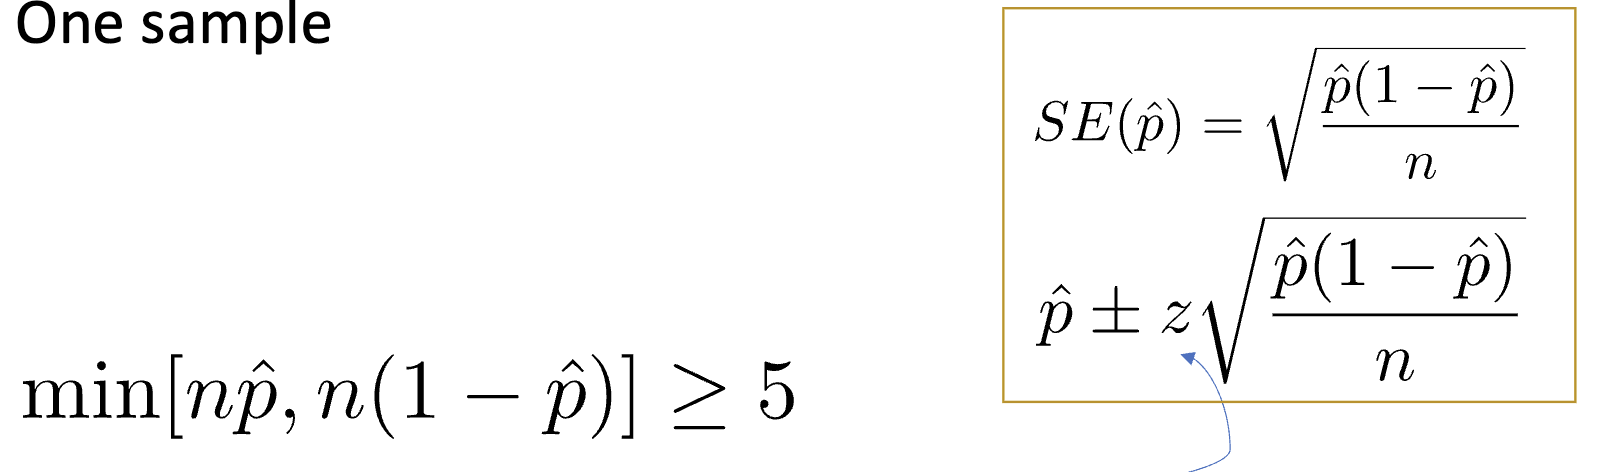
Confidence Intervals for p
Dichotomous outcome
One sample
Do NOT use the t-interval distribution here
Connecting scientific question to statistical comparison
Cohort study
Are people on a drug to reduce blood pressure experiencing any benefit?
Continuous data (blood pressure). Blood pressure should be reduced over time (end of study - measurement - baseline measurement)
μd (average of differences in measurements, or mean differences) should be lower than 0. If no effect, μd = 0
Randomized controlled trial
Are people on a new drug to reduce blood pressure doing better than people on placebo?
Continuous data (blood pressure). Blood pressure should be compared at end of study between the placebo group and treatment group.
μt - μp = 0 or μt / μp = 1 means on average, no effect
On average, no difference between the treatment group and placebo group, so difference in average measurements, or difference on means
Randomized controlled trial
Do people on a new drug to reduce blood pressure have fewer adverse outcomes than people on the standard care?
Dichotomous data (adverse event). Number of adverse events should be compared between the new drug group vs. the standard of care drug group. Use proportions.
pt - pp = 0 or pt / pp = 1 means on average, no difference. Overall, no difference between the treatment group and placebo group
Comparison between two groups
Look at the difference in means between 2 groups
Outcome is continuous
SBP, weight, cholesterol
Two independent study samples
Difference in means μ1 - μ2
Data
On each participant, identify group and measure outcome
What we should have: n1, X1,s12 (or s1), n2, X2, s22 (or s2)
Two Independent Samples
Randomized Controlled Trial: Set of Subjects Who Meet Study Eligibility Criteria
Cohort Study: Set of Subjects Who Meet Study Inclusion Criteria
Confidence Interval for (μ1 - μ2)
If 0 is included in a confidence interval for a difference, then 0 is a possible difference
Equivalent is a possibility
Statistically not different
Because 95% CIs do not include 0, we conclude that there are statistically meaningful differences between means
This is primarily due to the large sample sizes
Are these clinically relevant or meaningful differences
Statistical significance: when null value is not in the confidence interval
Statistically significantly different from 0
This means observed difference is different form null beyond that expected by chance
0 is the null value for a difference
Clinical significance: What difference is clinically meaningful? A difference you would amount for when counseling a patient or forming a recommendation
Samples are not independent; Matched or paired samples
Look at mean differences
Outcome is continuous
SBP, weight, cholesterol
Two matched or paired study samples
Data
On each participant, measure outcome under experimental condition
Interested in μd
Compute differences: x1 - x2
Used in crossover trials
Used to compare data before and after an intervention
Two Dependent/Matched Samples
Measures one subject serially in time or repreated under different experimental conditions
Differences can be negative too
Confidence Intervals μd: Confidence interval for mean difference
Continuous outcome
Two matched/paired
Because the samples are dependent, statistical techniques that account for the dependency must be used
Even though the samples are dependent, the differences themselves are independent
Therefore, the differences on their own can be viewed as an independent sample
Here, the sample size n is the number of distinct participants or distinct pairs, not the total number of observations (2n)
We can use SKIN and SUIT again
Comparison of proportions from two independent samples
Outcome is dichotomous
Result of surgery (success, failure)
Cancer remission (yes/no)
Two independent study samples (RCT, cohort study, etc.)
Compare risks from the two independent samples
Data
One each participant, identify group and measure outcome (yes/no)
n1, p̂1, n2, p̂2
Risk difference
Risk difference: difference in proportions (risks) between comparison groups
proportion from group 1 - proportion from group 2
Absolute difference (p1 - p2)
Absolute Risk Reduction (ARR): reference group (e.g., unexposed persons, persons without a risk factor, or persons assigned to the control group in a clinical trial setting) subtract the other group, i.e. risk in control group - risk in treatment group
Relative Risk
Relative risk (aka risk ratio): ratio of proportions (risks)
Generally, the reference group (e.g., unexposed persons, persons without a risk factor, or persons assigned to the control group in a clinical trial setting) is considered the denominator of the ratio
proportion from group 1 / proportion from group 2