Exchange - Oxygen dissociation curve
1/25
There's no tags or description
Looks like no tags are added yet.
Name | Mastery | Learn | Test | Matching | Spaced | Call with Kai |
|---|
No analytics yet
Send a link to your students to track their progress
26 Terms
Oxygen dissociation curve.
What does the downwards slope of the oxygen dissociation curve graph indicate?
O2 reaching the respiring tissues and being dissociated
What does the top right corner of the oxygen dissociation curve diagram represent?
High partial pressure in the lungs leading to high O2 collection
What does the bottom left of the oxygen dissociation curve graph signify?
The last O2 molecule being used up during intense exercise
How does O2 dissociate at the respiring tissues?
Because there is high partial pressure of O2 in the blood but low in the tissues. This creates a concentration gradient for the O2 to diffuse down
What is partial pressure?
The pressure exerted by a particular gas in a mixture of gases (at low partial pressure, there are fewer O2 molecules in an area compared to an area of the same size at a higher partial pressure)
When does the partial pressure of O2 change?
Depending on altitude
When partial pressure is high, how fast is haemoglobin picked up?
Rapidly forms oxyhaemoglobin
What two variables does the oxygen dissociation curve show?
Relationship between partial pressure of O2 and percentage oxygen saturation of hb
What is partial pressure of O2 like in the respiring tissues?
Low
What is partial pressure of O2 like in the lungs?
High
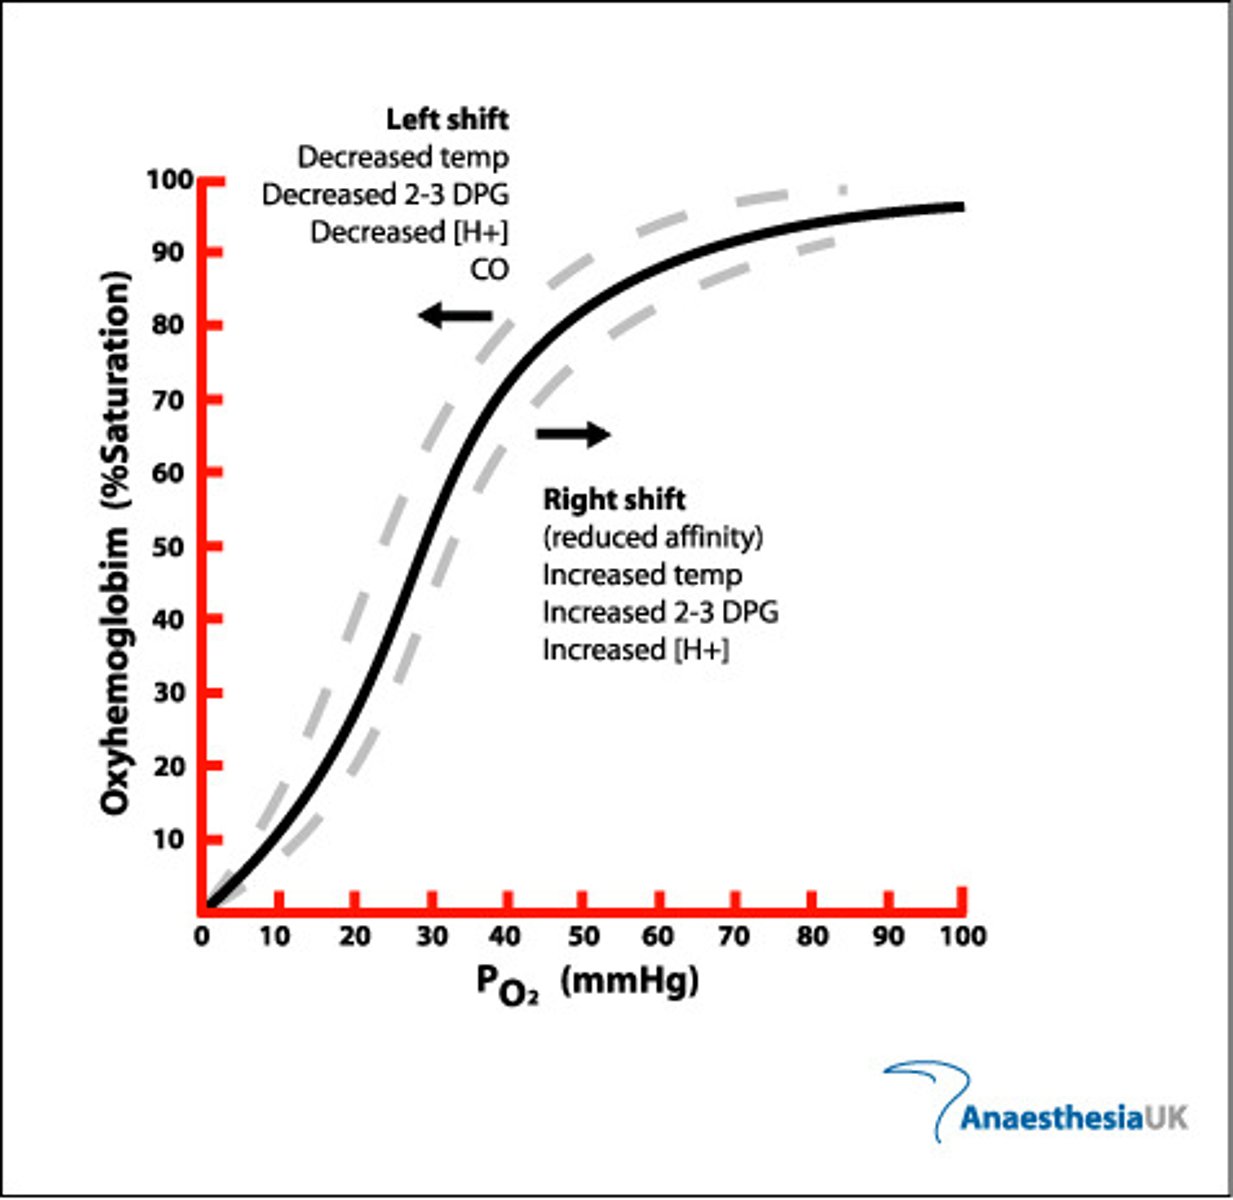
What is the Bohr shift?
Changes in the oxygen dissociation curve as a result of CO2 levels. It explains how the ability of haemoglobin to bind and release O2 changes
Where might the partial pressure of CO2 be high?
Respiring tissues
What happens to the hb when the partial pressure of CO2 is high?
Hb affinity for O2 is reduced so more O2 is given up
Why do higher levels of CO2 cause the affinity of hb to decrease?
CO2 lowers the pH of the blood which causes haemoglobin to release O2
How does the oxygen dissociation graph change in high pCO2?
The graph shifts to the right
What does it tell us when the dissociation curve has shifted to the right?
- High levels of CO2
- More dissociation has occurred as the % saturation of O2 is lower
Why is the shift in dissociation curve in high pCO2 important?
There is often high CO2 in respiring tissues, so having CO2 decrease hb affinity for O2 means more is released where it is needed
(Increased CO2 = Decreased hb affinity for O2 = Increase in O2 released)
How does the oxygen dissociation graph change in high altitude?
It shifts to the right
Why does the oxygen dissociation graph in high altitude shift to the right?
Because the hb needs to be able to pick up more O2 (higher saturation) at lower partial pressure
Why does the oxygen dissociation graph in low O2 shift to the right?
Animals which live in low O2 environments such as in the ground need to be able to pick up sufficient O2 in an O2 deficient environment (lower partial pressure)
Which way does the oxygen dissociation curve of a foetus shift and why?
To the right because it needs to pick up more O2 at lower partial pressures
How do you compare oxygen dissociation graphs?
When looking at the two lines, focus on the same partial pressure and then look at the different O2 saturation
What does it mean when the bohr curve shifts to the right and left?
- Right = lower affinity for O2, more likely to give it up
- Left = higher affinity for O2, more likely to pick it up
Oxygen dissociation curve of myoglobin
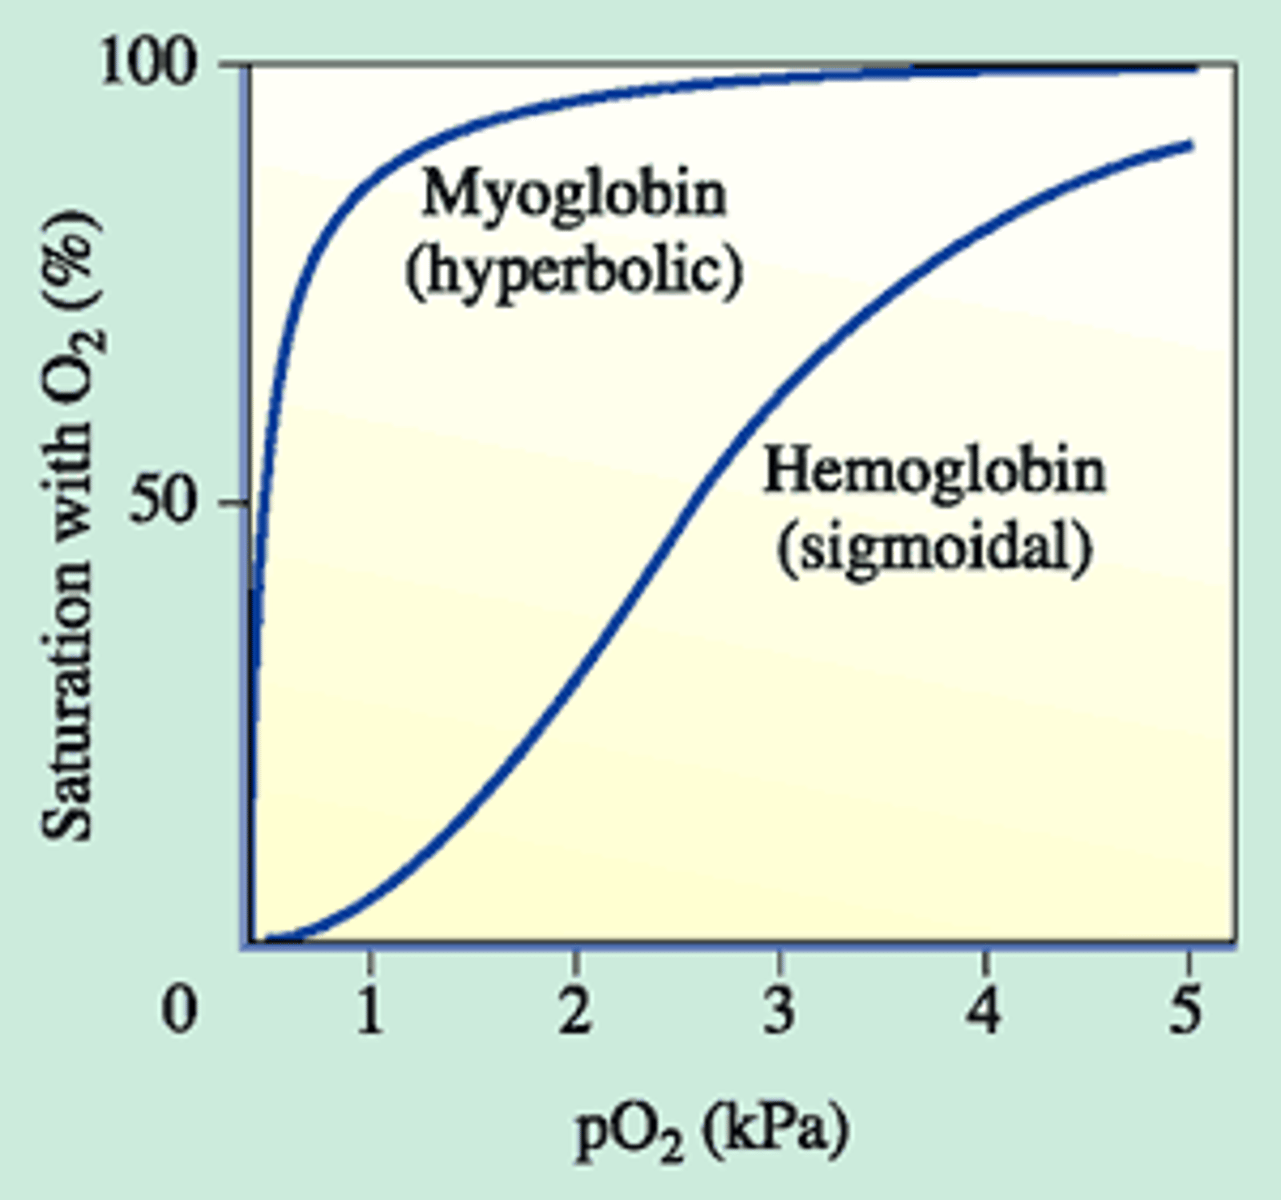
Why does the oxygen dissociation curve of myoglobin shift so far to the left?
Because it needs a much higher affinity for O2 than hb as it needs to take O2 from the hb itself