Lecture 7- Measuring Biodiversity
1/12
There's no tags or description
Looks like no tags are added yet.
Name | Mastery | Learn | Test | Matching | Spaced |
|---|
No study sessions yet.
13 Terms
population
group of a SINGLE species
community
group of more than one species, living and interacting together
species richness
#of species in a community
rarefaction curve
a graph that plots the number of species against the number of samples collected to estimate if enough data has been gathered to accurately represent a community
the curve itself is an average of all options of species accumulation curves (the order in which species and individuals are accumulated)
when the rarefaction curve flattens off, close to all species have been sampled
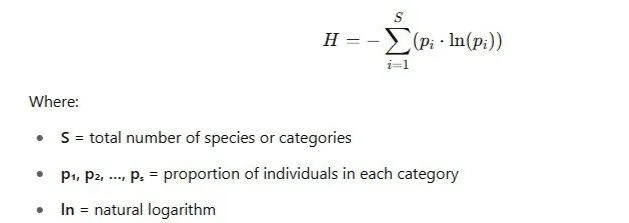
Shannon-Wiener Diversity Index
*species proportions can come from biomass, counts, or percent cover
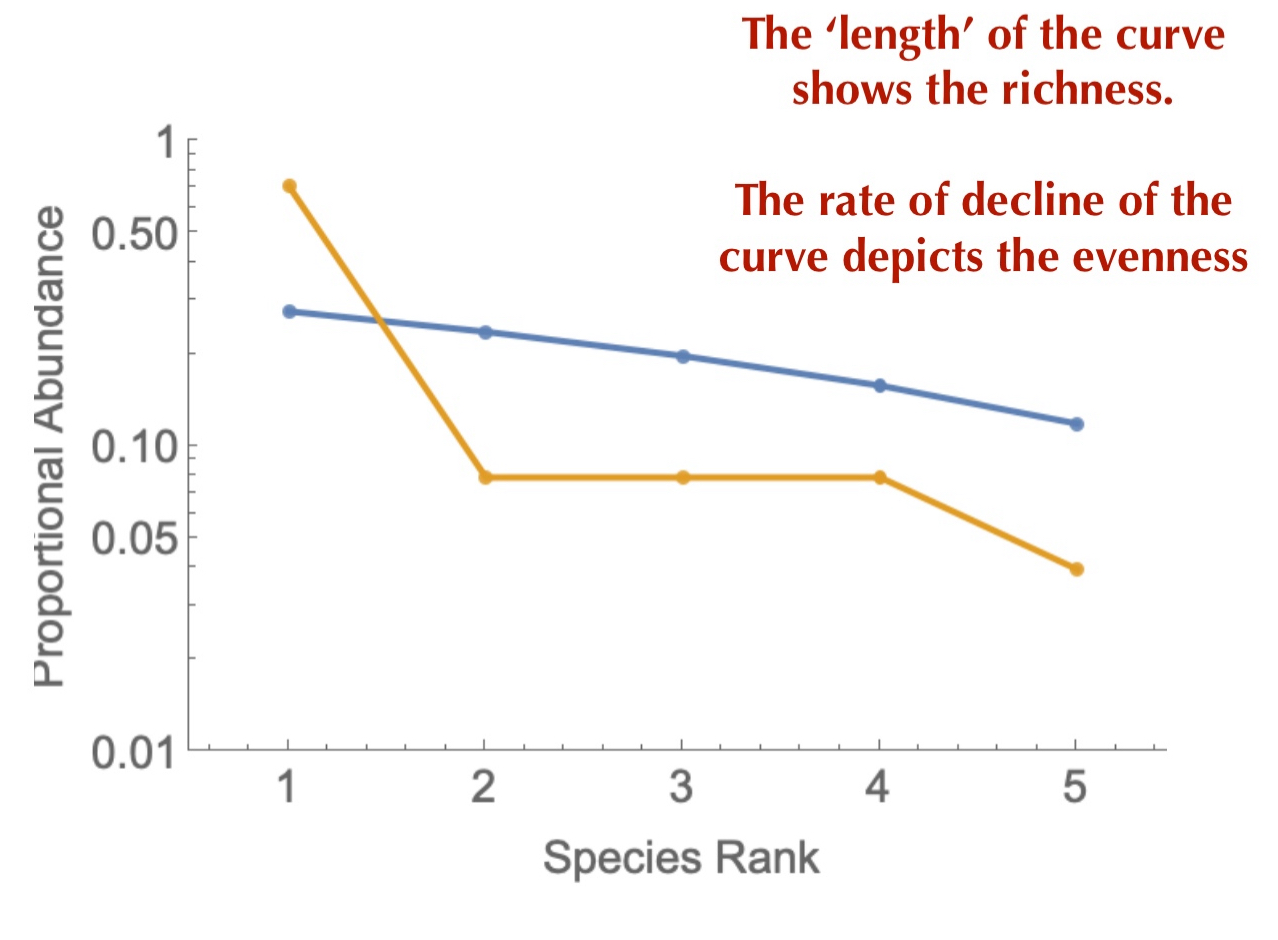
Rank-Abundance (Whittaker) Plots
Species are ranked according to absolute or relative abundance, then plotted against the Log(abundance type used)
Species (Richness)-Area relationship equation
Log(s) = Log(C) + Z x Log (A)
Theories explaining biodiversity of the tropics (Latitudinal Species Gradient)
Species diversify faster due to stable climate and large land area
Species have been diversifying for longer in the tropics due to glaciation events not affected tropics
Primary productivity (autotroph energy fixation) is greater in the tropics due to increased solar energy per unit in the tropics
Mid-domain effect causes more species to exist in the tropics than anywhere else if the range of a species cannot go off the end of the earth (must overlap somewhere)
methods of predicting species amt on earth
Extrapolate temperate species abundance to tropical species (most missing species should be in the tropics, and there are about 2-3 tropical species for every temperate species)
Extrapolations from detailed study of a particular group
Extrapolations using species characteristics (missing species are most likely smaller species)
Extrapolating via rarefaction curves