AP Human Geography Unit 2
1/34
Earn XP
Name | Mastery | Learn | Test | Matching | Spaced |
|---|
No study sessions yet.
35 Terms
Population Distribution
The Pattern in which humans are spread out on Earth's Surface.
Population Density
The number of people in a particular land area.
Population Distribution is influenced by:
Physical and Human factors
Physical Factors
climate, landforms, water bodies
Human Factors
culture, economics, history, politics
Arithmetic Density
This simply the total number of people divided by the total land area.
Physiological Density
Total number of people per unit area of arable land
Agricultural Density
The number of farmers per unit area of arable land.
Political changes due to lower population density:
- Fewer voters, but more local influence - Less representation in government
Political changes due to higher population density:
- More voters, greater diversity of political opinions - More political representation
Economic changes due to lower population density:
- Higher cost per person for services - Harder for government to provide services - Fewer goods/services & jobs - Lower cost of living
Economic changes due to higher population density:
- Lower cost per person for services - Services more available but in higher demand - More jobs, but also more competition - Higher cost of living
Social changes due to lower population density:
- Stronger sense of community - Lower crime rate - Slower pace of life
Social changes due to higher population density:
- Weaker sense of community - Faster pace of life - Higher crime rate - Greater demand for services - Increased pressure on sanitation, water supply, and healthcare
Environmental changes due to lower population density:
- More green spaces - Less pollution
Environmental changes due to higher population density:
- Fewer green spaces - More pollution
Population Composition
Population composition refers to the characteristics of a population including age and sex.
Age Distribution
The way people are divided into different age groups in a population. The number or percentage of people in each age group.
Sex Ratio
Ratio of males to females in a population.
Causes of Fewer Women
Sex-selective practices: In some countries, cultural preferences for sons lead to selective abortions or neglect of daughters.
Maternal mortality: High rates of death during childbirth can lower the share of women.
Labor migration: Gulf states (like Qatar or UAE) show fewer women because many working-age men migrate in for construction and labor jobs.
Causes of Fewer Men
Labor migration: In some societies, women are less likely to migrate for work, leaving behind a male-heavy labor force abroad but a lower share at home.
Wars and conflicts: Countries that experience high male combat deaths (historically or recently) often have more women.
Life expectancy: Globally, women live longer than men, so older age groups are often female-dominated.
Life Expectancy
The number of years a person can expect to live in a specific place.
Low-Income Countries LE
Life expectancy averages around 59–63 years and depends most on clean water, sanitation, sufficient nutrition, and access to basic healthcare.
Middle-Income Countries LE
Life expectancy averages fall in the low 70s (around 73 years) and improves through better education, stronger healthcare systems, effective government policy, and economic growth.
High-Income Countries LE
Life expectancy ranges between 79 to 82 years and is shaped by healthy nutrition, lifestyle choices (diet, smoking, exercise), aging populations, and environmental issues such as pollution.
The Impact of Inequality
Inequality exists both between and within low-, middle-, and high-income countries, as wealth, resources, and opportunities are unevenly distributed. Inequality means not everyone in a country has the same life chances — even in rich countries, some people live much longer than others.
Dependency Ratio
The number of people who are not of working age (too young or too old) relative to the number of people who are of working age. The higher the number, the more people are dependent on the working age.
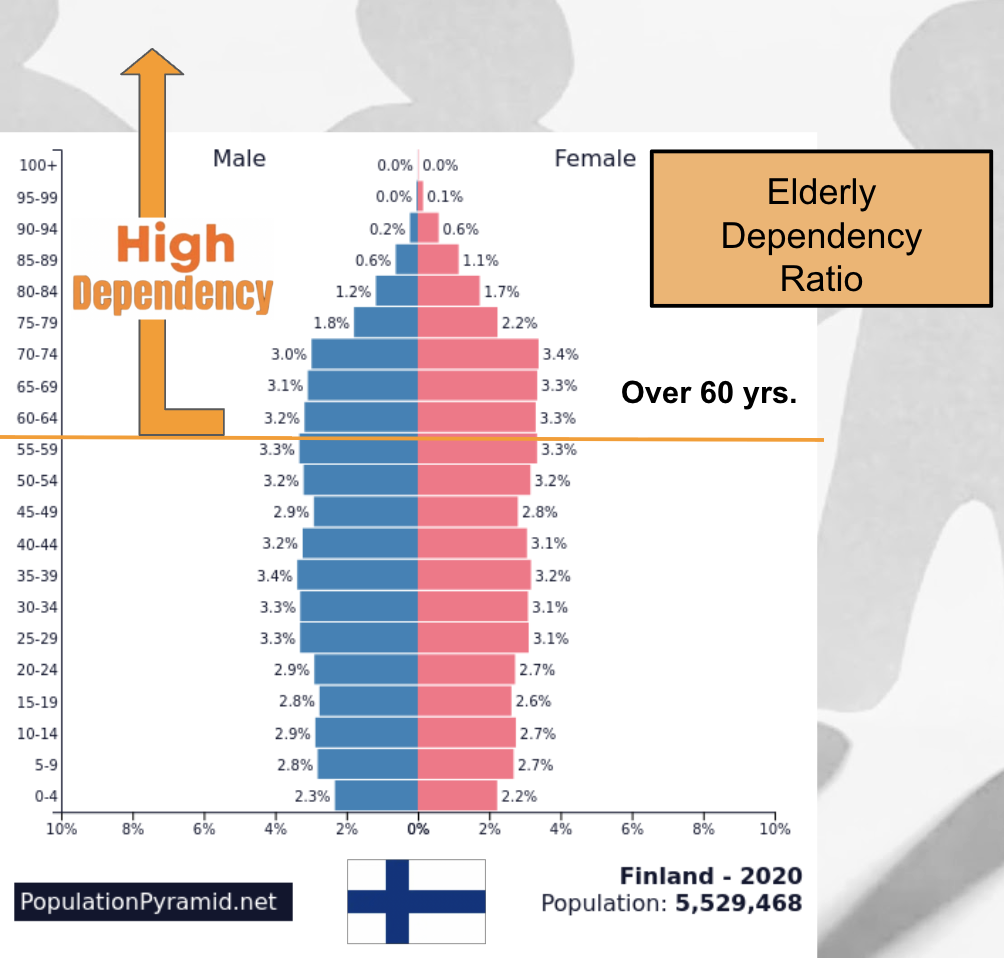
Elderly Dependency Ratio:
The measure of how many older adults (65+) rely on the support of the working-age population (15–64).
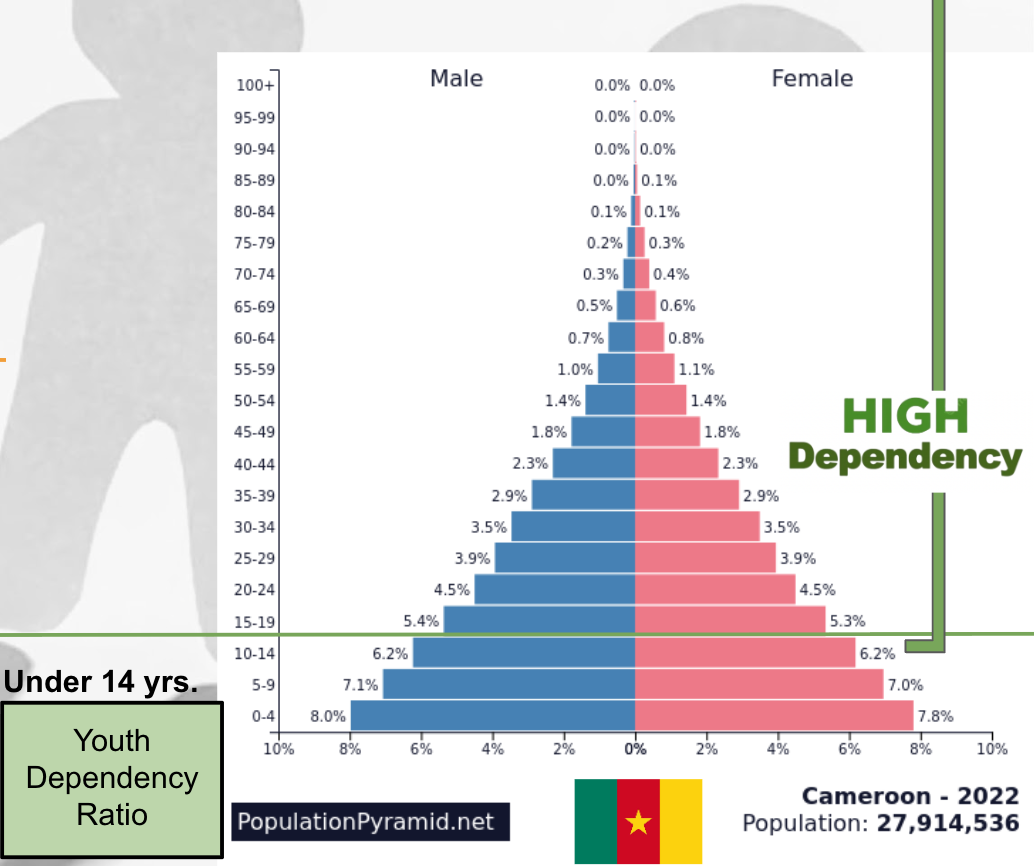
Youth Dependency Ratio:
The measure of how many children (0–14) depend on the working-age population (15–64) for care and resources.
Age Structure
Comparison of the size of different age groups.