Unit 4 - Intro to marketing
1/110
There's no tags or description
Looks like no tags are added yet.
Name | Mastery | Learn | Test | Matching | Spaced |
|---|
No study sessions yet.
111 Terms
Market Size
Volume or value of sales of a product
Market Growth
The percentage change in sales (volume or value) over a certain period of time

Variables that a market is affected by?
Economic Growth
Nature of product
Changes in taste
Social changes
Fashion/trends
Market share
The percentage of sales of a product or services held by one firm or brand
Market Concentration
The market share of top firms in an industry
Marketing
The management role of predicting, identifying and meeting the needs and wants of customers in a profitable manner
List the 7 P’s
Promotion
People
Process
Place
Physical evidence
Price
Product
Market Orientation
An approach that is adopted by business that are outward looking. They focus on making products they can sell rather than selling products they can make. - Primark
Product Orientation
An approach that is adopted by businesses that are inward looking. They focus on selling products that they can make rather than making products that they can make. - Iphone
USP
Unique selling point
Commercial Marketing
The use of marketing strategies to meet the needs and wants of consumers in a profitable way.
Social Marketing
The planning and implementation of programs to bring about social change using concepts from commercial marketing.
Market planning process
Marketing audit
Marketing objectives
Marketing strategies
Monitoring and reviews
Evaluation
Market Segmentation
The division of the market into sub groups according to different factors.
Types of Market Segmentation
Demographic - Age, gender, race, income
Geographic - Climate, location
Psychographic - Emotions and life style of customers - values, status, religion
Behavioural - Actions, habits, and interactions with a brand or product
Advantages of Market Segmentation
Understanding of customers
Higher Sales
Product differentiation
Identification opportunities
Describe a Perception Map for Quality and Price.
High P & Q - Premium Brand
High P & Low Q - Cowboy Brand
Low P & Low Q - Economy Brand
Low P & High Q - Bargain Brand
Niche Marketing
Targeting a specific and well defined segment of a market. E.g Ferrari, Red letter days, Build a bear etc.
Mass marketing
A number of different market segments are communicated at the same time
Niche marketing advantages and disadvantages
Advantages:
Less competition
Can charge more
Advertising may be cheaper
Easy to tailor products
Disadvantages:
Less customers
Mass marketing advantages and disadvantages
Advantages:
More customers
Economies of scale
Disadvantages:
Not personalised
What are the ways of a company differentiating themselves?
Packaging
Design
Size
Colour
Payment & delivery options
Simple linear regression
Business management tool used to study the nature of the relationships between two variables
Correlation
Indicates the extent to which there is a relationship between the variables or events e.g the amount of marketing expenditure and market share.
Sales forecasting
Is a quantitative management technique used to predict a firms sales over a given period of time.
It is important as it can help a business identify problems and opportunities in advance.
Market Research
The identifying and forecasting the buying habits of consumers which can be vital to a firms prosperity and survival.
Extrapolation
The forecasting technique which identifies a firm’s sales trend by using historical data and extending this trend to predict future sales.
Time series analysis
The sales forecasting technique attempts to predict sales levels by identifying the underlying trend from a sequence of actual sales figures recorded at regular intervals in the past.
Seasonal Variations
Periodic fluctuations in sales revenue during different times
Cyclical Variations
These are recurrent fluctuations in sales revenue linked to the economic cycle of booms and slumps.
Unlike seasonal variations, cyclical variations can last longer than a year.
Random Variations
These are unpredictable fluctuations in sales revenue caused by erratic and irregular factors that cannot be practically or reasonably anticipated.
Benefits and Limitations of Sales Forecasting
Benefits:
Improved working capital and cashflow - better cashflow management as they have ideas of sales and revenue so they can anticipate better.
Improved stock control - ensure correct levels of stock are available for use in production at different times in the year.
Improved product efficiency - the ability to plan for the correct levels of production means better use of their resources.
External Sources of finance - sales requirement needed in business plan used for loans and potential investors.
Limits:
Limited information and predictions are based on the past so there’s no guarantee of it happening again.
They are based on guesses and don’t take disasters(COVID, wars etc.) and economic collapses into account.
Garbage in Garbage out - if data is outdated the forecast will be unrealistic and of no use to management.
Describe a Perception Map for Competitive Advantage and Scope.
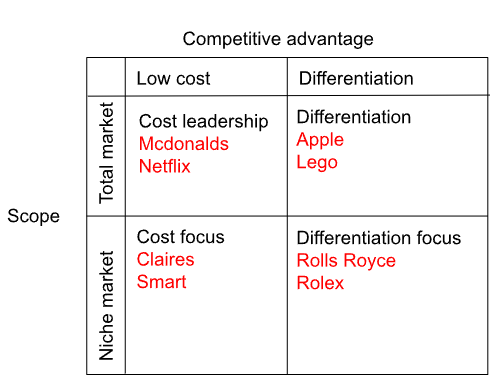
Generic strategies
A business management decision making tool that outlines the competitive business strategies that a firm uses to compete with others.
Ad Hoc market research
Now and then, when necessary for a specific issue to be solved.
Continuous market research
Constantly researching the market, on a regular ongoing basis.
Quantitative market research
Collecting and using factual and measurable/numerical information
Qualitative market research
Getting non- numerical answers and opinions
Primary research
Collecting information yourself for a specific purpose.
Types of Surveys
Self-completed, Personal, Telephone, Online postal.
What makes a good survey?
Avoiding bias or leading questions e.g. how much did you like …
Avoid jargon (language that people don’t know)
Use open and close ended questions
Interviews Pros and Cons
Pros:
In depth analysis
Misunderstanding can be connected
Further questions can be asked based on responses
Cons:
Non - quantitative means analysis can be difficult
Time consuming
Potential interviewer bias
Focus groups
A team of consumers discussing their thoughts and feelings about a given product or market.
Focus groups Pros and Cons
Pros:
Engaging discussions
Products tried and tested
In depth analysis of a number of people
Cons:
Time consuming
Expensive
Participants may have similar personality traits
Observation
Watching how people behave and respond in different situations
Observation Pros and Cons
Pros:
Shows what consumers are thinking
Demonstrates what consumers actually do, not just what they think they do
Cons:
Expensive to employ psychologists
Secondary research
Taking the information that has been collected for a different purpose.
Market analysis and how can it be done?
Gathering and evaluating information about an industry, target customers, and competitors to determine the viability of a business or product.
Can be done through:
Specialist market research: ACORN, Mintel
Competitors: websites, annual reports.
Trade publications: Specialist magazines
Academic journals
Publications from educational and research institutions
What are the Government publications that can be used for secondary research?
ONS - economic and social trend (Office for national standards)
Census of population - once every 10 years
Types of media articles for secondary research
Books - Auto/Biographies, text book
TV - Documentaries
Newspapers - Reputable source only such as Financial times
Business journals - The Economists
Internet - reliability
Secondary market research Pros and Cons
Pros:
Generally Cheaper
Wide range of sources
Large sample size
Provides further explanation on an industry
Cons:
Could be outdated
Needs to be manipulated to suit the needs of the researcher.
Sample
A selected proportion of the population used for primary market research purposes.
Random sampling
Each member of the target population has an equal chance of being chosen, may lead to unreliable results.
Quota sampling
Already knowing the target market/takes it into account.
If 40% of the target market is male then 40% of the sample should be male.
Convenience sampling
Using individuals who are easy (convenient) to reach.
List the 5 D’s
Damage - protection of people and the environment.
Deceitful - presenting data openly, not in a misleading way.
Deceptive - letting people know their views are being recorded.
Disclosure - Breach of confidentiality, sale of consumer information.
Detachment - Interviewer must be free from bias.
Fast moving goods
Everyday convenience products, frequent purchases e.g. groceries.
Consumer perishables
Products which do not last a long time. Not necessarily ‘frequent’ e.g. flowers.
Consumer durables
Products which last a long time. Usually expensive so infrequent purchase e.g. furniture
Speciality products
Exclusive, highly expensive products. E.g. house, sports car
Product Portfolio
The range of products or brands provided by a business.
Describe the Boston Matrix
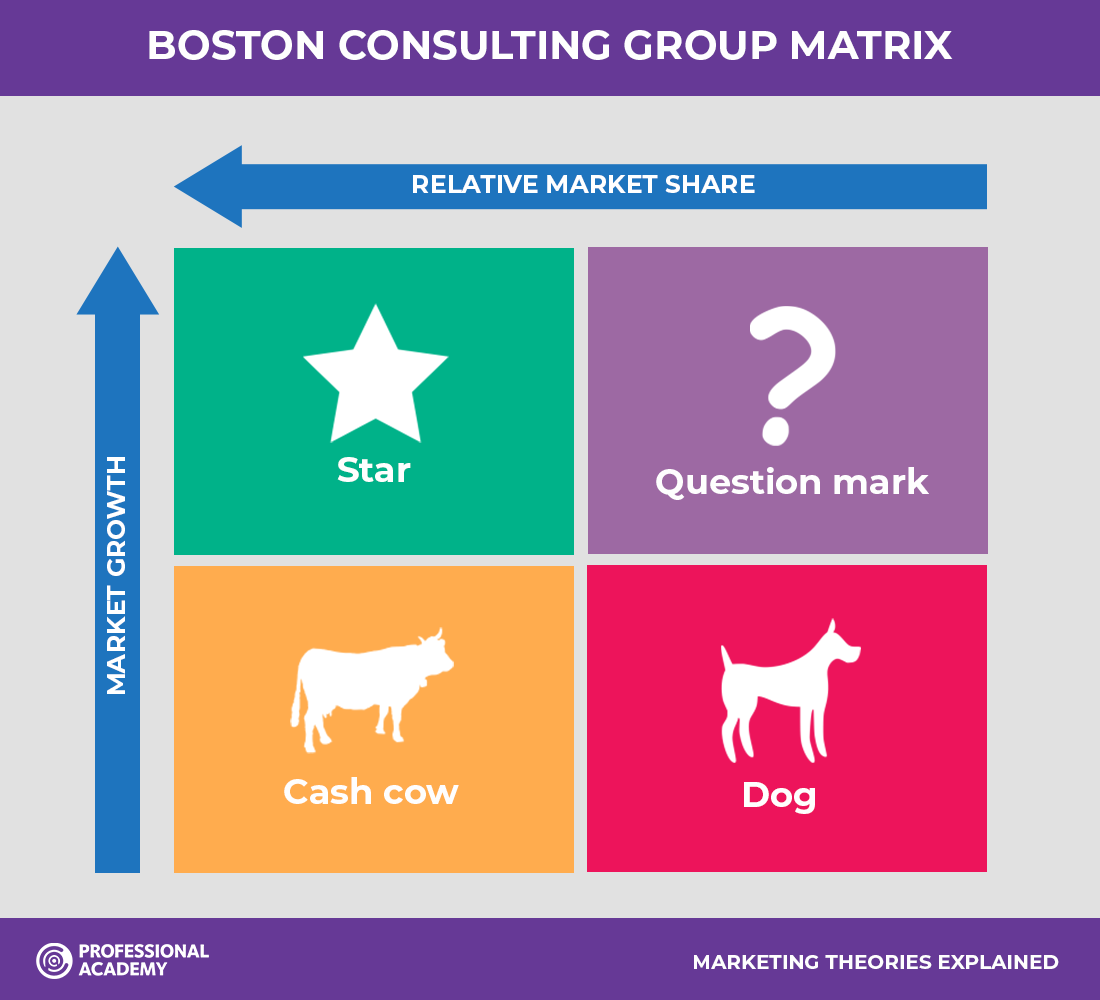
Describe a Star on the Boston Matrix
High Market Share and growth, increasing revenue but also competition, high promotion costs and outflows may exceed inflows at first.
Describe a Cash Cow on the Boston Matrix
High market share, low market growth, established markets, lower promotion costs, less new competition therefore high barriers to entry, products can 'milked’ i.e. they generate revenue to support other products.
Describe a Question mark on the Boston Matrix
Low market share, high market growth, has lots of potential to become stars or even cash cows, often termed question marks at the start of their cycle. High levels of investment to do.
Describe a Dog on the Boston Matrix
Low market share and growth, most likely to be withdrawn if the business gets into financial difficulty.
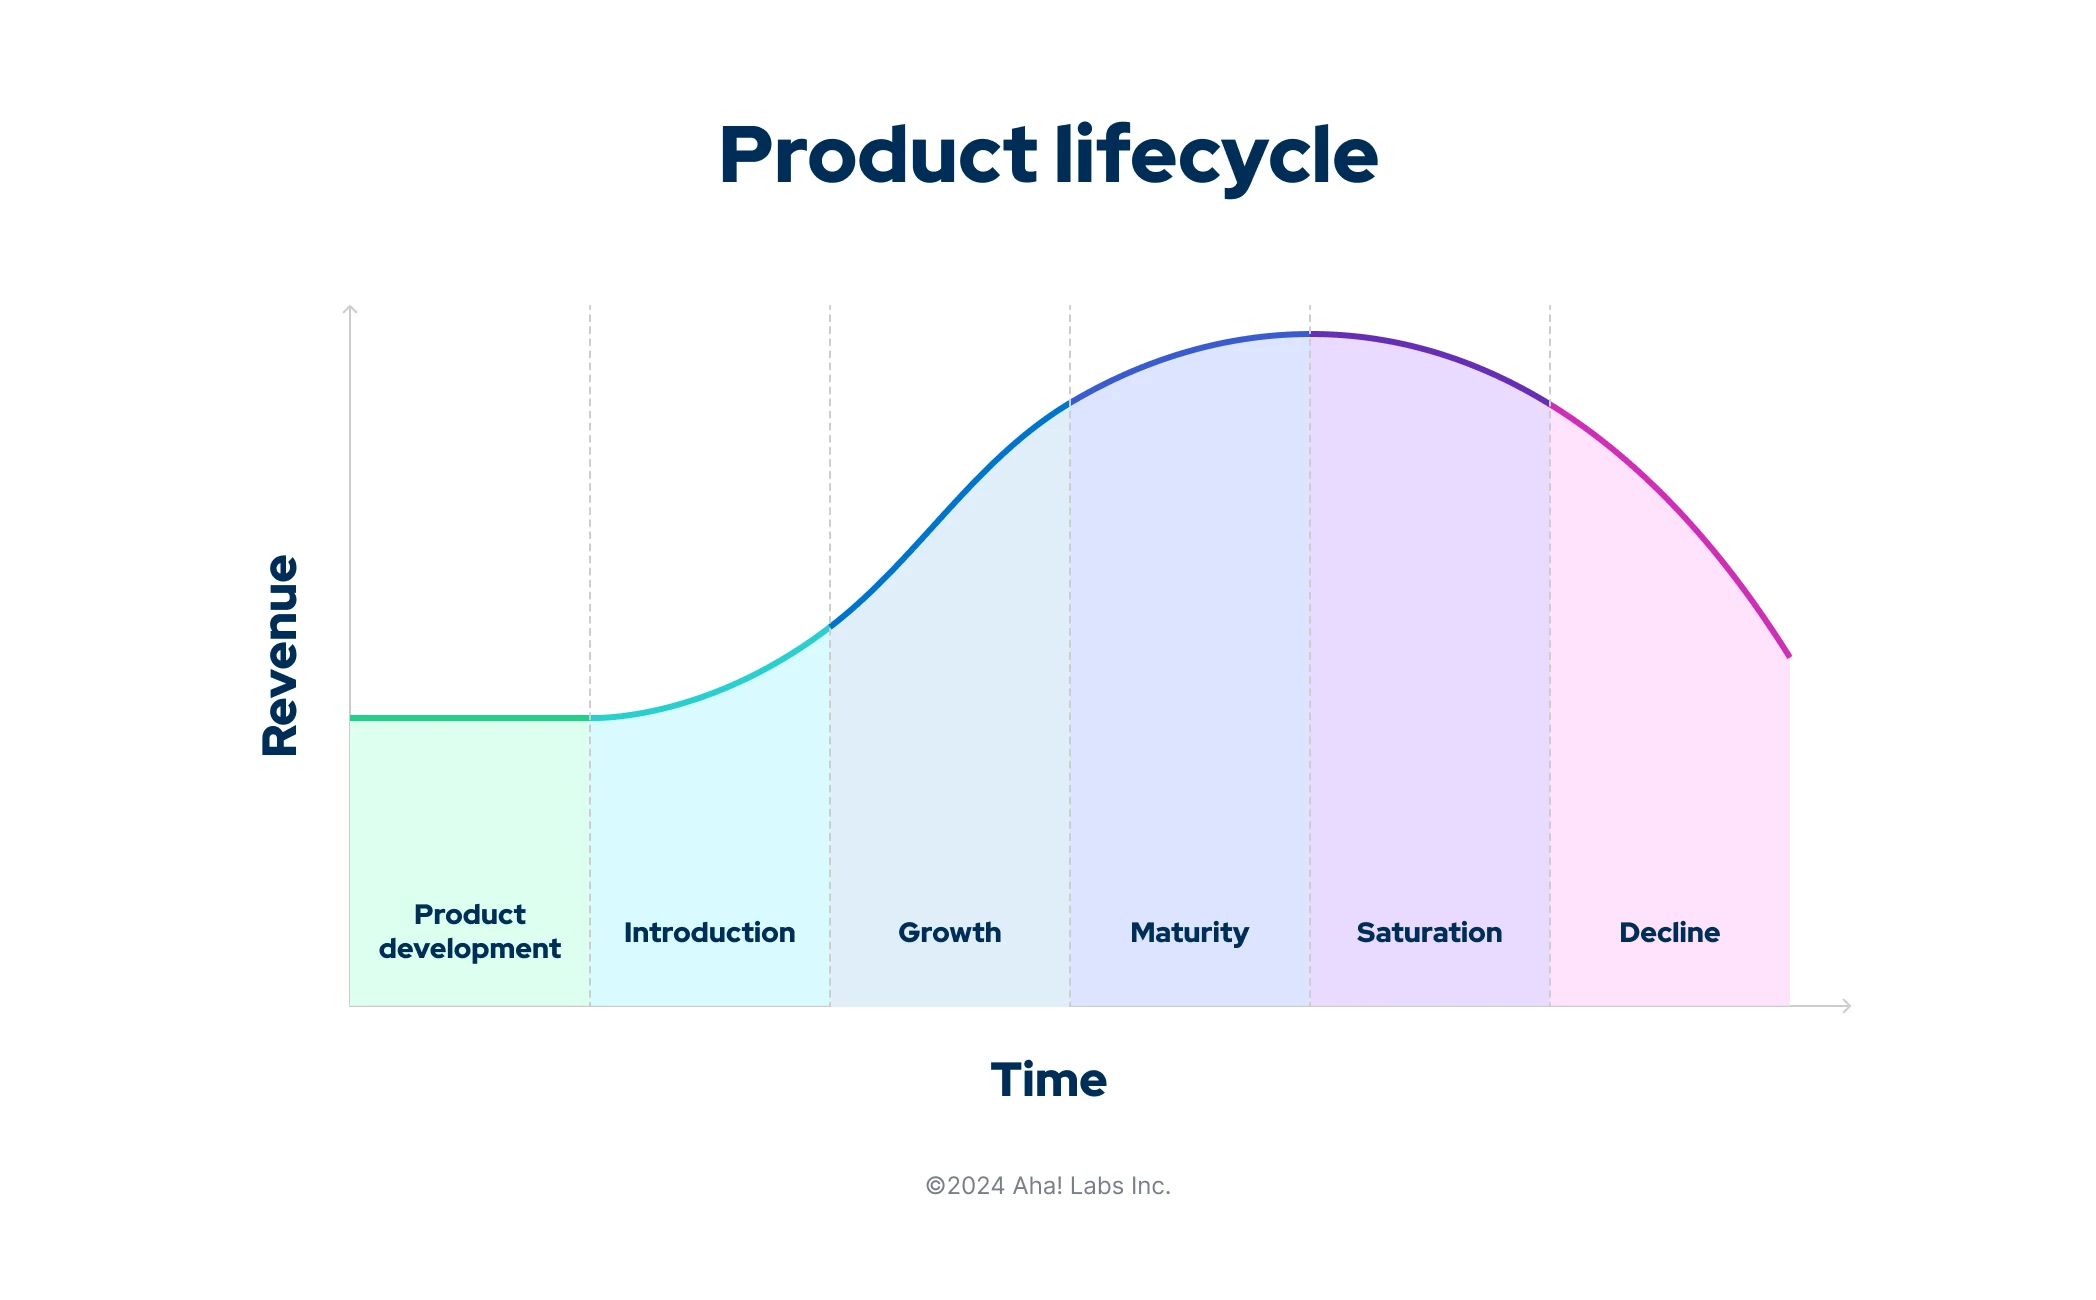
Describe a products life cycle
Product design
Deciding on a production method whereby the product works well, looks good and can be produced easily and at the lowest possible cost.
Product development
The creation of a new or improved good or service for release into an existing market
Describe the process of developing new goods or services
Generating ideas
Analysis of ideas
Product development
Test marketing
Launch
List Influences of the development of a product
Entrepreneurial skills
Competitors’ Actions
Technology
Results of market research
Ideas from other countries
Personal needs
Personal experiences
Environmental issues
Comment on the Introduction section of a PLC
Launch of product
Product awareness is low, advertising costs are high
Negative cash flow, expenditure greater than revenue
Effects depend on the company, for example a large investment on advertising and PR before the launch will result in potentially high sales/ revenue
Comment on the Growth section of a PLC
Increasing popularity
Retailer confidence
Firm may start to achieve break-even and achieve profits
Comment on the Maturity section of a PLC
Profitable
Sales may reach more of a platform/ may plateau but can still increase.
Comment on the Saturation section of a PLC
Competitors attracted to the market, which can affect sales.
Comment on the Decline section of a PLC
Falling sales
Many firms will remove the product from their portfolio at this stage.
Extension strategies
Methods used to lengthen the product life to delay its decline e.g. changing taste, features of the product, price or targeting new markets.
Brand
A name, colour, sign, symbol, font or design that is identifiable with a product of a particular business.
List what branding is
A legal instrument, brand name create a legal identity that can’t be copied.
A risk reducer, brands give new products in the portfolio a better chance of survival.
An image enhancer, a successful brand > premium pricing.
A revenue earner, branding encourages brand loyalty.
List what branding creates
Intangibility, brands place an intangible value on the physical product.
Uniqueness, brands are unique, products can be copied.
Timelessness, products can become obsolete but their brand name lives on.
Trademark
Gives legal protection to the owner to have an exclusive use of the brand name.
Brand awareness
Measures the extent to which people recognise a particular brand. Often expressed as a percentage of the sample surveyed.
Brand development
Refers to the ongoing and long-term marketing process of improving and enlarging the brand name in order to boast sales revenue and market share.
Brand loyalty
Occurs when consumers buy the same brand of a product repeatedly overtime. Customers are devoted to the brand as they have brand preference over other rival brands.
Importance of brand loyalty
It helps a business maintain or improve their market share.
It helps enable businesses to charge premium prices for its products, which improves their profit margins.
It acts as a barrier to entry in highly competitive markets, such as fashion and consumer electronics industries. This is because brand loyalty reduces the likelihood of brand switching.
It plays major role in the future success of a business, helping to prolong the product and brand’s life cycles.
Brand value
The premium that consumers are willing to pay for a brand name over and above the value of the product itself, i.e. customers are willing to pay more for a reputable brand.
Advantages of boosting brand value
Higher market share - market share is an indicator of the level of development and brand loyalty.
Premium Prices - Having high brand value allows a business to charge higher prices for its products because consumers feel that they are paying for the value added that the brand carries.
Higher barriers to entry - Brand value makes it more difficult for a new business to enter the market and compete, simply because customers are loyal to the existing brand.
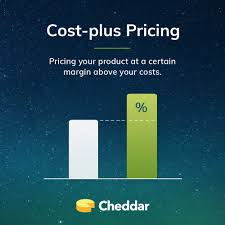
Cost Plus Pricing
Adding a percentage or specific amount of profit to the cost per unit of output to determine the selling price - Mark up
Penetration pricing
Low prices are set to penetrate or break into the market or gain a sudden spurt in market share.
Loss Leader Pricing
Setting a price below the cost of production with the intention of raising sales of other products in a firm’s product portfolio.(Draw them into the store)
Predatory Pricing
A firm sets very low prices to drive other firms out of the market.
Could be deemed illegal
AKA Destroyer Pricing
Premium Pricing
Setting the prices significantly higher than similar competing products, usually because the product is of higher quality or is significantly unique.
Dynmaic Pricing
Varying price to reflect changing market demand. Peak and of Peak.
Competitive pricing
Firms set prices equal to or similar to competitors.
Contribution Pricing
Takes into accont the direct costs of making the product.
Price Elasticity of Demand
The responsiveness of a change in quantity of a good or service demanded to a change in price.
Inelastic demand
Quantity of goods relatively unresponsive to price 0 <e < 1.
Elastic demand
Quantity of goods relatively responsive to price e > 1.
What would a increase and decrease in price do to the total revenue of an inelastic, unitary and elastic product?
Increassse Tr and the oppsirte for a decrease in P