Statistics for Behavioral Science
1/45
Earn XP
Description and Tags
Chapter 5, 6, 7, 8
Name | Mastery | Learn | Test | Matching | Spaced | Call with Kai |
|---|
No analytics yet
Send a link to your students to track their progress
46 Terms
Alpha
Level of Significance
What is alpha if it isn’t specified?
a = 0.05
When to use z-test
When you know the population standard deviation (sigma) and the sample size is large (n > 40)
When to use the t-test
When you don’t know the population standard deviation (sigma) and have a small sample size (typically n < 40). )
When to use a two-sample z-test
It is used when you have a large sample size and know the population standard deviation (n > 100)
When to use a two-sample t-test
It is used when you have a large sample size and know the population standard deviation (n < 100)
Null hypothesis
Population mean is the SAME as that of the sample. There are no mean differences between groups
(H0: mu = x)
Alternative hypothesis
The population mean is different from the sample. There are mean differences between groups
(H1: mu ≠ x)
Type 1 Error
False positive result, rejecting a true null hypothesis. (A fire alarm going off with no fire) p = alpha
Type 2 Error
False negative; failing to reject a null hypothesis (A fire alarm not going off during a fire) p = beta
Effect Size (d)
difference between our means
Region of Rejection
The area in a statistical distribution where, if the null hypothesis falls inside the range of your t-test results, we fail to reject the null hypothesis
When do you use the two-tailed test
When the problem does not have a direction (lower/higher)
When do you use the one-tailed test
When you have a direction present in the problem
P-value
The probability of obtaining a test statistic as extreme or more extreme than the one observed, assuming the null hypothesis (H0) is true
What do you use when know the standard deviation and the sample size is anything
Z-test
What do you do when there is a Large Sample (n ≥ 40) and the standard deviation is unknown
Use t-test (Z-test approximation is possible but not preferred)
What do you do when there is a small Sample (n < 30) and standard deviation is unknown
Use t-test (t-distribution is required).
Two sample t-test types
Pooled variance t-test & Separate variance t-test
Steps to decide to use pooled-variance t test or separate variance t test
Three steps in order: sample size large
Steps to decide whether to use a t-test or a z-test
1. Do you have sigma? Yes, do z. No, ask the second question.
How big is n? If n is 40 or more, do z. If less than 40, t.
Null hypothesis distribution
A map of what results are not likely by chance
Critical z-score
Z scores that serve as the boundary of the area which is determined by the alpha
P-level
If the p-level is bigger than alpha then we fail to reject the null hypothesis; if the p-level is smaller then as reject the null hypothesis
Reducing Type 1 Error
lower your alpha level (from .05 —> to .01)
Reducing Type 2 Error
use a one-tailed rather than a two-tailed test
Determining Homogeneity of Variance (HOV)
If you
Levene’s test
If the p-value si greater than 0.05, then you can assume HOV; if you have less than 0.05 then you do not have HOV
Estimated effect size (g)
How to find the difference between means
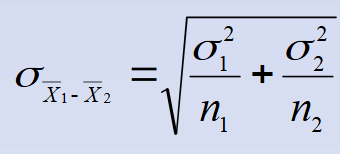
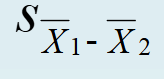
The standard error of the difference between means
If you know the population standard deviations
The standard error of the difference between the means would look like this:
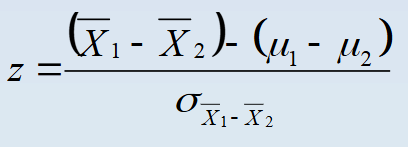
Comparing 2 sample means with a z test
(unusual)
Pooled variance t-test (Sp²)
Two sample variances can be pooled together to form a single estimate of the population variance. We also assume that these two populations have same variance (HOV)
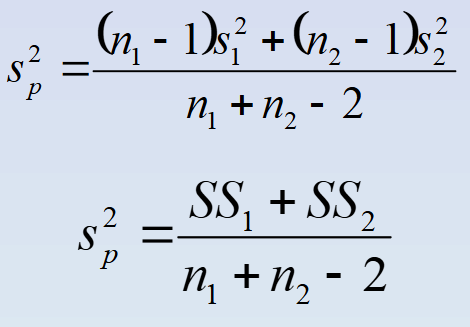
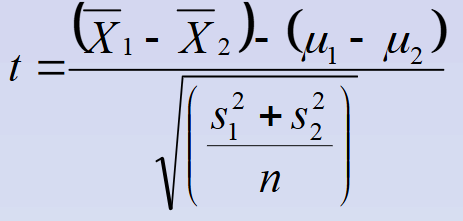
Pooled variances t-test formula (for unequal sample sizes)
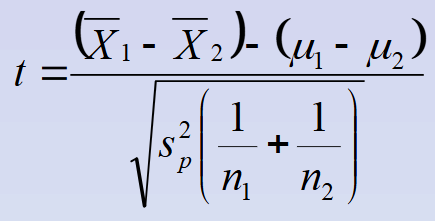
Denominator of pooled variances and separate variances
It is the estimated standard error of the difference between means
Pooled t-test for equal sample sizes
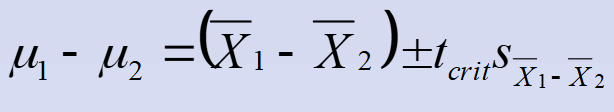
Confidence intervals for the difference between two population means
One tailed test
Two tailed test
Tcalc and Tcv approach
That's when we find significance by comparing tcalc with the tcv.