Week 4 Online Homework
1/22
There's no tags or description
Looks like no tags are added yet.
Name | Mastery | Learn | Test | Matching | Spaced | Call with Kai |
|---|
No study sessions yet.
23 Terms
Which of the following statements is true?
Density-independent growth results in exponential population growth.
Which of the following statements about a population experiencing logistic growth is true?
If N is greater than K, the population size will decline.
Based on the figure, which statement correctly interprets the data? (clutch size is the number of eggs in the nest)
There are density-dependent effects on clutch size.
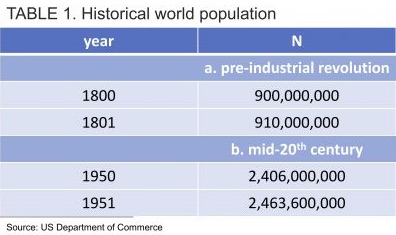
Use the data in Table 1 to determine the annual population growth rate (r) for the global human population (a) pre-industrial revolution and (b) by mid-20th century:
For the time interval 1800-1801, r = [0.011].
For the time interval 1950-1951, r = [0.024].
Each of the following are true statements about changes that occurred between 1800 and 1950 AD.
What could account for the direction of change in the population growth rate
Advances in medicine led to a dramatic reduction in mortality, particularly infant mortality.
Advances in mechanized farming and pest control resulted in rising crop yields per acre (more food grown per farmed acre).
Technological advances, particularly in irrigation technology and industrial production of fertilizers, allowed for expansion of agriculture onto land that was previously unsuitable for growing of crops.
Based on your answer to question 4, the human population grew _____________ between 1800 and 1950 AD.
faster than exponentially
The status of black-footed ferrets will be reevaluated and potentially downgraded from "critically endangered" to "endangered" once their population size exceeds 2000 individuals. Assuming no change to their annual growth rate in 2010, in what calendar year (in AD) would this occur?
2014
A population survey of this population of black-footed ferrets in the same year you identified in the previous question found ~1300 individuals in the wild instead of your estimate of over 2000. What can you conclude happened to this population since 2010 based on a comparison of your population size estimate for this year in the previous question and the observed number?
The population growth rate declined since 2010.
What is the growth rate in the year you just identified in question 7 above, given the population size of 1300 in this year and a population size of 1090 individuals as revealed by a census in the previous year?
0.1925
Which of the following hypotheses are consistent with this observed predator-prey relationship between black-footed ferrets and prairie dogs?
The food web that includes black-footed ferrets is relatively linear, preventing prey-switching of the ferrets.
The carrying capacity of black-footed ferrets is closely tied to the population size of prairie dogs.
In the case of two competing barnacle species, the larger species Semibalanus is able to eliminate individuals of the smaller species Chthamalus through interference competition over its entire fundamental niche by overgrowing or dislodging them as they grow larger. Which of the following could be an explanation (reasonable hypothesis) that is sufficient to fully explain why Chthamalus evades competitive exclusion within the high-tide zone?
The high-tide zone is outside the range of tolerance for Semibalanus.
Why are populations of both competing species increasing at the time step indicated by the arrow?
Their population sizes are well below their carrying capacity.
Which of the following has to be true about the two species shown in the graph in the previous question?
The niche of species 1 overlaps completely with that of species 2 in the environment these data were collected in.
Species 1 is competitively superior to species 2 across the full range of environmental variation encountered in the observed area where the populations size data in this plot were collected.
In the absence of the other species, species 1 is more likely to maintain a higher carrying capacity than species 2.
Which of these are possible reasons why the impact of the outdoor cat population on the longterm viability of songbird populations is likely worse than the impact of native, wild predators of birds?
Native predator populations will fluctuate with prey abundance, reducing predation pressure when prey populations become smaller; outdoor house cats maintain a much larger population size than if they relied solely on birds as prey, and their population does not decline regardless of the size of their prey populations due to feeding by owners.
Which of the following observations would be consistent with the hypothesis that badgers engage in prey switching between mice and voles?
Voles have a more stable population size (N) through time when they coexist with mice than in the absence of mice.
Mice have a more stable population size (N) through time when they coexist with voles than in the absence of voles.
Badgers have a more stable population size (N) through time when they coexist with both mice and voles, rather than with only one of the two species.
Elk and bison are both herbivores and engage in exploitative resource competition. Which of the following could be explanations (reasonable hypotheses) as to why both species persist in Yellowstone rather than one of the two species being extirpated due to competitive exclusion.
Both species are kept well below their carrying capacities by predators.
Their fundamental niches do not completely overlap.
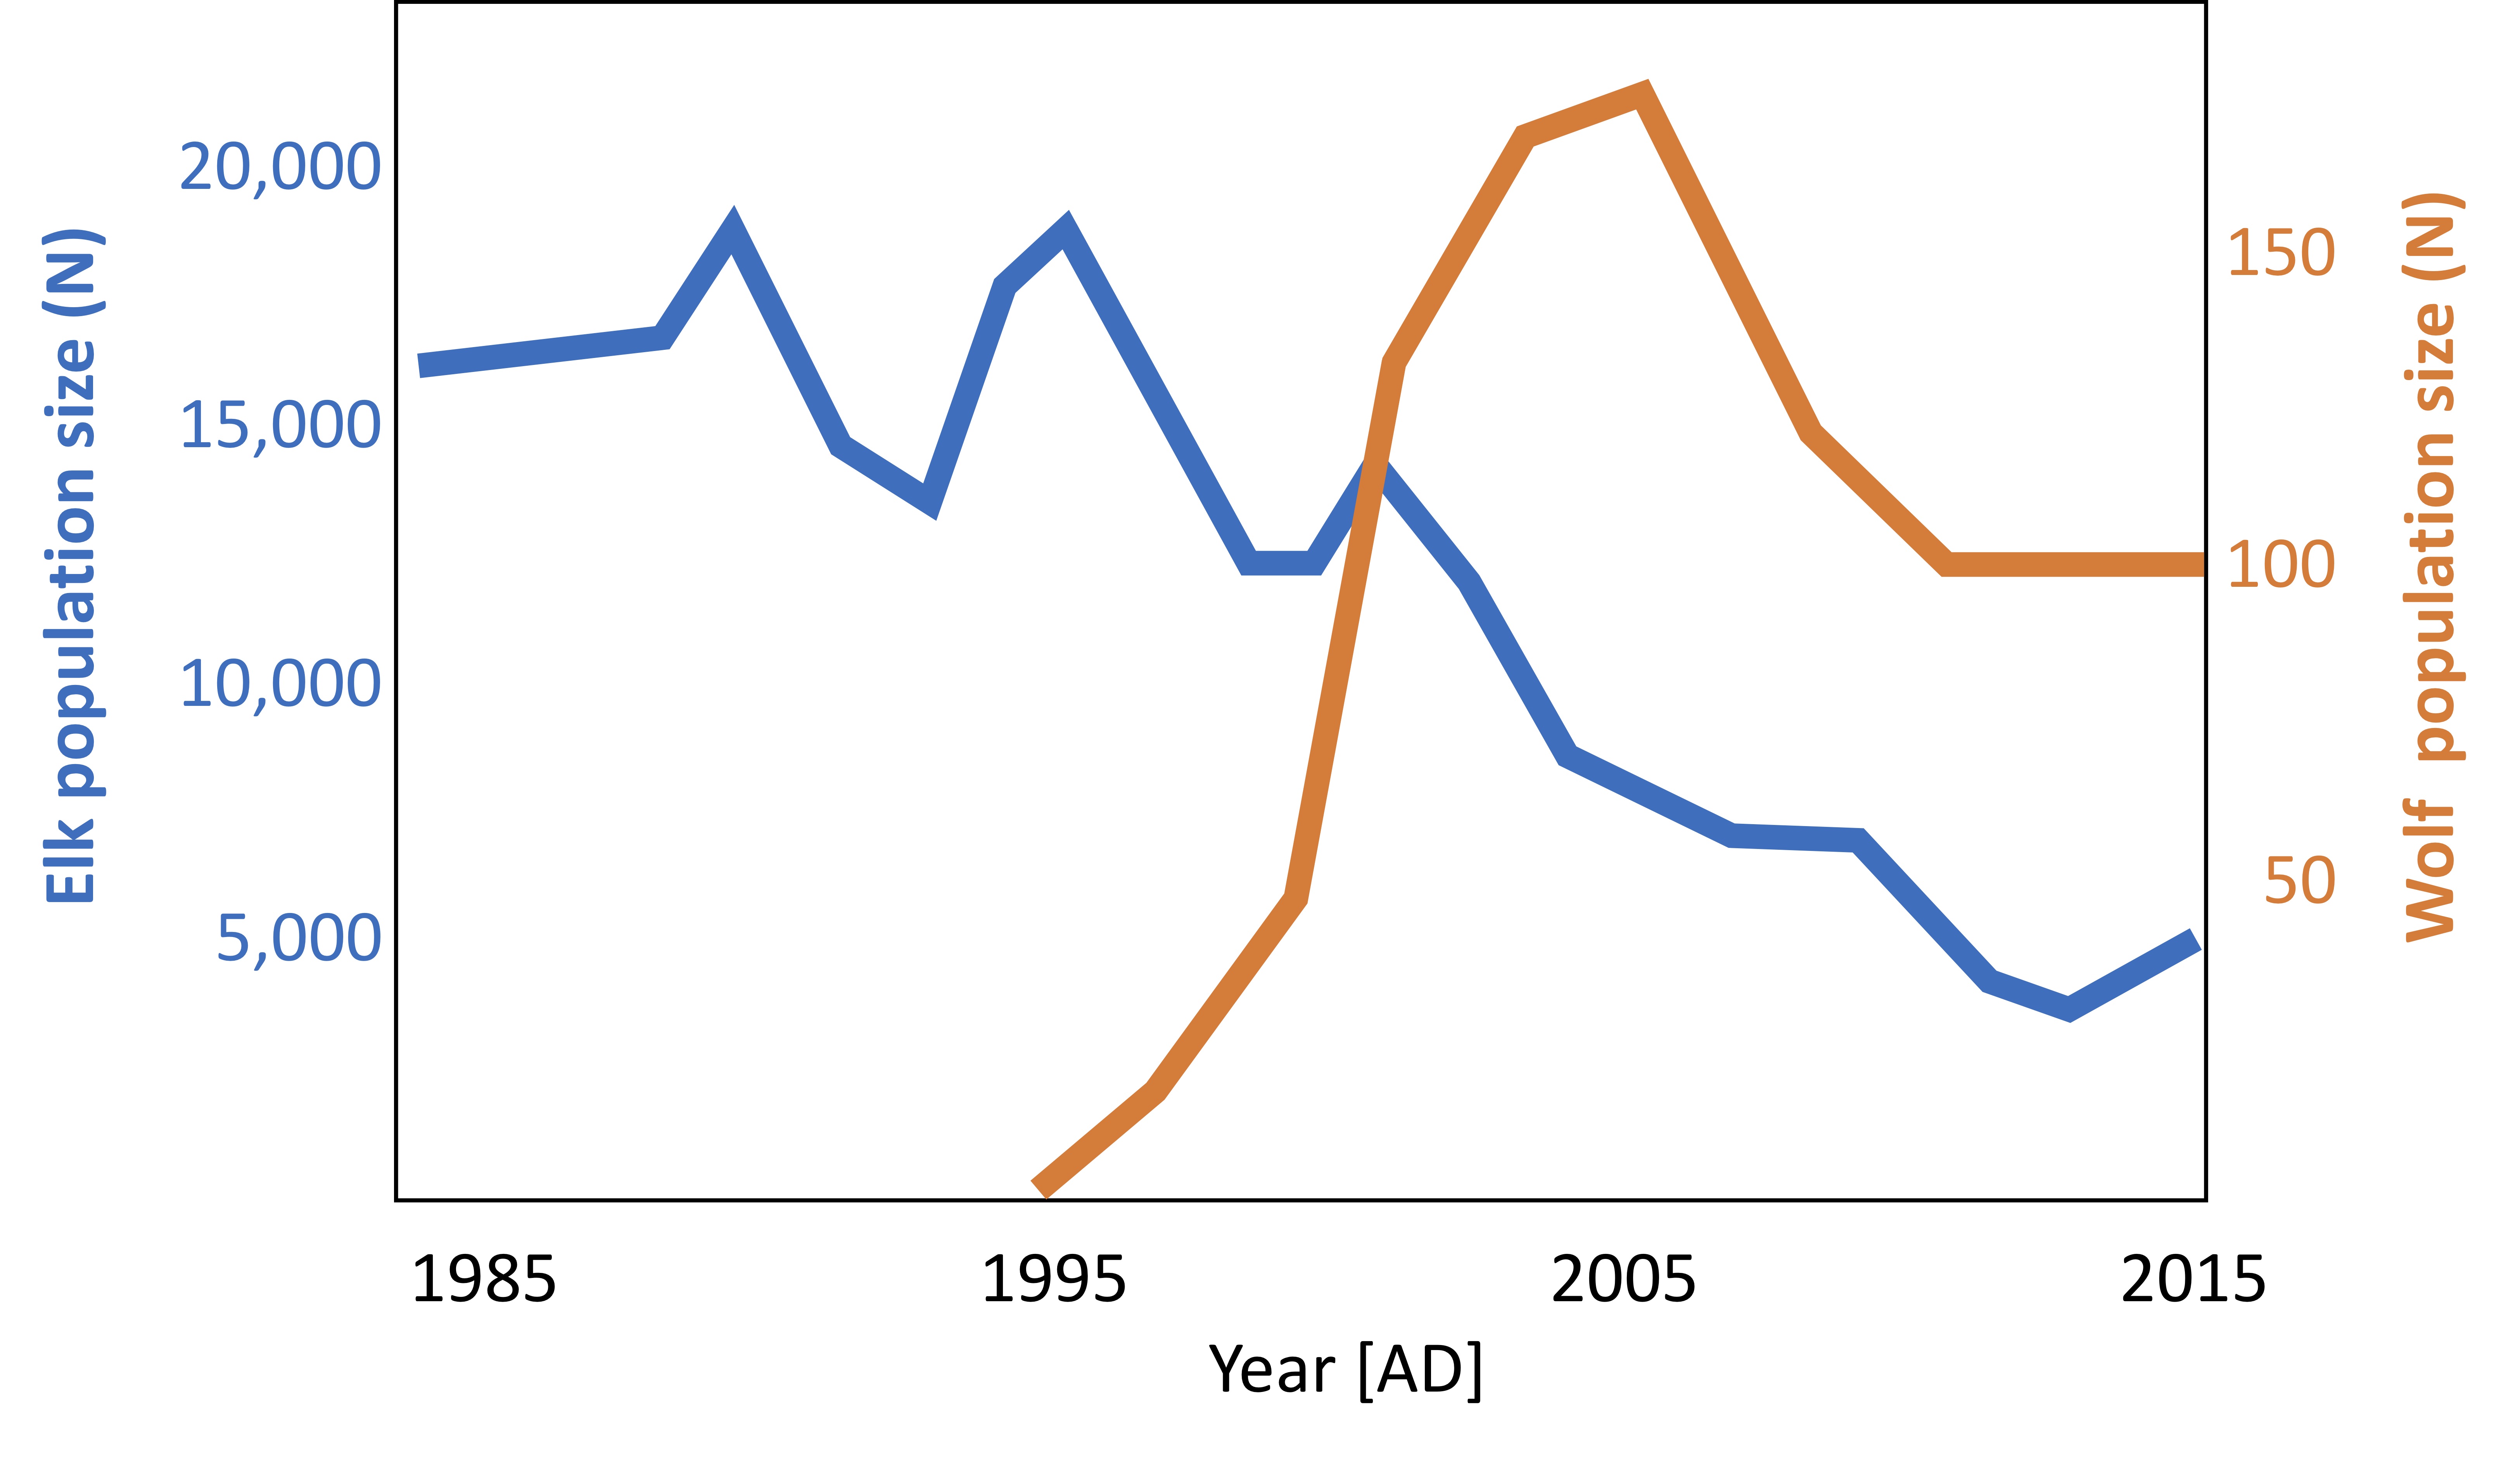
Carefully observe the population growth data for elk and wolves in Yellowstone national park between 1983 and 2015 in the figure above. Wolves were first introduced to the park in 1995, and were entirely absent from the park prior to that year. Assume that elk are by far the most common prey items in the wolves' diet.
Match the correct years or values to each of the statements below based only on the information evident from the graphs above:
years with b > d for wolves → 1995-2005,
years with negative r for wolves → 2005-2010,
years with d = b for wolves → 2010-2015,
carrying capacity of elk in absence of predation → ~15,000,
years with highest r for wolves → 1995-2000,
best time period to estimate rmax for wolves → 1995-2000,
years with lowest K for wolves → 2010-2015,
years with r = 0 for wolves → 2010-2015,
years with d > b for wolves → 2005-2010
How would you designate the interaction between parasitoid and host using the +/- designation of community interactions?
+/-
Several species of braconid and aphelinid wasps have specialized on parasitizing one of the smallest host species of any parasitoid wasp/host relationship: aphids. Since the wasp only feeds and gains biomass during its larval stage which is completed entirely inside the body of a single host individual, this puts significant restrictions on its growth. Which of the following has to be true about braconid and aphelinid wasps and their aphid hosts?
The developing wasp can only grow to reach a lower amount of energy stored in its biomass as produced by the host during the host's growth, because it can maximally consume nearly 100% of the biomass represented by the body of the aphid and convert a fraction of what it consumed into its own biomass.
Match the most likely changes in the food-web that could account for these data
improved effectiveness of the braconid wasp in controlling the aphid population in year 9 → arrival of megaspilid wasps in the soybean field,
reduced effectiveness of the braconid wasp in controlling the aphid population in years 5 & 7 → arrival of cynipid wasps in the soybean field
Based on what you know about predation and competition, under which condition do you expect braconid wasps and aphelinid wasps to stably coexist with each other in the same field?
in the presence of cynipid wasps
How many trophic levels are represented by the food web shown in panel a) of question 8?
5
Most food webs dominated by mammals have 3 or occasionally 4 trophic levels. Compare this observation with the trophic levels you counted in the soybean aphid-parasitoid food web.
How can you explain the difference?
insects have a higher ecological efficiency than mammals