Micro Chapter 12 graphs
1/75
There's no tags or description
Looks like no tags are added yet.
Name | Mastery | Learn | Test | Matching | Spaced |
|---|
No study sessions yet.
76 Terms

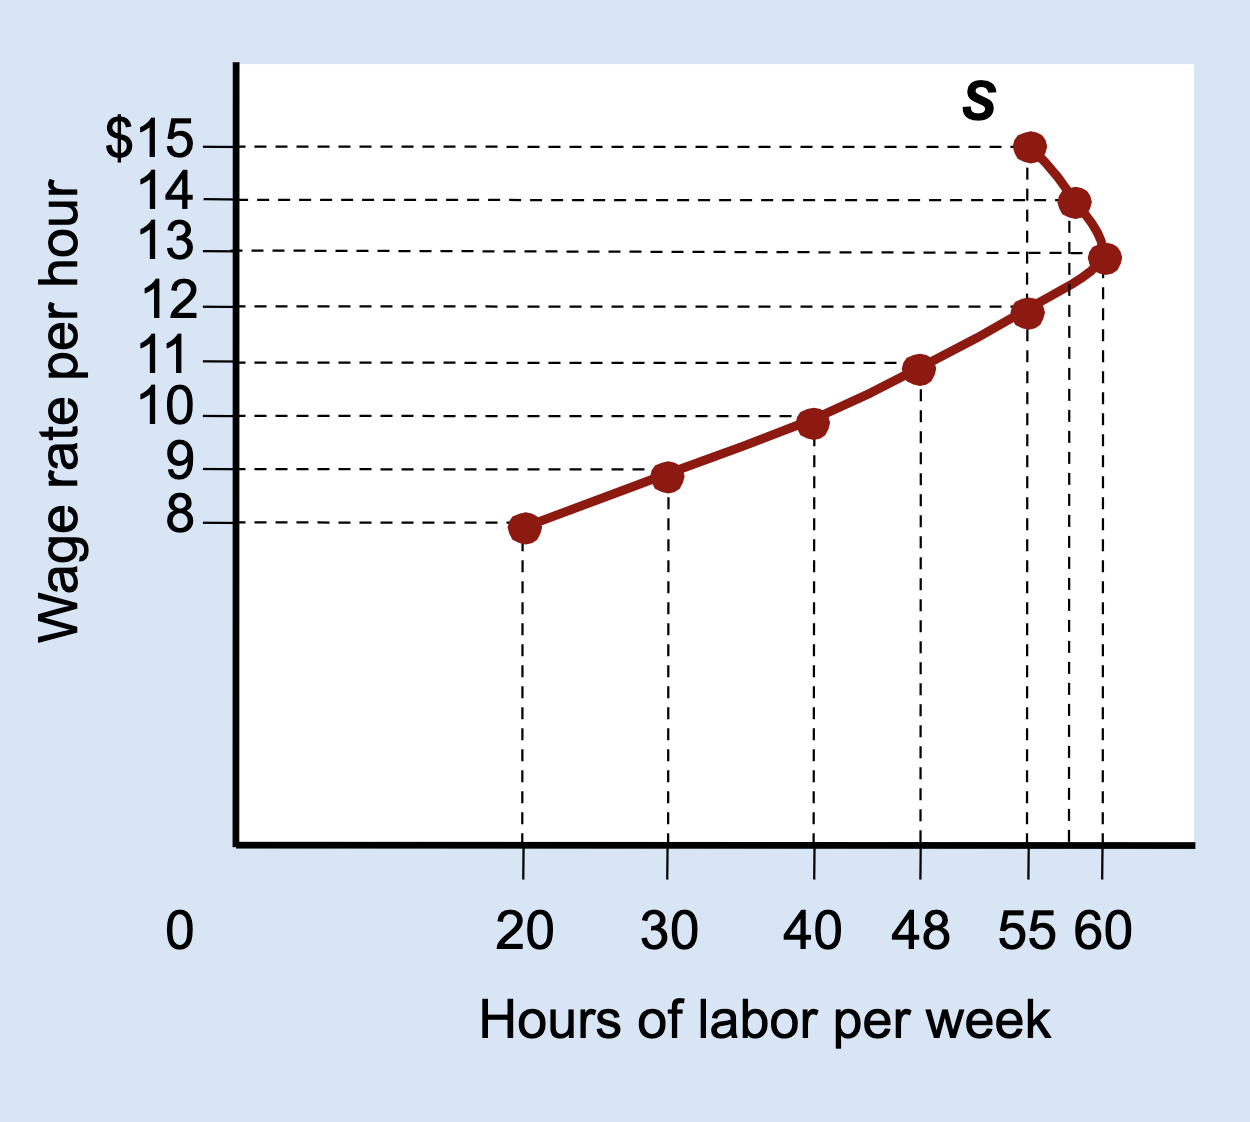
What type of graph is this?
Labor Supply Curve

What does the vertical (Y) axis represent on a labor supply curve?
Wage rate per hour.

What does the horizontal (X) axis represent on a labor supply curve?
Hours of labor per week.

What does each point on a labor supply curve show?
How many hours a person is willing to work at a specific wage.

What is the substitution effect?
When higher wages make work more attractive than leisure, causing people to work more.
What happens to hours worked when the substitution effect dominates?
Hours worked increase as the wage increases.

What is the income effect?
When higher wages allow a person to afford more leisure, causing them to work less.

What happens to hours worked when the income effect dominates?
Hours worked decrease as the wage increases.

What is a backward-bending labor supply curve?
A curve that slopes upward at low wages and bends backward at high wages.

Why does the labor supply curve bend backward?
Because the income effect becomes stronger than the substitution effect.

At lower wages, which effect dominates: income or substitution?
Substitution effect.

At higher wages, which effect dominates: income or substitution?
Income effect.

why might someone work less at very high wages?
They already make enough money and prefer more free time.

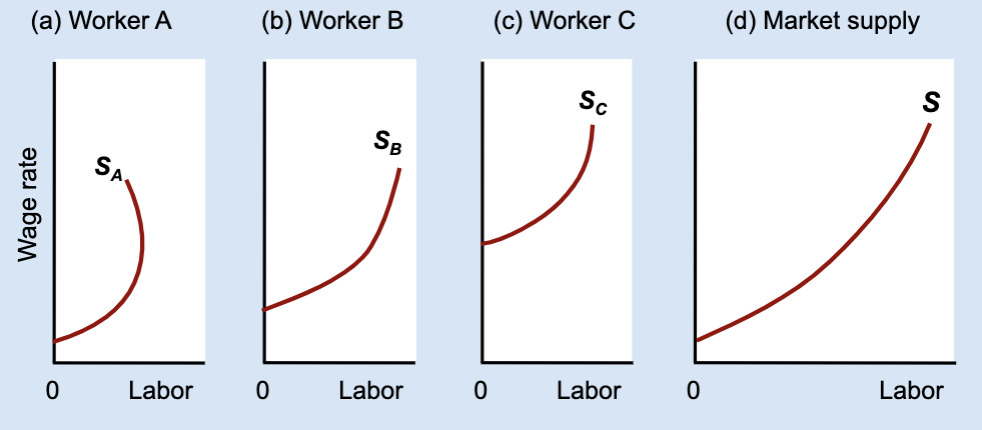
What type of graph is this?
market labor supply curve

What does the market labor supply curve represent?
The total amount of labor supplied by all workers at each wage.

How is the market labor supply curve derived?
By horizontally adding individual labor supply curves.

What does “horizontal addition” mean?
Adding together each worker’s hours at the same wage.

What causes a backward-bending labor supply?
The income effect becoming stronger than the substitution effect.

Why does the market labor supply still slope upward?
Because the increases in labor from some workers outweigh decreases from others.
Can the market labor supply curve bend backward?
Usually no, because most workers supply more labor at higher wages.

What is the relationship between individual labor supply and market labor supply?
The market supply is the sum of all individual labor supplies.

What stays constant when adding labor supply curves horizontally?
The wage rate.

What changes when adding labor supply curves horizontally?
The total quantity of labor supplied.

If one worker works less at higher wages, what might the market still do?
The market can still supply more labor overall.

General idea of Market labor supply curve
found by adding individual labor supply curves and usually slopes upward even if some individuals bend backward.
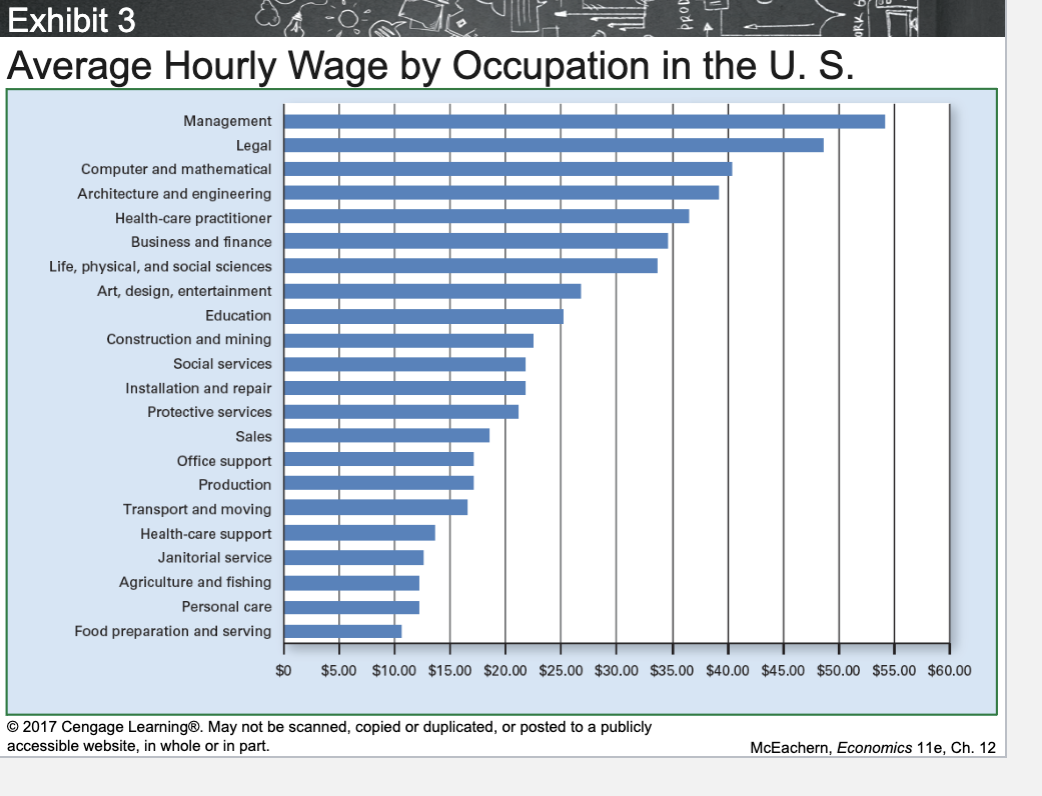
Average Hourly Wage by Occupation in the U.S.
Occupations that require more education, training, or specialized skills tend to earn higher average wages.

Earnings by Education & Age
More education = higher income

Which education level earns the highest income at all ages?
Professional degree.
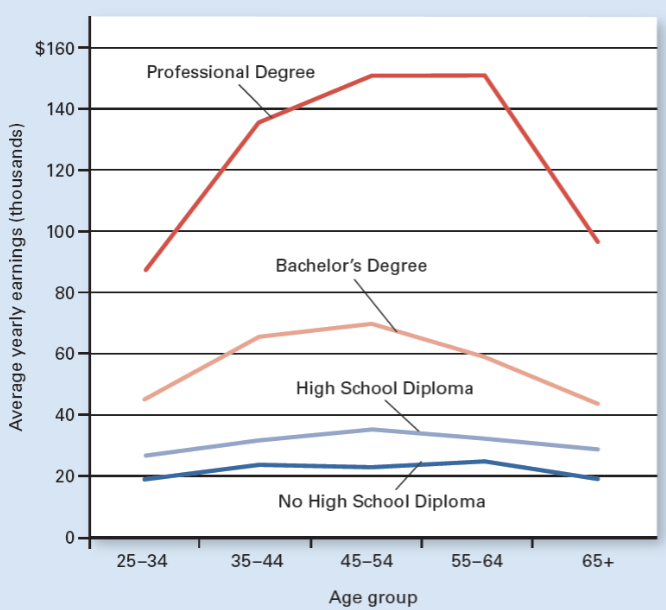
Which education level earns the lowest income at all ages?
No high school diploma.

At what age range do most education groups earn their highest income?
Around ages 45–64.

Why do earnings usually decrease after age 65?
Retirement or reduced work hours.

What type of graph is this?
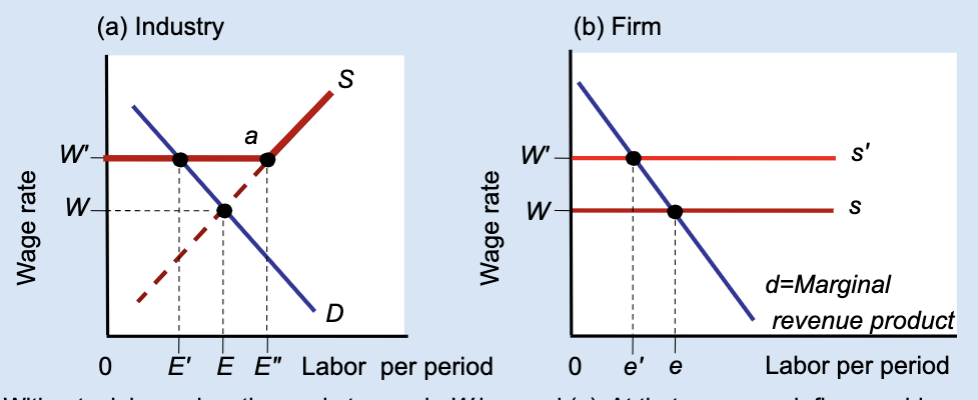
Effects of a Labor Union’s Wage Floor

Effects of a Labor Union’s Wage Floor
A labor union raises wages above the market level, but this causes firms to hire fewer workers, creating unemployment.

What is a wage floor?
A minimum wage set above the market equilibrium.

What wage does the market set without a union?
Wage W.

What wage does a union negotiate?
A higher wage, W’.

At wage W, what is total employment in the industry?
E.

At wage W’, how much labor do firms demand?
A smaller amount, E’.

At wage W’, how much labor do workers supply?
A larger amount, E’’.

What does E’’ – E’ represent?
Unemployment created by the union wage.

Why do firms hire fewer workers when wages rise?
Because labor becomes more expensive.

What does the firm hire labor up to?
Where marginal revenue product equals the wage.

What happens to a firm’s employment when a union raises wages?
Employment decreases from e to e’.
Who benefits from the union wage floor?
Workers who keep their jobs.

Does a union wage floor increase or decrease employment?
It decreases employment.

Does a union wage floor create surplus or shortage of labor?
Surplus of labor (unemployment).

What type of graph is this
Union vs. Nonunion Weekly Earnings
Union vs. Nonunion Weekly Earnings Main idea
Union workers earn more than nonunion workers in almost every industry because they negotiate.
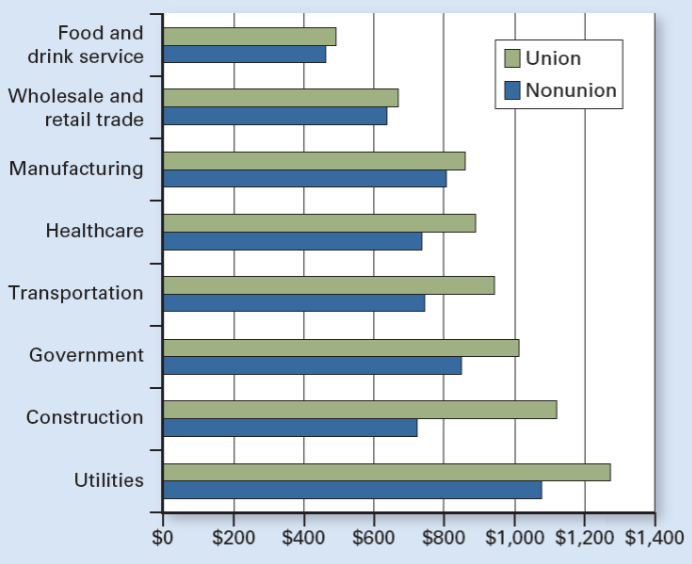
In which types of industries are unions most successful at raising wages?
Less competitive industries (e.g., government, utilities, transportation).

Why are unions more successful in less competitive industries?
Firms can pass higher labor costs to consumers without losing many customers.
In which industries is the union wage advantage smallest?
Highly competitive industries like food & drink service, retail, and manufacturing.
Why are unions less successful in competitive markets?
Firms cannot easily raise prices to cover higher wages.
What happens in competitive industries when wages rise too much?
Firms lose customers and may cut jobs or close.
True or False: Unions raise wages equally in all industries.
False — the effect varies by how competitive the market is.
What industries show the largest union vs. nonunion pay gap?
Government, utilities, construction, transportation.
What can happen if a union raises wages too high in a competitive industry?
Nonunion firms enter and steal customers with lower prices.

What type of graph is this?
Effect of Reducing Labor Supply or Increasing Labor Demand
Effect of Reducing Labor Supply or Increasing Labor Demand
Unions can raise wages either by restricting labor supply (which reduces jobs) or by increasing labor demand (which raises both wages and employment).

What does Panel (a) show?
The effect of reducing labor supply.

What does Panel (b) show?
The effect of increasing labor demand.
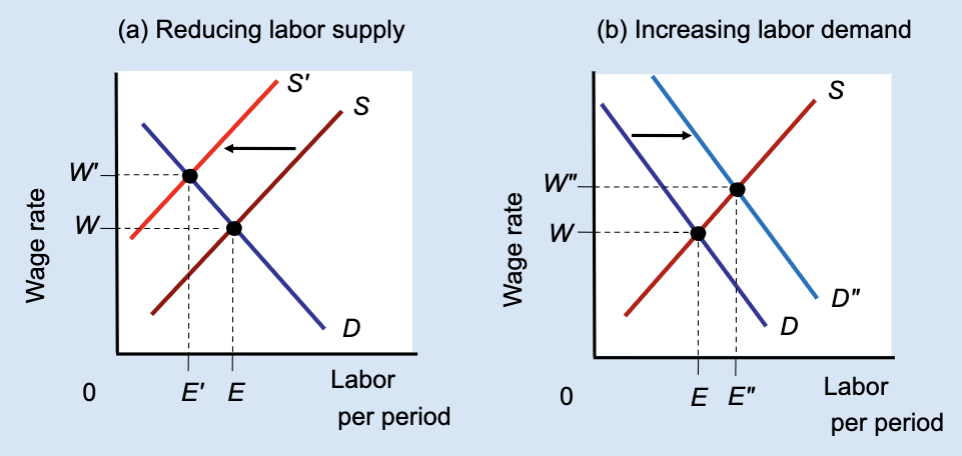
In Panel (a), what happens to labor supply?
It shifts left from S to Sʹ.

In Panel (a), what happens to the wage?
The wage rises from W to Wʹ.

In Panel (a), what happens to employment?
Employment falls from E to Eʹ.

Why does employment fall in Panel (a)?
Because fewer workers are allowed into the market.

In Panel (b), what happens to labor demand?
It shifts right from D to Dʺ.

In Panel (b), what happens to the wage?
The wage rises from W to Wʹ.

In Panel (b), what happens to employment?
Employment rises from E to Eʺ.

Which method raises both wages and employment?
Increasing labor demand.

Which method raises wages but reduces employment?
Restricting labor supply.

True or False: All wage increases lead to job losses.
False — wages can rise with employment if demand increases.
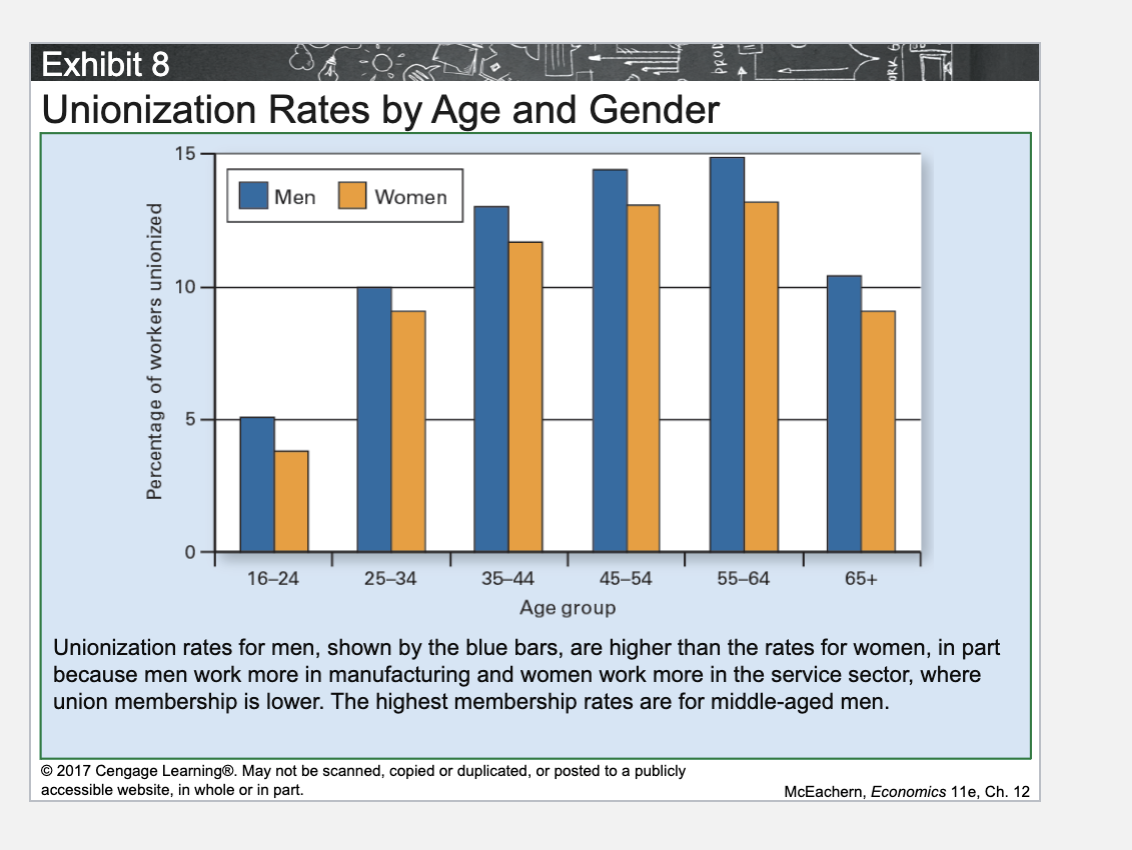
Unionization Rates by Age and Gender
Union membership is highest among middle-aged workers and is consistently higher for men than for women, largely because of differences in the industries they work in.

What is a Right-to-Work state?
A state where workers cannot be required to join a union or pay union dues.
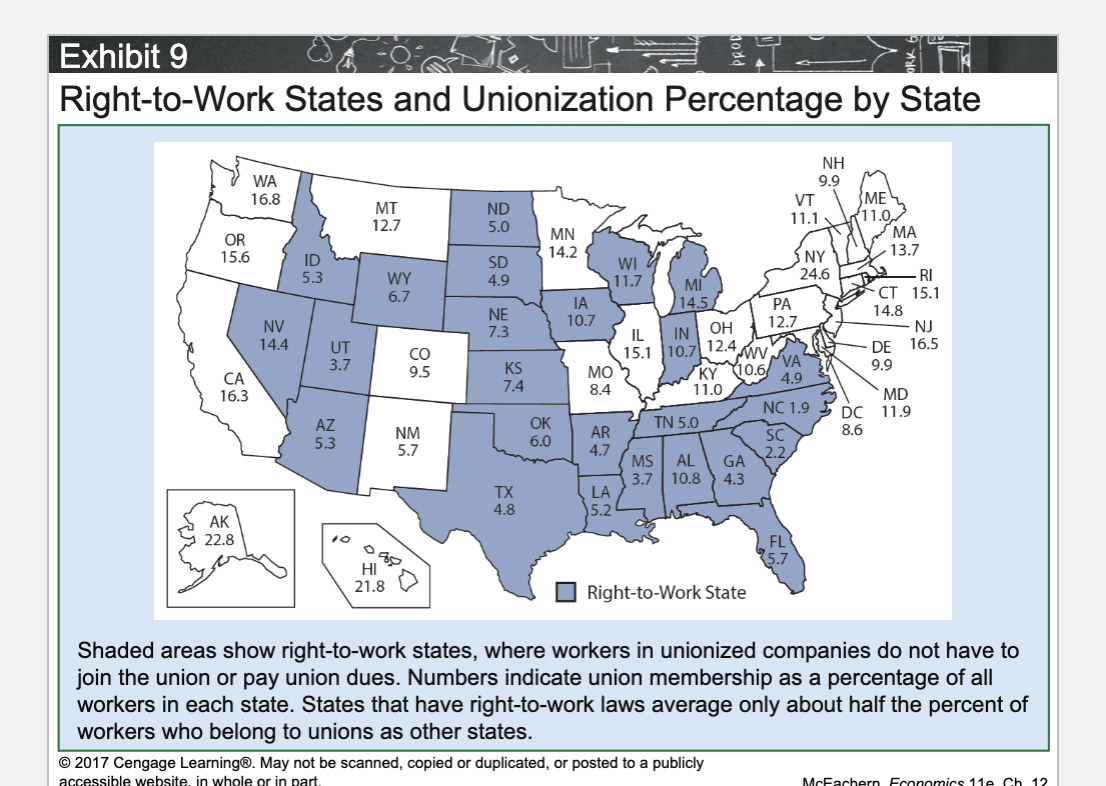
Do Right-to-Work states have higher or lower union membership rates?
Lower.

How much lower are union membership rates in Right-to-Work states?
About half the rate of non–Right-to-Work states.

Why do Right-to-Work states have lower union membership?
Workers do not have to join or pay dues, weakening unions.

What is the main effect of Right-to-Work laws on unions?
They weaken union bargaining power.