AT Geo Unit 1
 Call Kai
 Learn
Learn Practice Test
 Spaced Repetition
 Match
Match Flashcards
 Knowt Play
1/57

There's no tags or description
Looks like no tags are added yet.
Name | Mastery | Learn | Test | Matching | Spaced | Call with Kai | Chat |
|---|
No analytics yet
Send a link to your students to track their progress
58 Terms
Absolute distance
Exact, measurable space between 2 spaces (e.g. miles, km)
Relative distance
How far apart places are in time, cost, etc
Absolute direction
Cardinal directions (North, east, south, west)
Relative direction
Based on context/perspective (turn left, head up)
Reference maps
Show locations, boundaries, geographic features
Thematic maps
Maps that focus on spatial patterns by using qualitative data to display topics/themes
Chloropleth
Shades of colours to show values of something → good for seeing patterns across regions, difficult to show variations within a region

Dot distribution map
Dot = set number of units
Best for - where something happens
Limitations - hard to read

Graduated symbol map
Uses symbols of different sizes to represent amounts and volumes
Best use: exact quantities, specific locations
Limitation: overlapping symbols

Isoline map
Continuous lines to connect points of equal value
Best use: continuous data, gradual changes (e.g. weather)
Limitation: can be hard to read

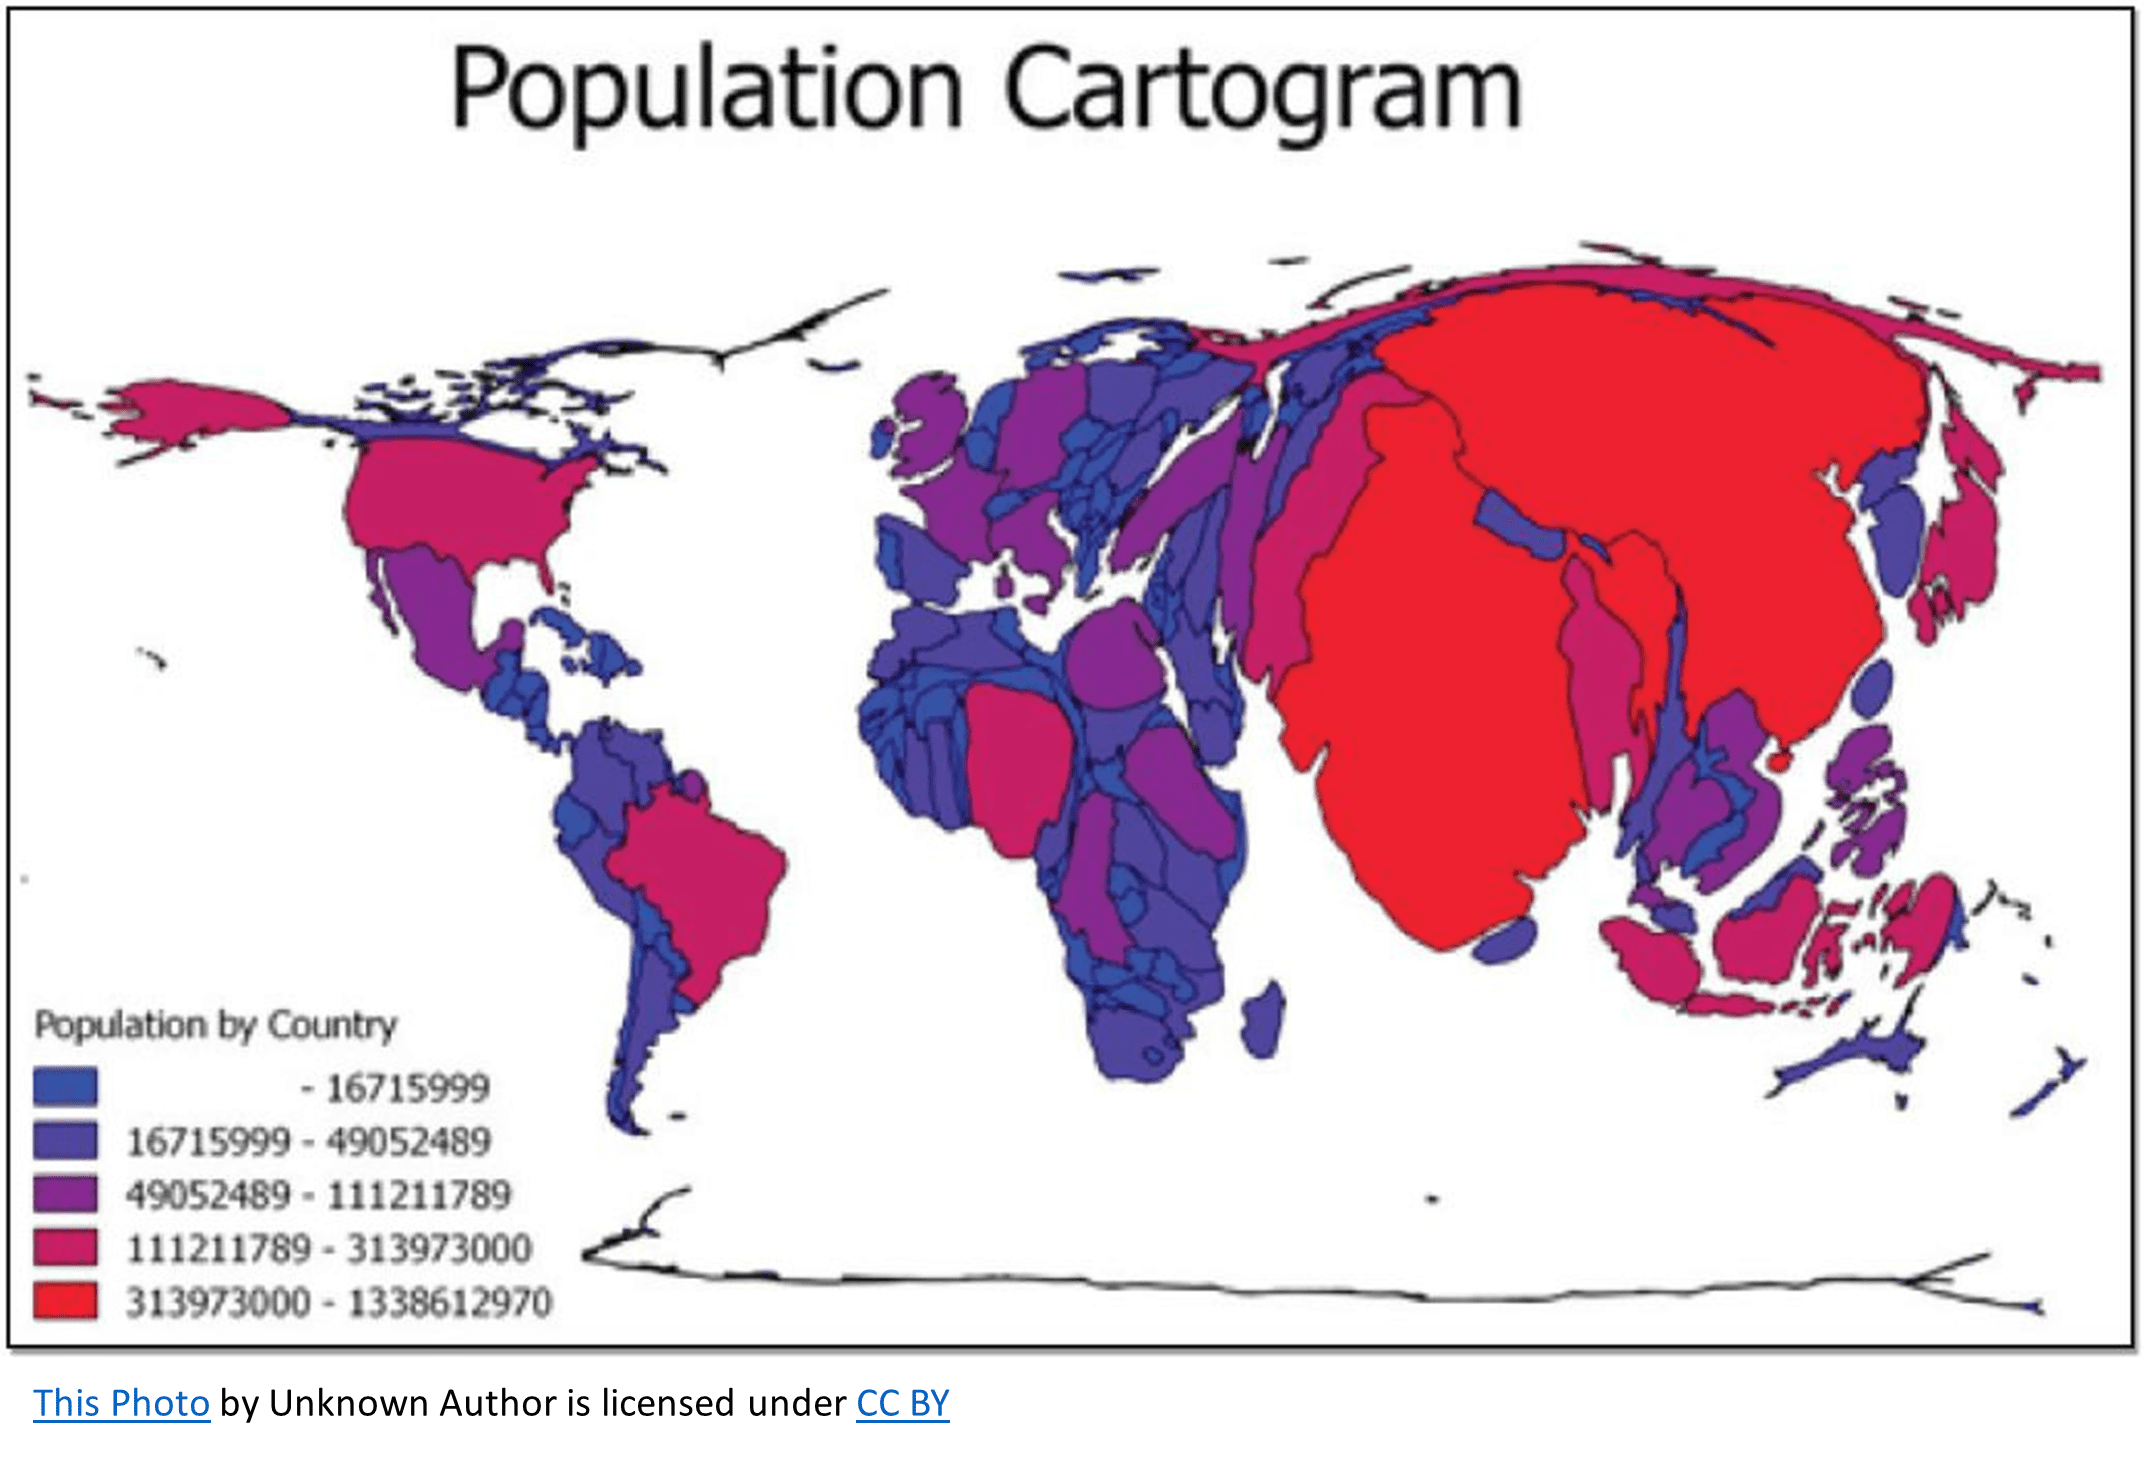
Cartogram
Distortions of size to represent volume/quantity
Best uses: population, economy
Limitation: distort geography
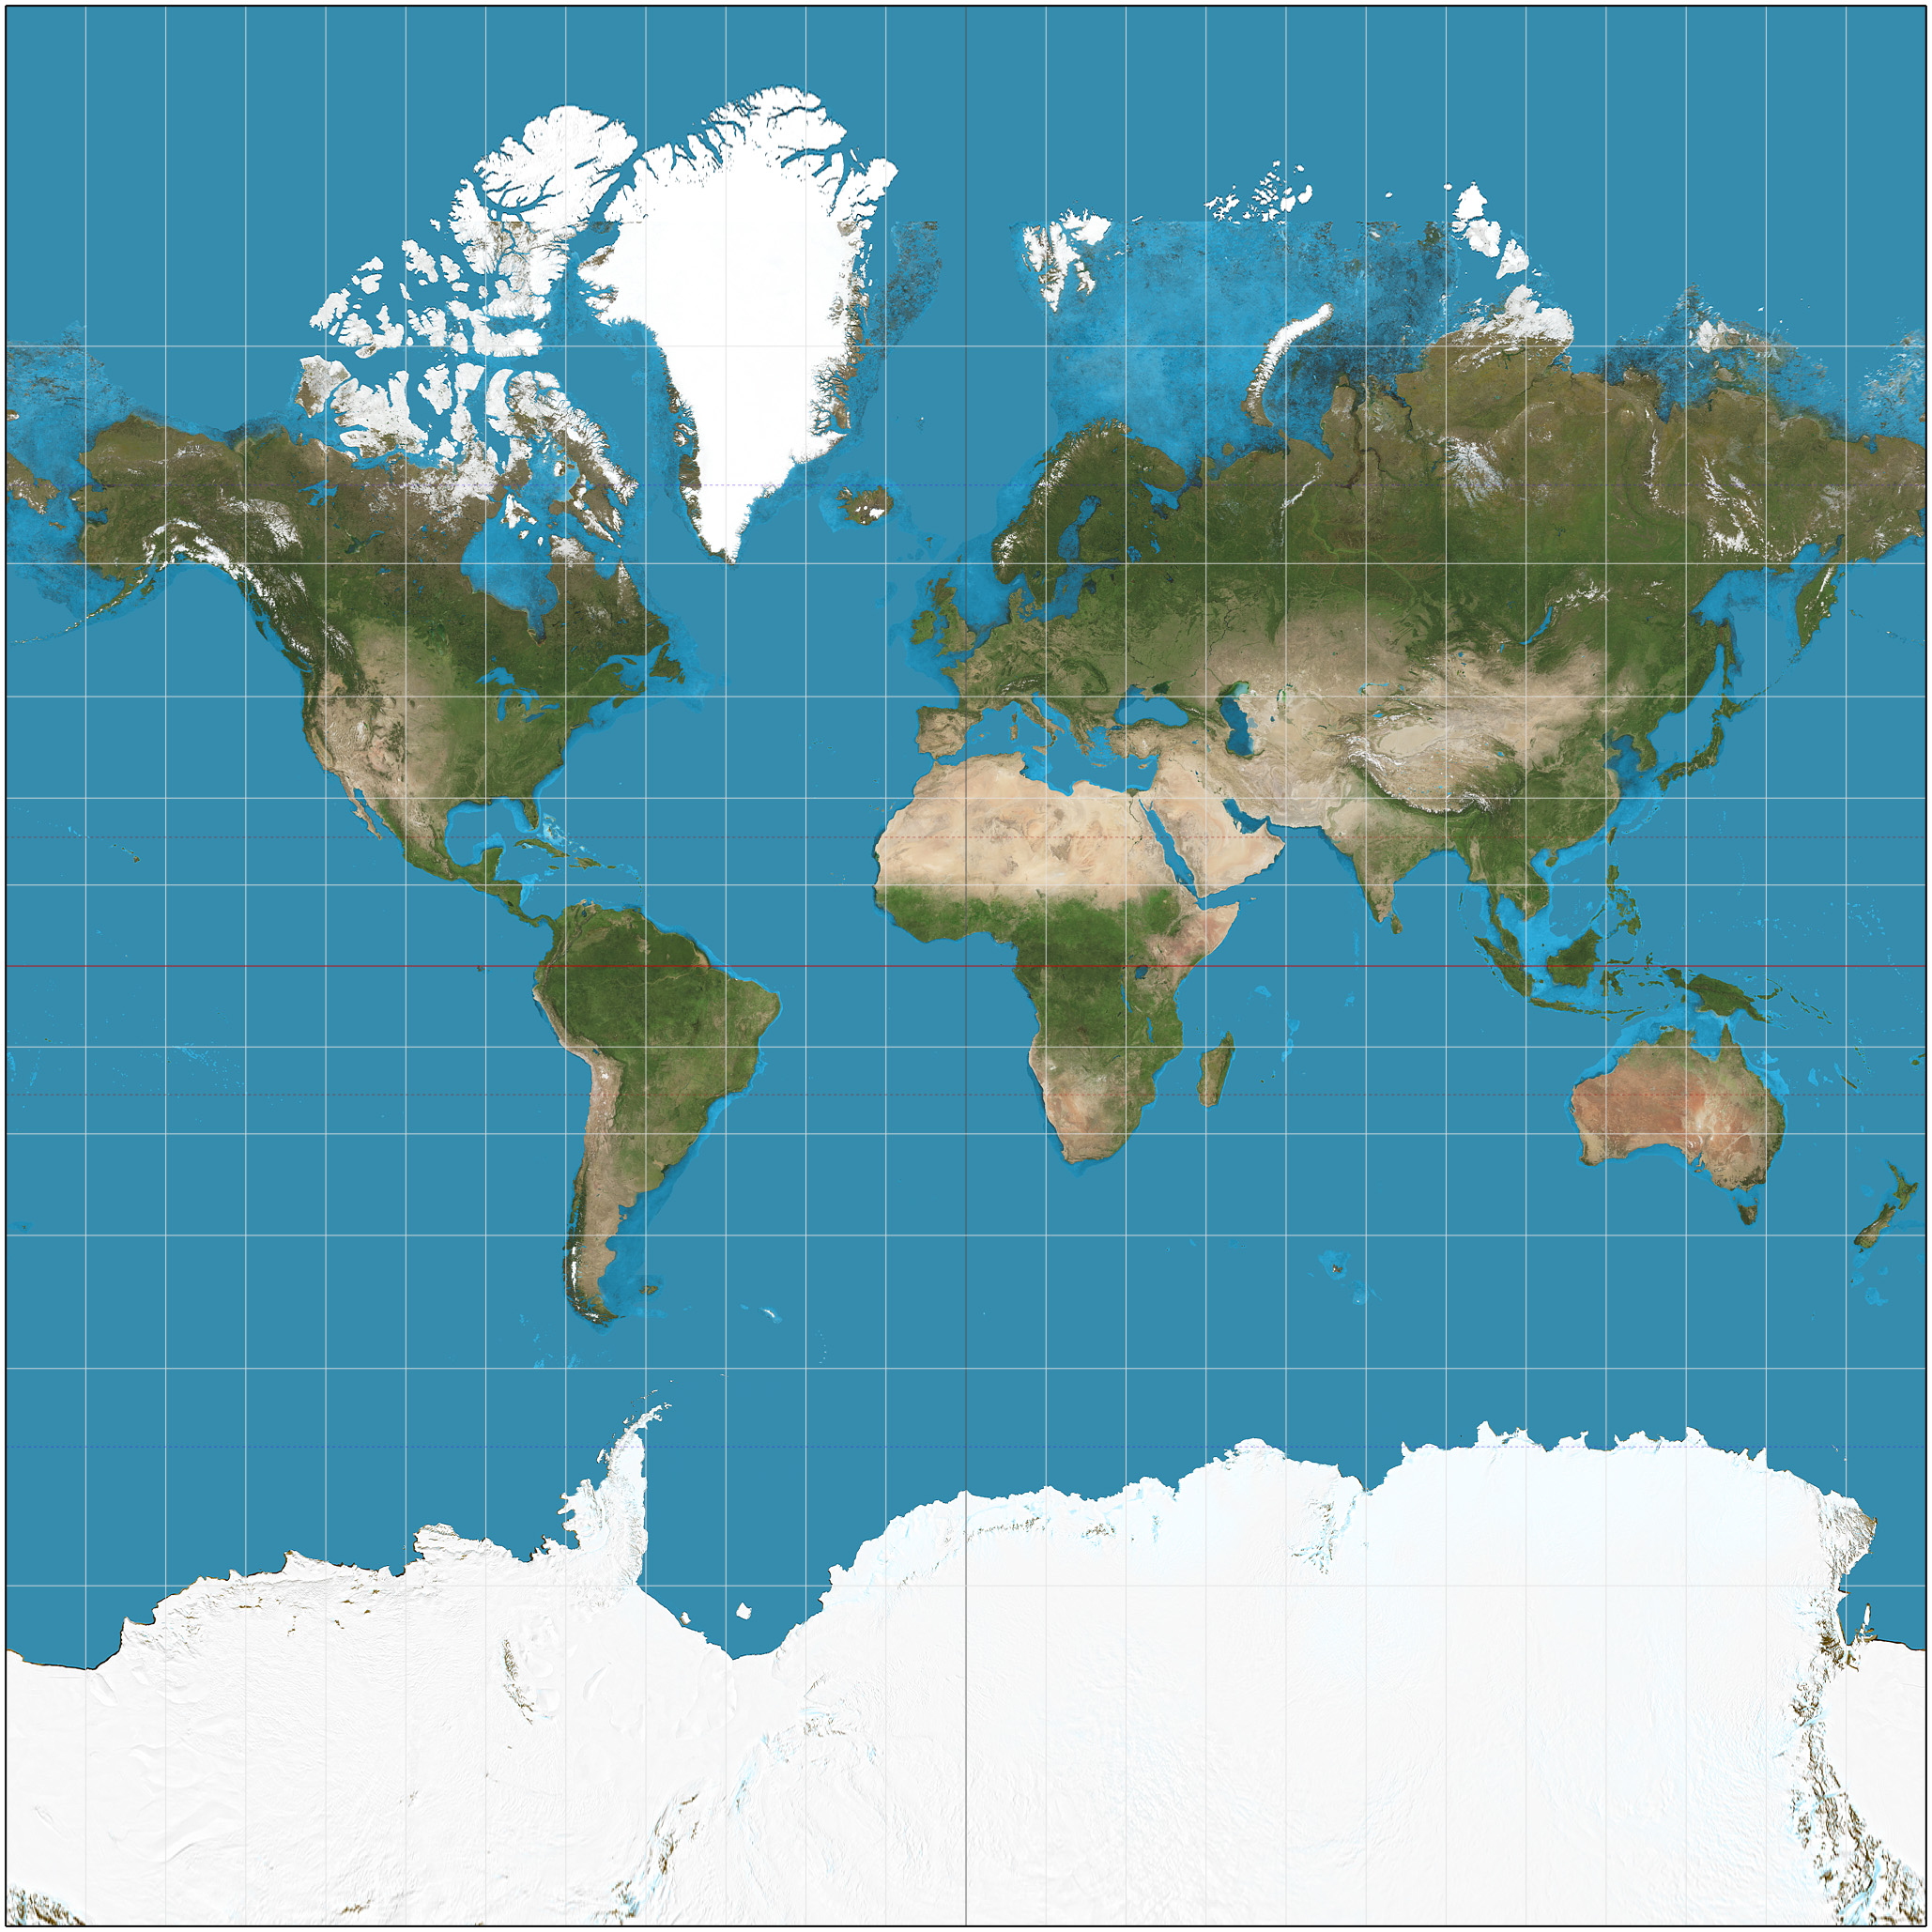
Mercator projection
Preserves direction + angles, useful for navigation
Size near poles is distorted (Greenland same size as Africa despite being 14x smaller)
Gall-Peters Projection
Correct relative land area of countries, shapes are distorted

Robinson Projection
Balances distortion of shape, size, distance, and direction → more realistic view of Earth
Visually appealing, balanced distortions, useful for general patterns

Azimuthal (Polar) Projection
North pole at center → shows direction and distance from one point, helping with air travel paths
Cons: unfamiliar positioning, not useful for southern hemisphere

Goode’s Homolosine Projection
Preserves size and shape of continents, but interrupts ocean (no use for navigation etc)

Region
Area defined by a characteristic that unifies it
Formal region
An area where everyone shares a measurable trait → clearly defined boundaries, based on facts/data, uniform throughout region
Functional region
Organized around a central node, connected by pattern of activity (gets weaker further from center) → distance decay
Distance decay
strength of connection decays as distance increases (less likely to interact when things are further away)
Vernacular/Perceptual Regions
Area that people believe exists (varies by person) based on identity, culture, attitudes → e.g. midwest, the south
Transitional boundaries
One region fades into another
Contested boundary
People disagree about the boundary
Overlapping region
A place that belongs to multiple regions at once
Map scales
Ratio between distance on a map + real world distance, more zoomed in = road detail, zoomed out is physical detail
Scale of analysis
The level at which patterns are analyzed
Global (scale of analysis)
Patterns/trends across the world (e.g. malaria per country)
Regional scale of analysis
Comparing patterns and trends in areas that are similar, for example north america
National scale of analysis
Patterns within a single country
Local scale of analysis
Smaller geographic areas → human behaviour, infrastructure, ideal for targeted solutions
Impact of changing scale of analysis
Changes the data you see and interpretation
Qualitative data
descriptions, observations, experiences
Quantitative data
Numbers, measurable info
US Census
National survey every 10 years, collects # of people, where they live, population etc
GIS
computer system that captures, stores, and analyzes spatial data → patterns
e.g. demographics, population, existing hospitals when looking for new hospital location
GPS
Global positioning system → determining exact location w/ satellites
Remote sensing
Collecting info w/out making physical contact
Absolute location
exact position on earth (e.g. 40 woodlands street 41), coordinates, addresses
Relative location
Location in relation to landmarks/position → two blocks north
Place
A point on Earth that people give meaning to
Site
Physical characteristics, natural conditions (e.g. new orleans is soft, swampy, soil below sea level)
Situation
Location in relation → new orleans is near mississippi river
Space
physical area between objects on earth’s surface
Clustered
Close together (Spatial distribution)
Dispersed
spread out (spatial distributions)
Random
No clear pattern (spatial distributions)
Flow
movement of people, things, and ideas between places
Time-space compression
Technology makes it easier to connect w/ others → people feel closer
Sustainability
Using earth’s resources without compromising future generations
Natural resources
materials from the earth used to meet human needs
Renewable resources
replenish naturally in a short amount of time
Nonrenewable resources
Do not replenish naturally or easily
Land use
how people modify land to meet needs
Human impact in the everglades
Urban development + agriculture have destroyed more than half of the everglades
Vertical farming in SG
Being intentional about space usage + environment to meet sg food needs, unlike everglades which resulted in environmental damage
Environmental determinism
Environment shaped human development → climate landforms impact societies and growth
Huntington map
Anglocentrism → NA + Western Europe has most favorable climate
Environmental possiblism
Environment sets limits, but these limits can be overcome w tech