(L7, 8) IMED2003 - Validity and Reliability of measures and diagnostic tests
 Call Kai
 Learn
Learn Practice Test
 Spaced Repetition
 Match
Match Flashcards
 Knowt Play
1/87

There's no tags or description
Looks like no tags are added yet.
88 Terms
What are the five learning goals of the lecture on validity, reliability and diagnostic tests?
1. Recognise the main types of measures used in health research.
2. Describe the main types of validity and reliability, including their relationship.
3. Explain basic statistical measures of diagnostic and screening tests, including sensitivity and specificity.
4. Calculate sensitivity, specificity, positive and negative predictive values, and positive and negative likelihood ratios.
5. Discuss how these measures are applied to patient care.
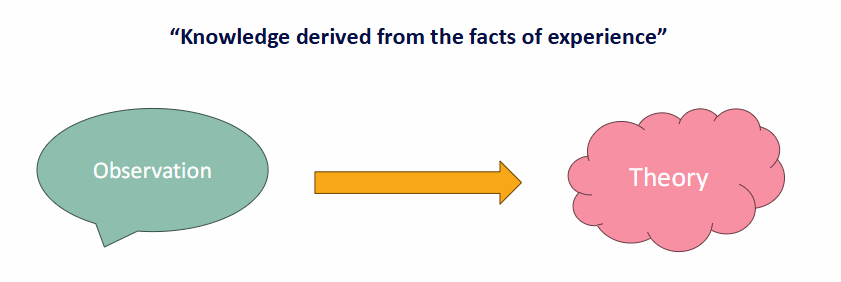
Why are valid and reliable measurements fundamental to science?
Science is based on observations that can be tested and subjected to validation by others.
An observation can contribute to science when it can be straightforwardly tested by the senses and withstand those tests.
Reliable observations plus sound reasoning should allow different people to reach compatible conclusions.
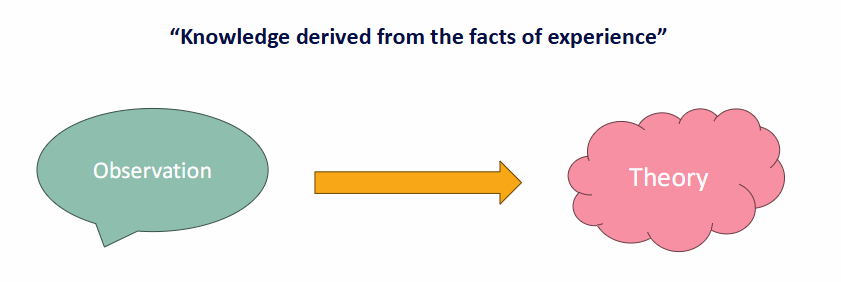

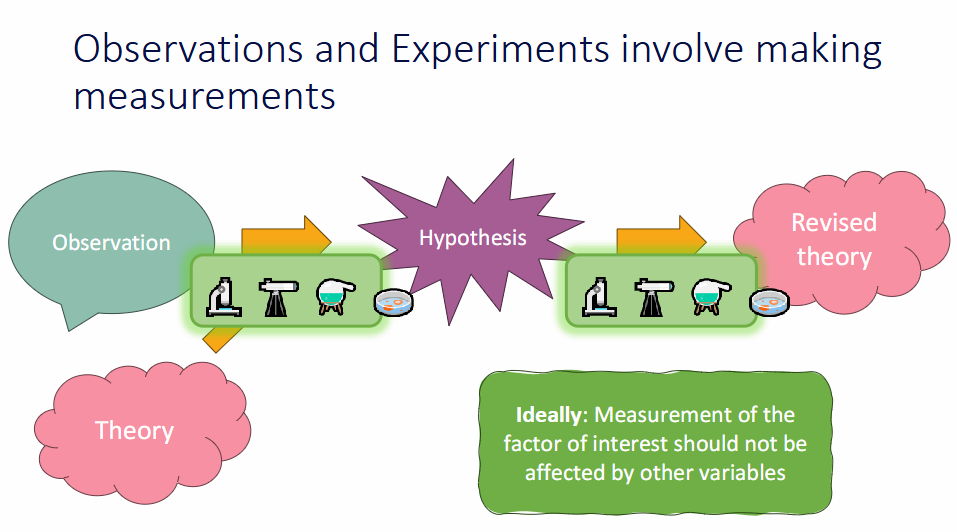
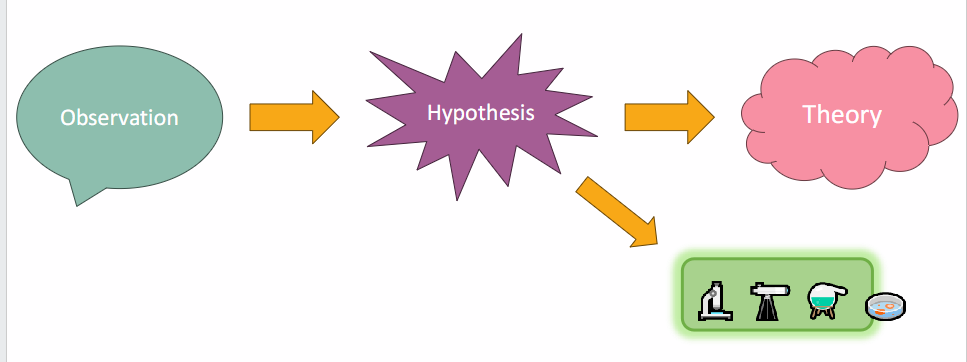
How do observations, hypotheses, experiments and theory interact?
1. Observations and existing theory suggest possible explanations: hypotheses.
2. Experiments test those hypotheses.
3. The resulting observations determine whether theory is retained, revised or improved.
What do validity, reliability and reproducibility mean in experimental design?
Validity:
Do the measurement or conclusion align with the real world?
.
Reliability:
If the same experiment or measurement is repeated, is a similar result obtained?
.
Reproducibility:
If another person follows the same methods, do they obtain similar results?
Good experimental design also removes or accounts for confounding variables.
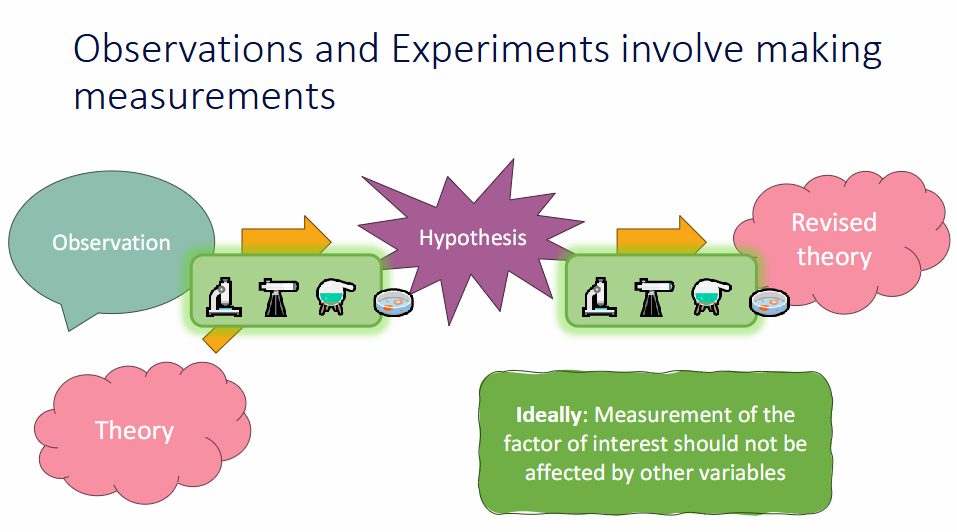
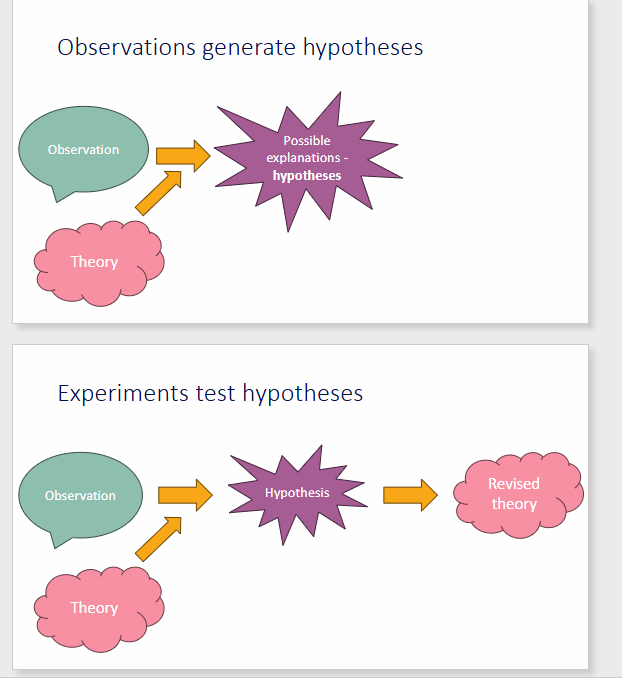
Why does measurement quality affect both hypothesis generation and hypothesis testing?
Observations and experiments both depend on measurements.
Poor measurements can therefore distort:
- The observations used to generate hypotheses.
- The results used to test hypotheses.
- The conclusions used to revise theory.
Ideally, measurement of the factor of interest should not be affected by other variables.

What factors can affect the value of a measurement?
- The true value of the quantity being measured.
- Biological variation.
- The measurement instrument.
- The subject's condition.
- The skill, experience and expectations of the observer.
- The relationship between observer and subject.
Lecturer explanation:
Some factors, such as biological variation, cannot be removed. Others can be controlled or standardised to reduce bias.

What kinds of instruments can be used to make biomedical measurements?
An instrument can be:
- A technical device, such as a mass spectrometer or blood-pressure device.
- A structured tool, such as a questionnaire, pain score or other rating scale.
Lecturer explanation:
Researchers should minimise and standardise controllable features of the instrument and its use.

How can qualitative research contribute to measurement development?
Qualitative research can help when the construct is subjective and not directly observable, such as pain.
Researchers can ask people about their experiences to:
- Generate hypotheses.
- Better define the underlying construct.
- Develop measurement tools that correspond more closely with reality.

What are the four main types of measures used in health research?
1. Self-report measures:
- Questionnaires
- Interviews
.
2. Tests:
- Aptitude
- Achievement
.
3. Behavioural measures:
- Behaviours observed and recorded by an observer
.
4. Physical measures:
- Specialised "objective" equipment

What examples did the lecturer give for the main types of health-research measures?
Self-report:
Questionnaires and interviews.
.
Tests:
Aptitude and achievement tests.
.
Behavioural:
Observation of gait or other behaviours; relevant even in biomedical disease research such as muscular dystrophy.
.
Physical:
Grip strength, blood pressure and similar measurements using specialised equipment.

What study details were shown in the Lancet questionnaire example?
Study:
"Factors associated with outpatient experience of Chinese public hospitals: a cross-sectional study."
Sample:
- Six comprehensive public hospitals in Hubei, China.
- Three tertiary and three secondary hospitals.
- 100 outpatients invited from each hospital after completing their visit.
Participant inclusion:
1. Age ≥18 years.
2. Visit procedure completed.
3. Able to describe their experience accurately.
Questionnaire:
- Five-point Likert scale.
- Converted to a 0-100 score:
5 = 100
4 = 75
3 = 50
2 = 25
1 = 0
- 100 = best experience; 0 = worst experience.


What reliability and validity claim was made in the Lancet questionnaire example, and what statistic supported it?
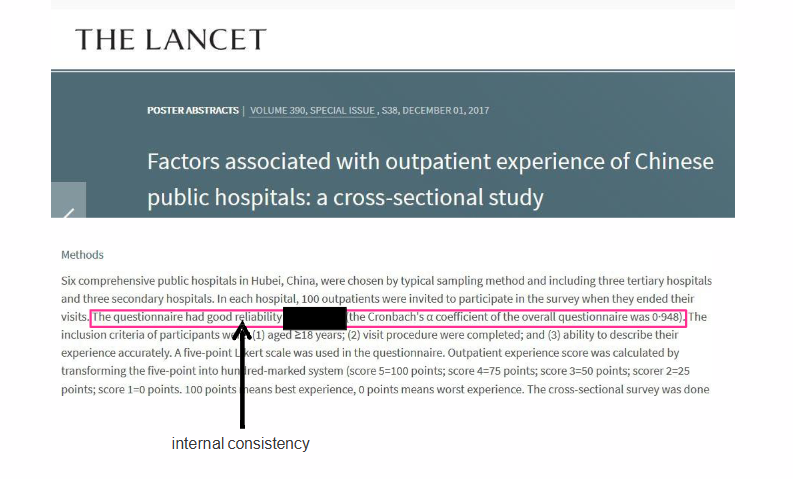
The article stated that the questionnaire had "good reliability and validity."
Cronbach's α for the overall questionnaire was 0.948.
Lecturer explanation:
Cronbach's alpha specifically assesses internal consistency, so it supports a claim about reliability but does not, by itself, establish validity.

What is reliability?
Reliability is the consistency of a measure.
Different forms of reliability are appropriate in different measurement contexts.
.
Main types:
- Test/retest reliability
- Alternate-forms reliability
- Split-half reliability
- Inter-rater reliability
- Inter-item reliability
What is test/retest reliability?
It assesses the stability of a test over time.
The same test is administered on two different occasions and the scores are compared.
Good test/retest reliability means the scores remain consistent when the underlying construct has not changed.
What problems can affect test/retest reliability?
Practice effects:
People may perform better the second time simply because they have already completed the test.
Testing interval:
- Too short: people may remember previous answers.
- Then memory, not test stability, is being measured.
- This can create a spuriously high correlation.
A longer interval may reduce recall, but the interval must still be appropriate to the construct.
How did the lecturer distinguish biological and psychological examples of test/retest reliability?
Biological example:
An oral glucose tolerance test can be repeated on different days to see whether an underlying impairment produces a similar result.
Psychological example:
Repeating a spatial-reasoning test too soon may improve performance through memory or practice rather than a true change in spatial reasoning.
What is alternate-forms reliability?
It assesses:
- Stability of the construct over time.
- Equivalence of items across two different but supposedly equivalent tests.
.
Scores from the two forms are compared.
If both tests measure the same construct equivalently, results should be similar.
.
kind of like a deferred test for someone who misses the normal school test
What are the main problems with alternate-forms reliability?
The two tests must genuinely be equivalent, including:
- Equal difficulty.
- Comparable instructions.
- Comparable content and administration.
Lecturer explanation:
Two tests may measure the same construct but appear inconsistent simply because one is harder. Producing truly equivalent tests is difficult.
What is split-half reliability?
It assesses equivalence within one test.
Scores from one half of the measure are compared with scores from the other half
.
Recommended approach:
Compare odd-numbered item scores with even-numbered item scores.
It assesses content equivalence but not stability over time.
What practical example did the lecturer give for split-half reliability?
The lecturer referred to the K10 psychological-distress scale as an example where internal equivalence can be examined.
She also explained that questionnaire scores can have practical consequences, such as triaging people or supporting access to subsidised mental-health services.
What is inter-rater reliability?
Inter-rater reliability assesses agreement between two or more raters or judges using the same assessment tool.
.
Examples:
- Two observers independently recording children's play behaviours.
- Comparing answers obtained by self-administered survey with the same questions asked in an interview.
.
Problem:
Raters may agree by chance.
Why should a reliable observer-based assessment produce similar ratings from different people?
If the tool and criteria are reliable, the result should not depend strongly on who applies them.
Lecturer example:
Two people observing the same gait using the same gait-assessment criteria should reach similar numerical conclusions if the tool is reliable.
What is Cohen's kappa (κ)?
Cohen's kappa is frequently used to assess inter-rater reliability.
It is a correlation/agreement statistic that measures agreement beyond that expected by chance.
Range:
- −1 = poor agreement
- +1 = almost perfect agreement
How was Cohen's kappa illustrated in the lecture?
Example report:
"There was moderate agreement between the two officers' judgements, κ = .593 (95% CI, .340 to .846), p < .0005."
Lecturer explanation:
Unlike the common p < 0.05 convention in hypothesis testing, there is no single universally accepted kappa cut-off in health research, so authors may need to justify what they call acceptable agreement.
What is inter-item reliability?
Inter-item reliability is a measure of internal consistency.
It asks whether multiple questions on a scale measure the same underlying dimension.
Cronbach's alpha is frequently used to assess inter-item reliability.

How was Cronbach's alpha illustrated with the "enthusiasm" construct?
A questionnaire contained six questions intended to measure the construct "enthusiasm."
Cronbach's α = 0.823.
The scale was described as having a high level of internal consistency.
What did the lecturer conclude when revisiting the Lancet article's Cronbach's α = 0.948?
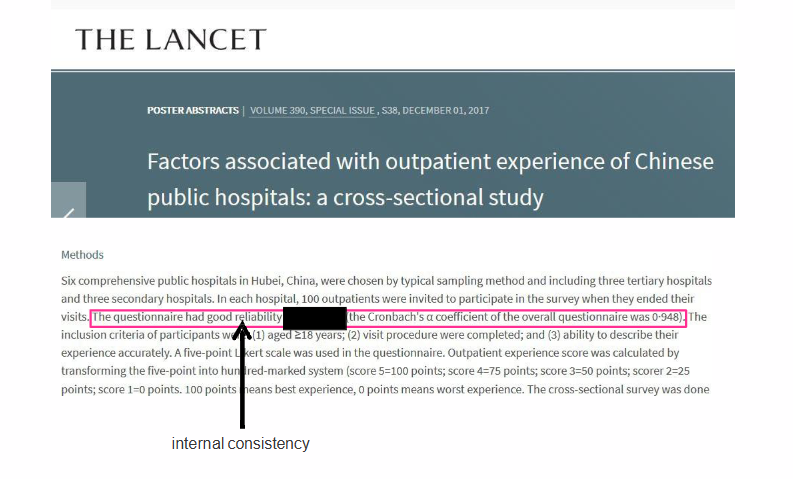
Cronbach's alpha supports internal consistency and therefore reliability.
It does not by itself show that the questionnaire measures the correct construct.
Lecturer emphasis:
A measure can be highly consistent yet still be invalid.

What is validity, and what is a construct?
Validity is an indication of whether an instrument measures what it claims to measure.
.
Construct:
The actual underlying thing, trait or concept the instrument is intended to measure.
.
Examples of constructs:
- Spatial reasoning
- Pain
- Depression
- Knowledge retention


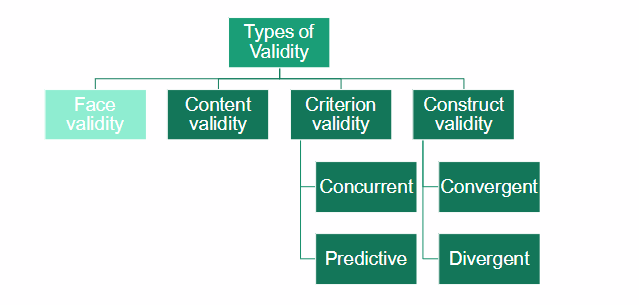
What are the major types and subtypes of validity?
Face validity
Content validity
.
Criterion validity:
- Concurrent validity
- Predictive validity
.
Construct validity:
- Convergent validity
- Divergent validity

What is face validity?
The extent to which a measuring instrument appears to be a valid measure of the construct.
.
It asks whether the test "looks valid" to the people who selected it and those who take it.
Example:
Does a school achievement test appear to measure student achievement?
.
Face validity is weak and is not tested statistically.
Why did the lecturer describe face validity as a weak form of validity?
It is based mainly on whether the measure appears appropriate rather than on rigorous evidence.
Lecturer explanation:
It is similar to a simple "does this seem right?" check. It may sometimes be the best available starting point, but stronger forms of validity should be sought where possible.

What is content validity?
The extent to which a measuring instrument covers a relevant and representative sample of the domains that make up the construct.
It can be assessed by:
- Critical review.
- An expert panel.
- Assessing clarity and completeness.
- Comparison with the literature.


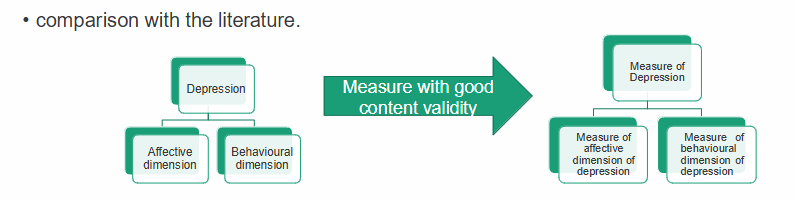
How does the depression example illustrate content validity?
Depression may include multiple domains, including:
- Affective dimension: subjective feelings.
- Behavioural dimension: observable behaviour.
A measure with good content validity should represent the important domains in appropriate proportions rather than assess only one part of the construct.
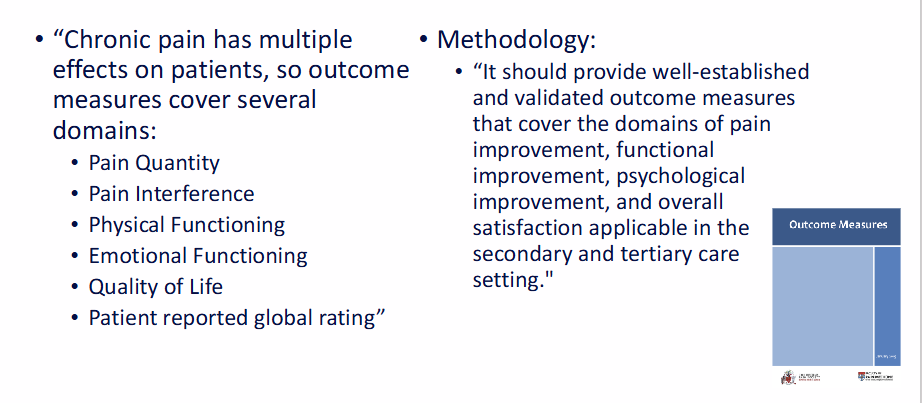
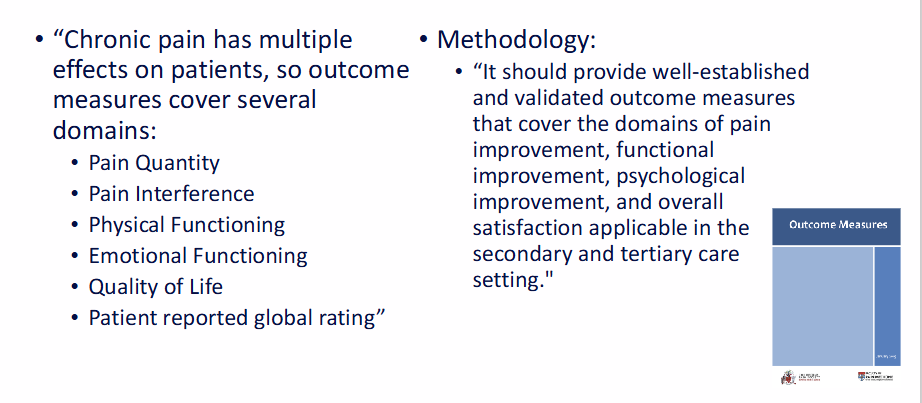
What domains did the British Pain Society example identify for chronic-pain outcome measures?
Because chronic pain has multiple effects, outcome measures should cover:
- Pain quantity.
- Pain interference.
- Physical functioning.
- Emotional functioning.
- Quality of life.
- Patient-reported global rating.

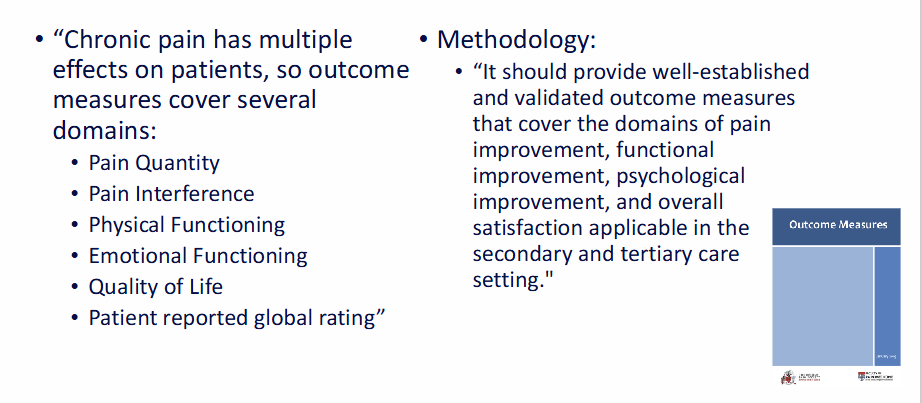
What methodological domains should pain outcome measures cover according to the British Pain Society example?
Outcome measures should be well-established and validated and cover:
- Pain improvement.
- Functional improvement.
- Psychological improvement.
- Overall satisfaction.
They should be applicable in secondary and tertiary care.
What is criterion validity?
Criterion validity is the extent to which the results of a measuring instrument correlate with an established measure of the same construct, such as a gold standard.
.
has two subtypes: concurrent validity and predictive validity
What is concurrent validity?
Concurrent validity is criterion validity assessed by comparing the new measure with another measure of the same construct at the same time.
Lecturer example:
Compare a new diabetes test with the current gold-standard diabetes test on the same occasion.
What is predictive validity?
Predictive validity compares a current measure with another measure or outcome of the same construct at a future time.
Example:
Year 12 marks have predictive validity if they correlate with later university attainment.
Lecturer explanation:
This logic can also apply to prognostic tests that predict later disease or outcomes.
What is construct validity?
Construct validity is the degree to which an instrument accurately measures the theoretical construct or trait it was designed to measure.
Core question:
"Does this assessment tool truly measure what it says it measures?"
What are the limitations of face, content and criterion validity?
Face validity:
Weak and not rigorous.
.
Content validity:
Mainly addresses whether all relevant categories or domains are represented.
.
Criterion validity:
Requires an existing valid comparator or gold standard.
.
General problem:
There is no direct "lens of truth" that allows perfect access to an underlying construct.
How can construct validity be assessed when no gold standard exists?
Thoroughly define the construct.
.
Then examine its relationship with:
- Measures of theoretically related concepts.
- Measures of theoretically unrelated concepts.
This uses convergent and divergent validity.
What is convergent validity?
A measure shows convergent validity when it correlates with measures of concepts that theory says should be related.
If two constructs should be related, scores should tend to move together in the expected direction.
What is divergent validity?
A measure shows divergent validity when it does not correlate with measures of unrelated or independent concepts.
Example from the lecturer:
A spatial-reasoning measure should not necessarily correlate with an unrelated ability such as language performance.
What is the relationship between reliability and validity?
A good measure should be both reliable and valid.
.
Reliability and validity are different properties:
- A test can be reliable without being valid.
- A valid test will generally show some reliability, but reliability is not identical to validity.
- A valid construct can still be measured with some variability because of instrumentation or other factors.
How does the head-circumference "intelligence test" illustrate reliability versus validity?
Suppose intelligence is measured by head circumference based on the theory that a larger brain means greater intelligence and a larger brain means a larger head.
Head circumference can be measured consistently:
Reliable = yes.
But head circumference does not validly measure intelligence:
Valid = no.
The example shows that precision and consistency do not guarantee construct validity.
What is diagnostic testing, and what is its clinical utility?
Diagnosis identifies whether a person has or does not have a particular condition.
.
Diagnostic tests can:
- Detect disease that is not directly clinically observable.
- Distinguish between differential diagnoses.
.
Criterion validity is often assessed by comparison with a gold standard and expressed using sensitivity and specificity.
What are differential diagnoses?
Different plausible explanations for the same clinical presentation.
Lecturer example:
Chest symptoms could reflect myocardial infarction or an anxiety attack.
A diagnostic test can help distinguish between these competing possibilities.

How is a new diagnostic test validated against a reference test?
The same study participants undergo:
Reference test:
The gold standard used to define true disease status.
- Positive = condition present.
- Negative = condition absent.
.
Index test:
The new test being evaluated.
The index-test result is compared with the reference-test result.


What are the four outcomes in a diagnostic two-by-two table?
True positive:
Disease present, test positive.
True negative:
Disease absent, test negative.
False positive:
Disease absent, test positive.
False negative:
Disease present, test negative.


How is the two-by-two table organised?
Columns:
- Disease present
- Disease absent
Rows:
- Positive test result
- Negative test result
Cells:
Positive + disease = true positive
Positive + no disease = false positive
Negative + disease = false negative
Negative + no disease = true negative
This table is the basis for diagnostic-performance calculations.

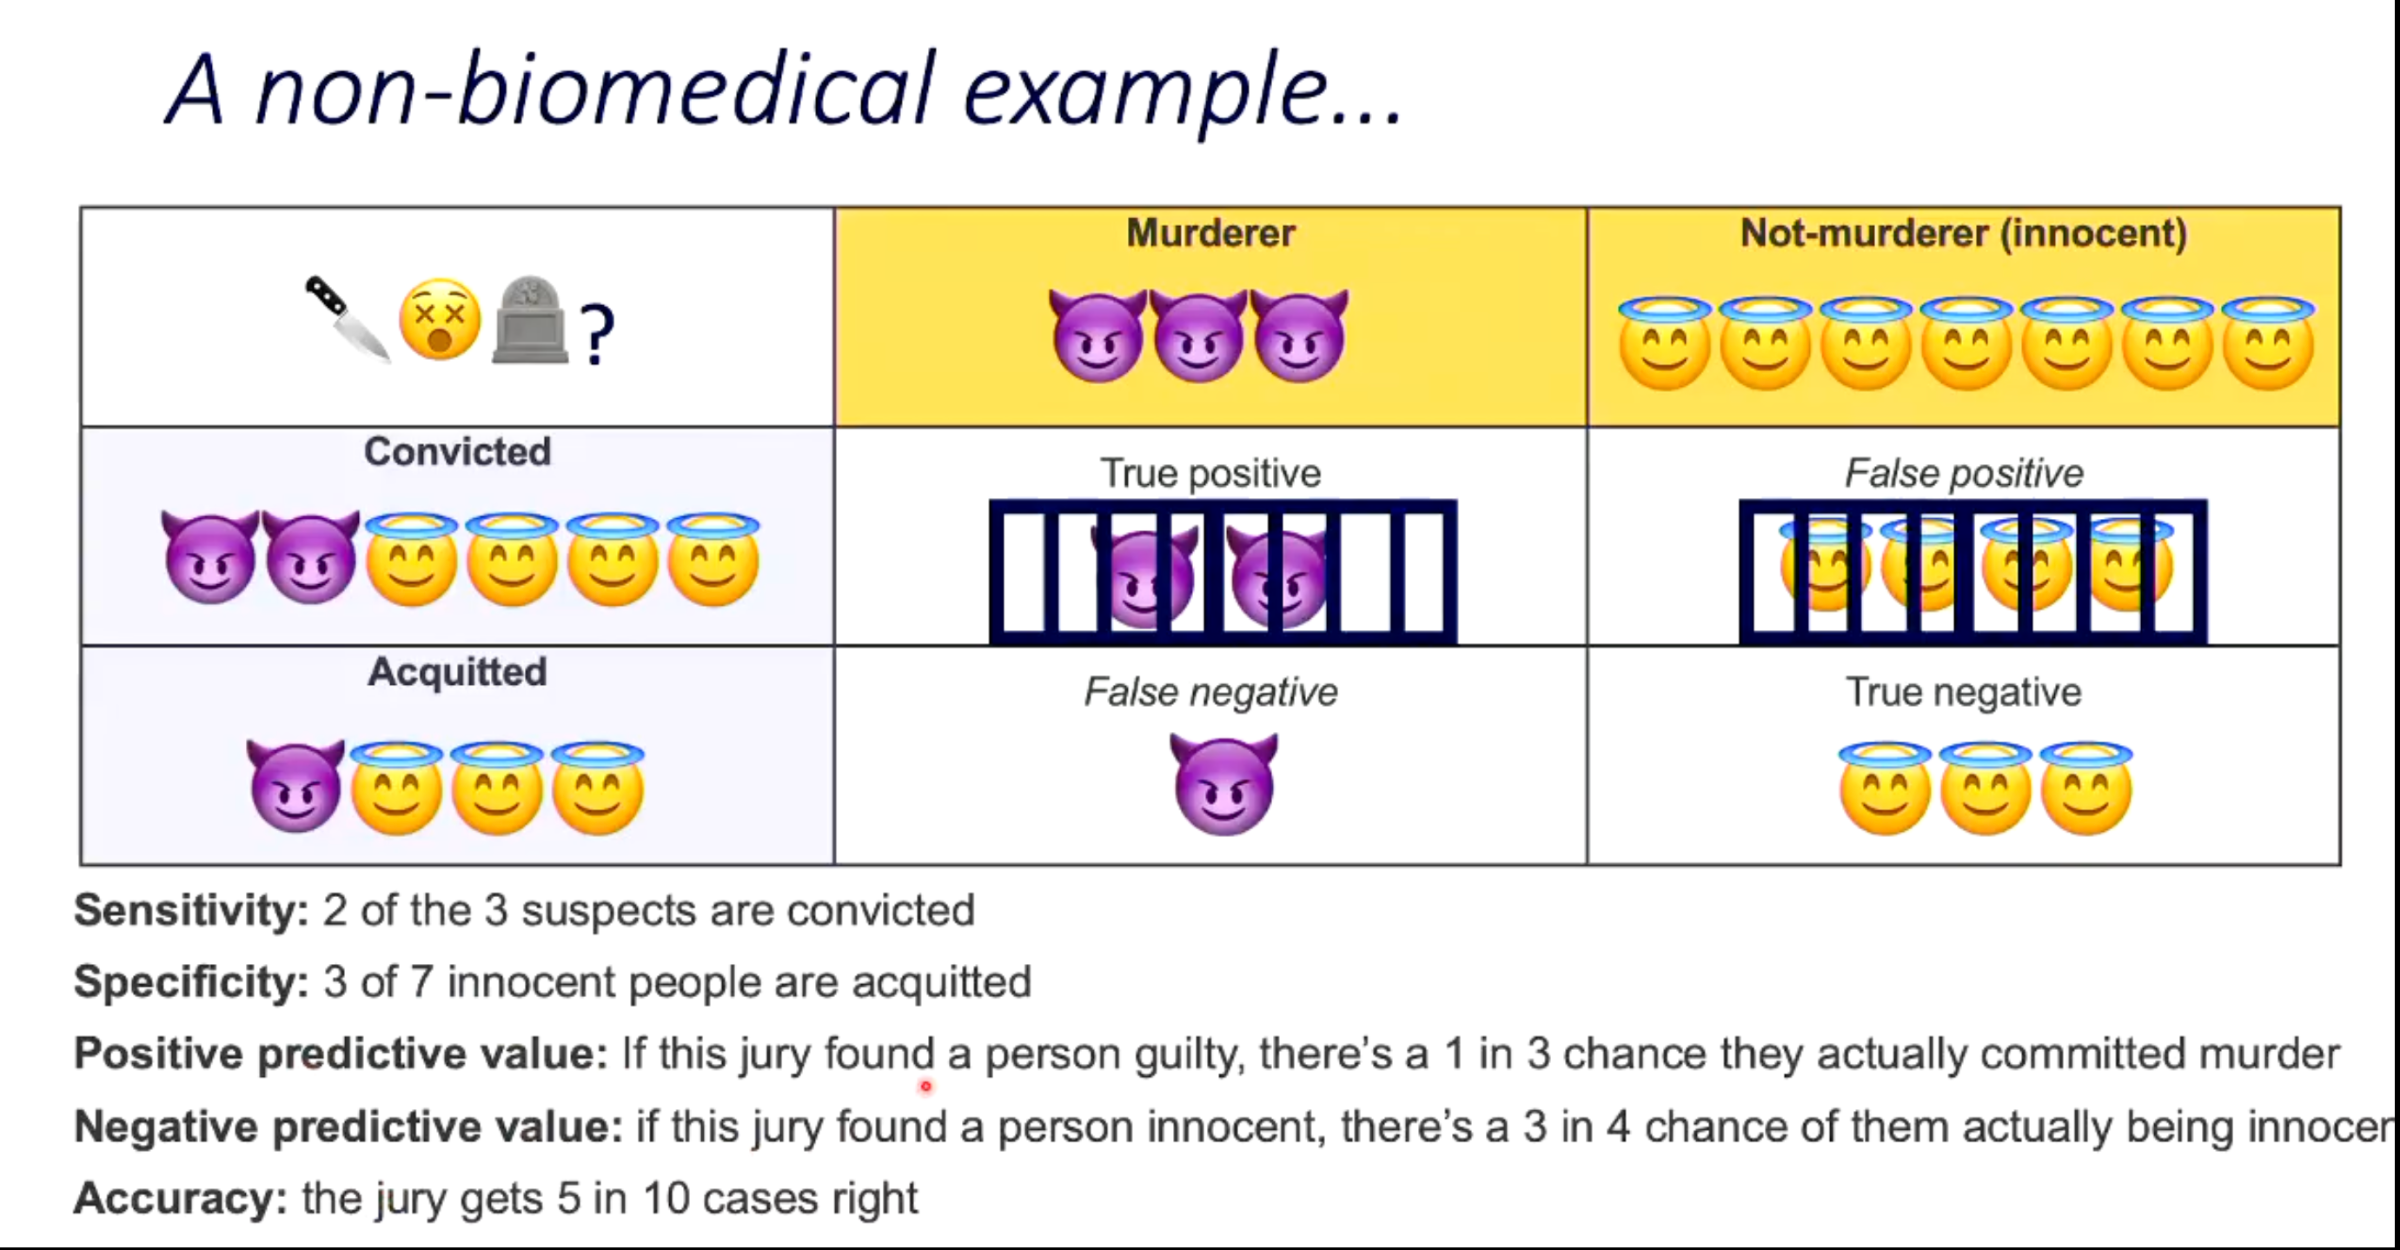
How did the jury example map diagnostic-test concepts onto a non-biomedical scenario?
Gold-standard truth:
- Murderer
- Not murderer
Jury result:
- Convicted
- Acquitted
Thus:
- True positive = murderer convicted
- False positive = innocent person convicted
- False negative = murderer acquitted
- True negative = innocent person acquitted

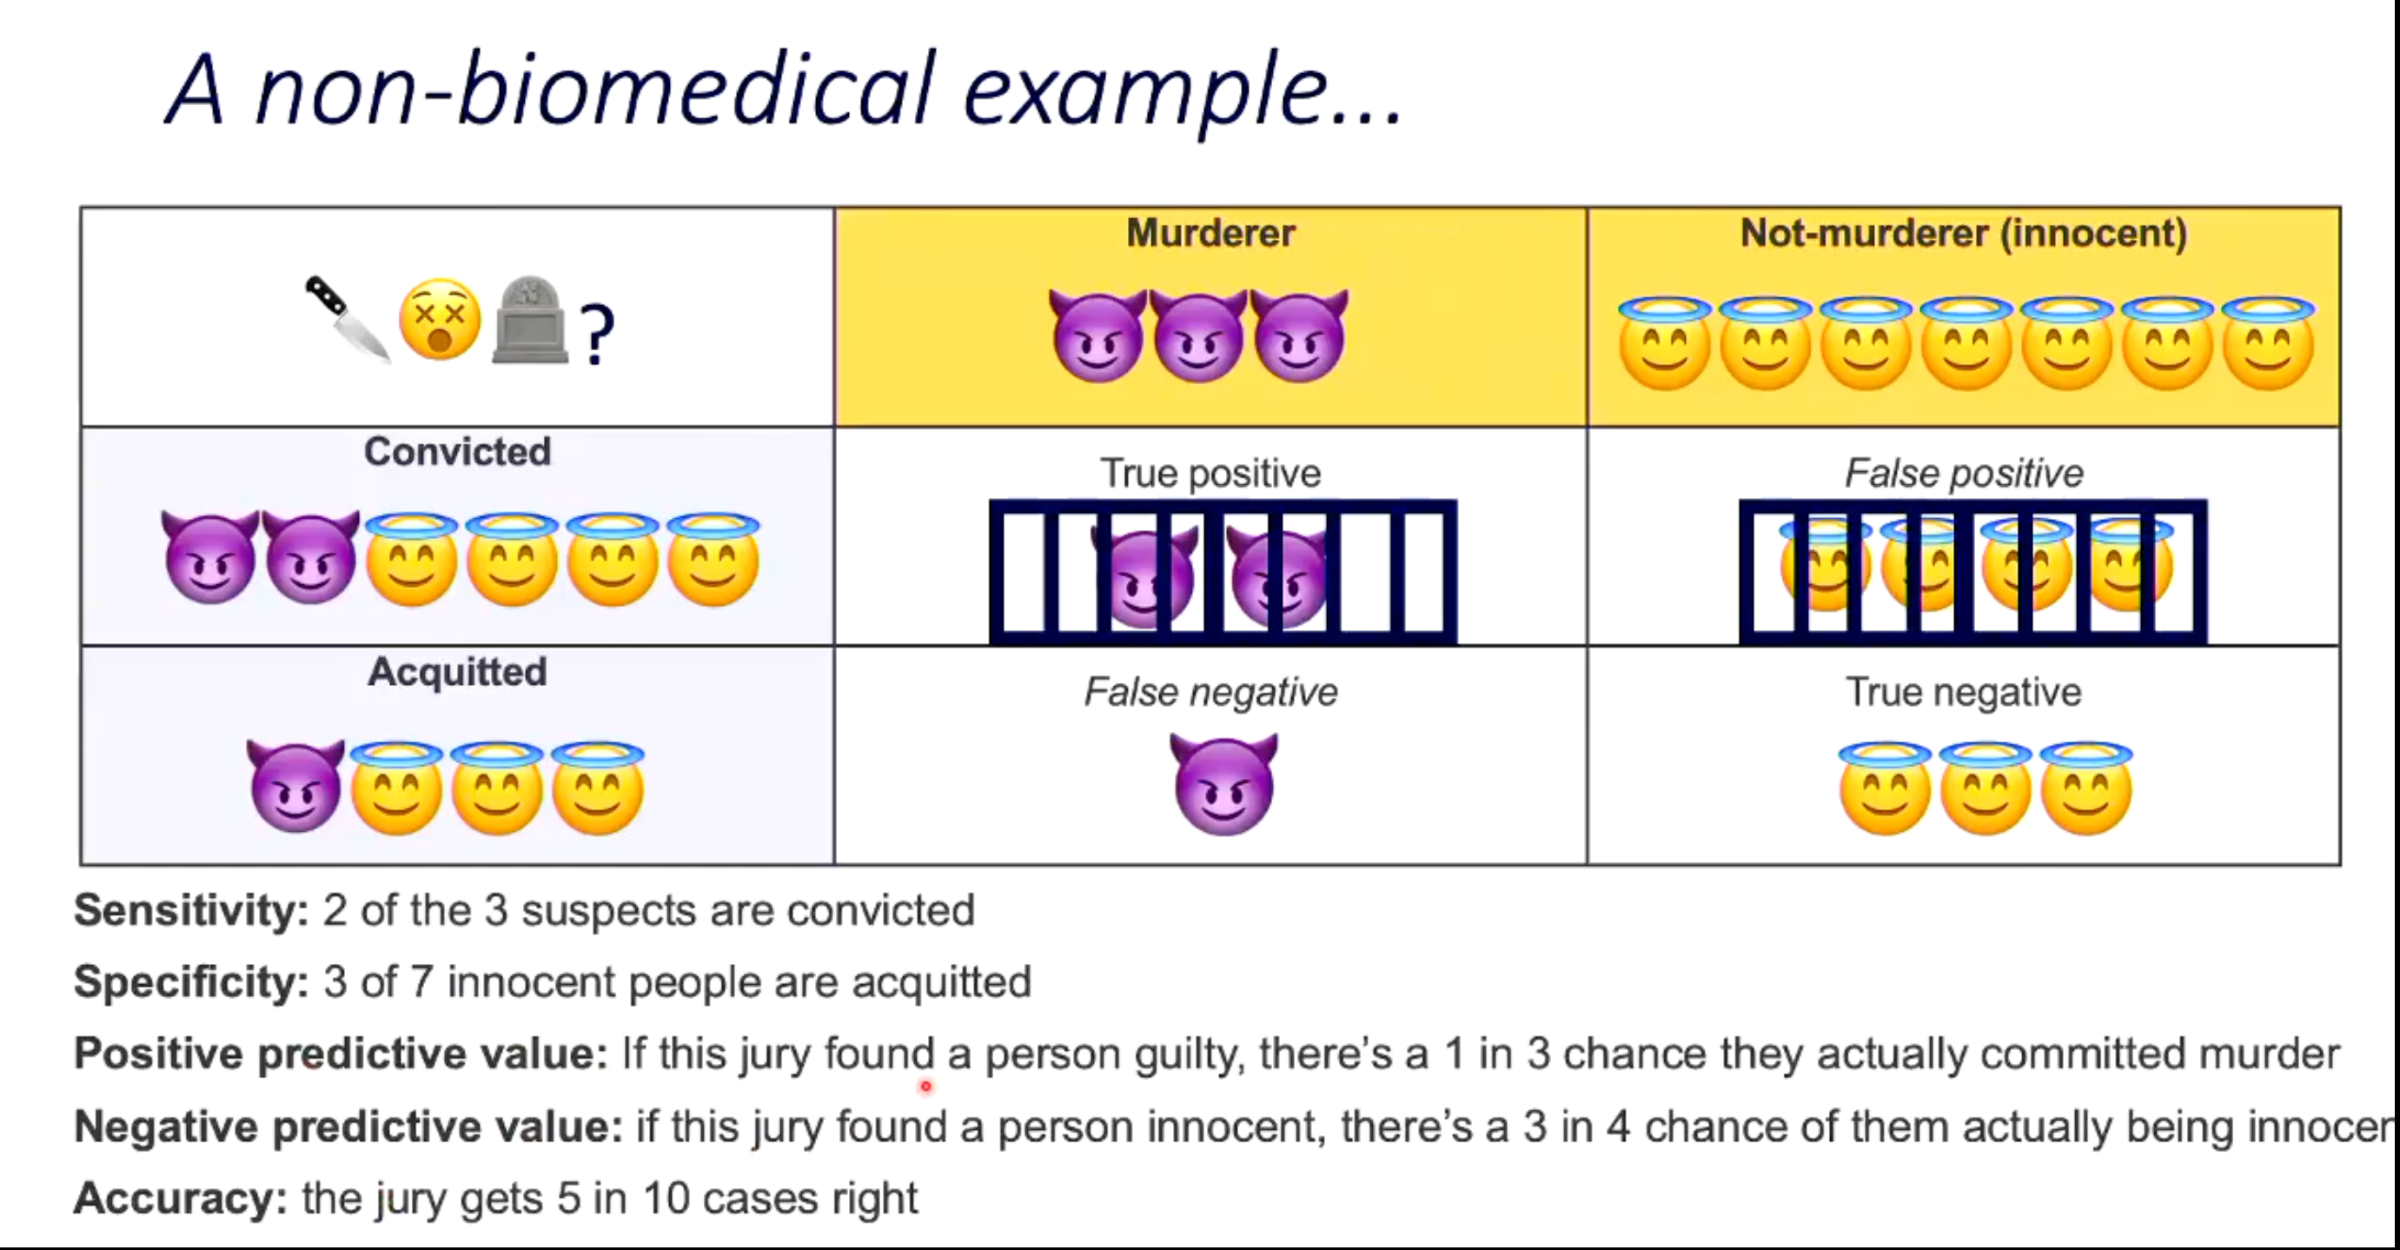
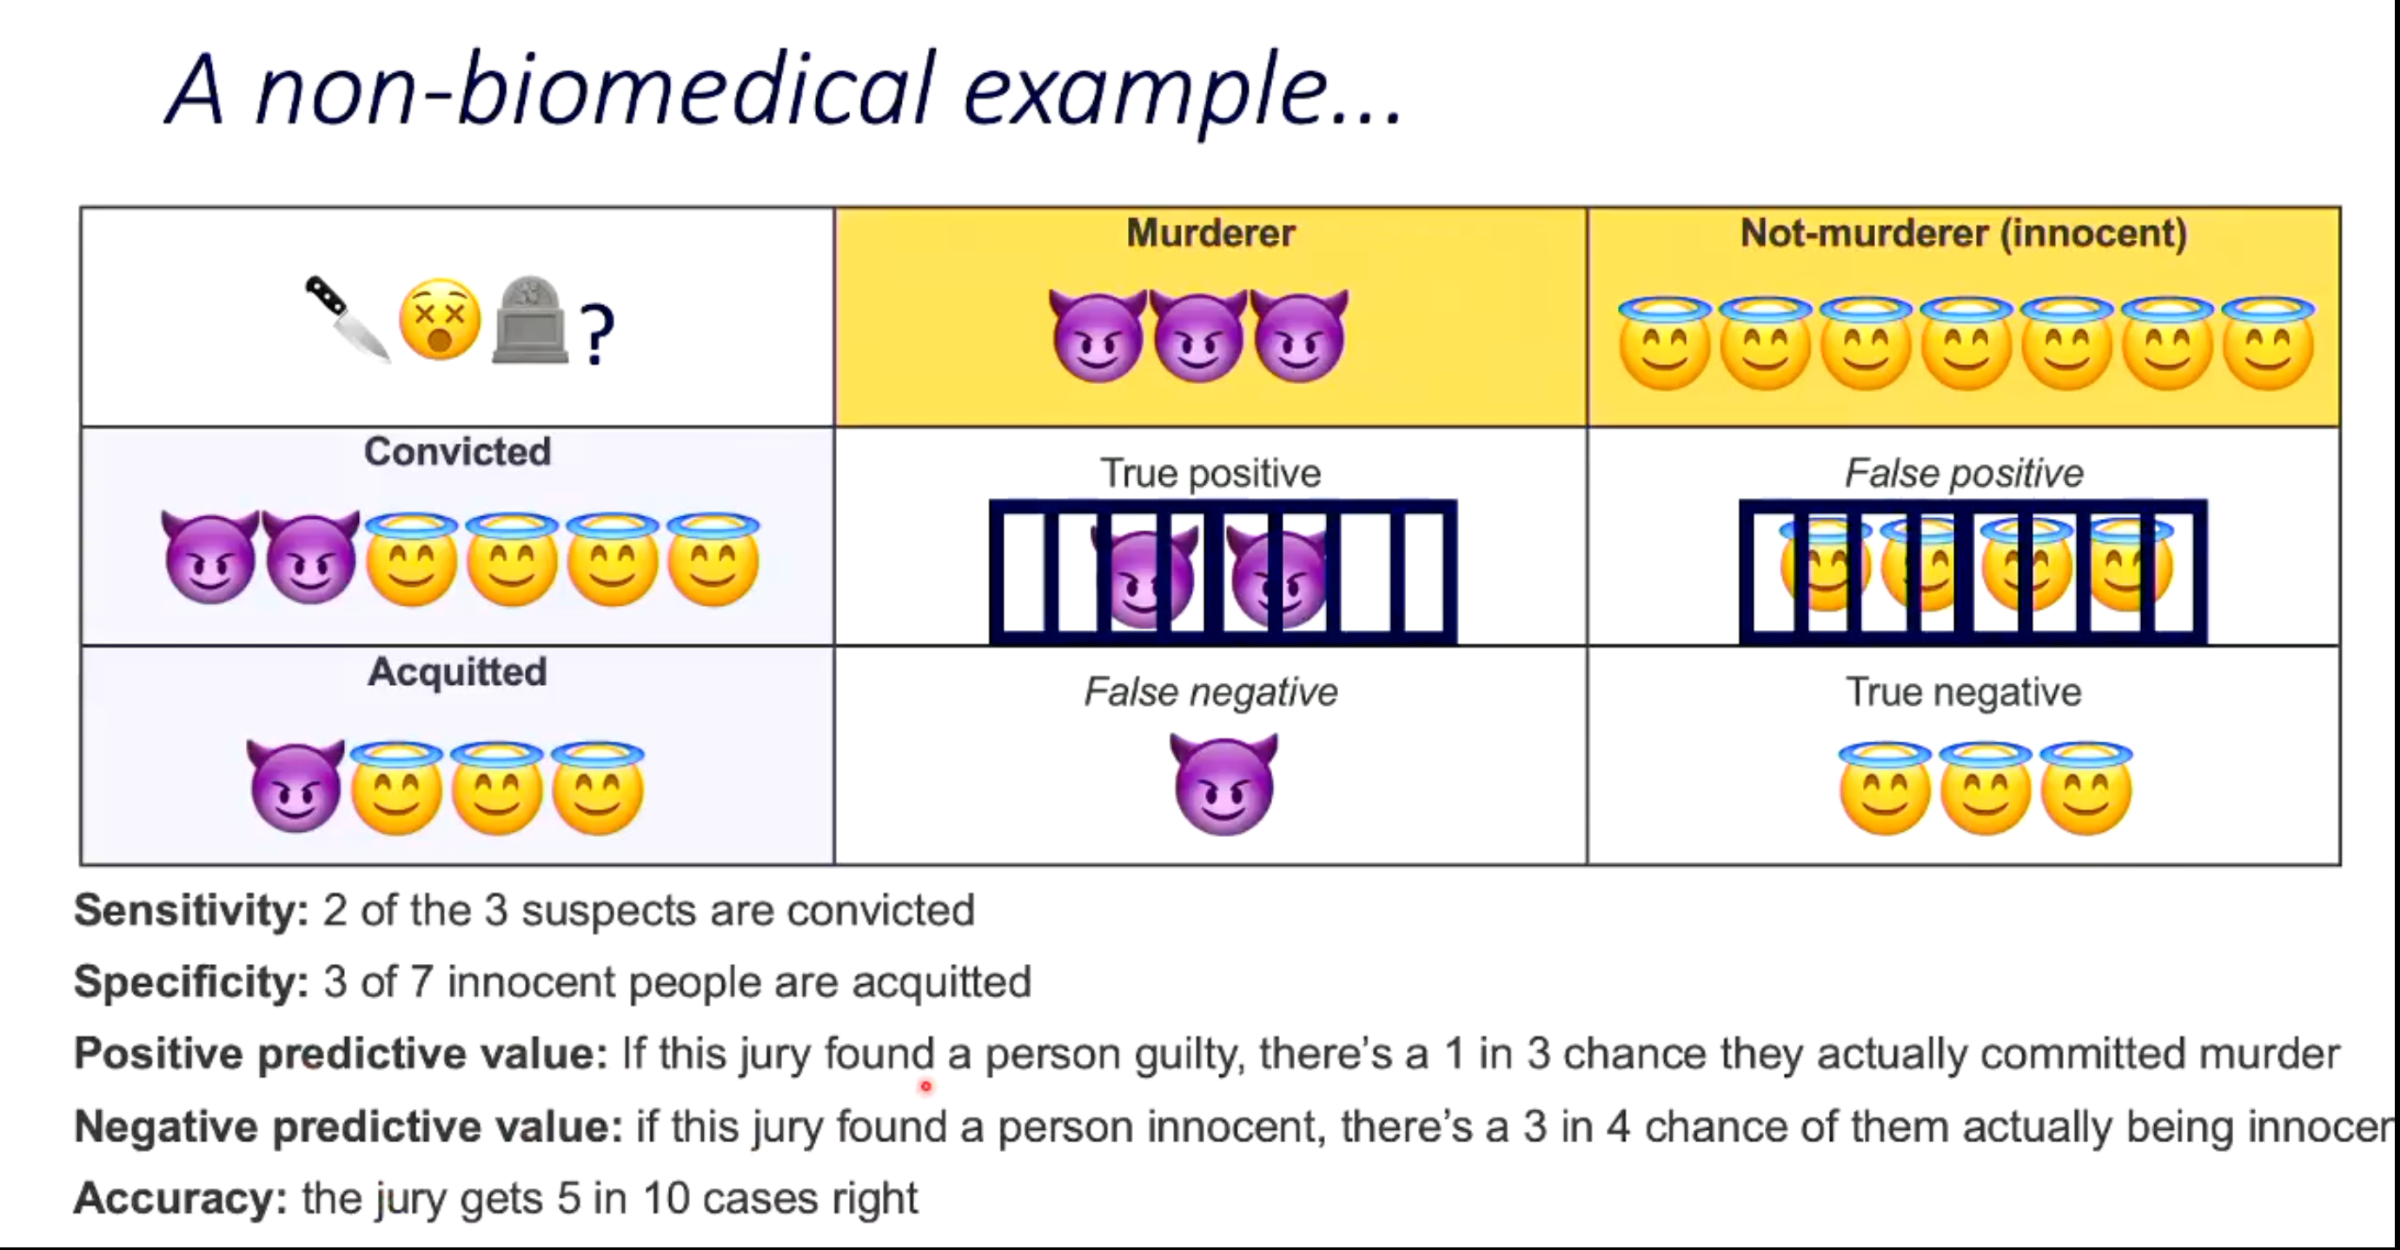
What were the sensitivity, specificity, predictive values and accuracy in the jury example?
Sensitivity:
2 of 3 murderers were convicted.
.
Specificity:
3 of 7 innocent people were acquitted.
.
Positive predictive value:
If the jury convicted someone, there was a 1 in 3 chance they actually committed murder.
.
Negative predictive value:
If the jury acquitted someone, there was a 3 in 4 chance they were actually innocent.
.
Accuracy:
5 of 10 cases were classified correctly.
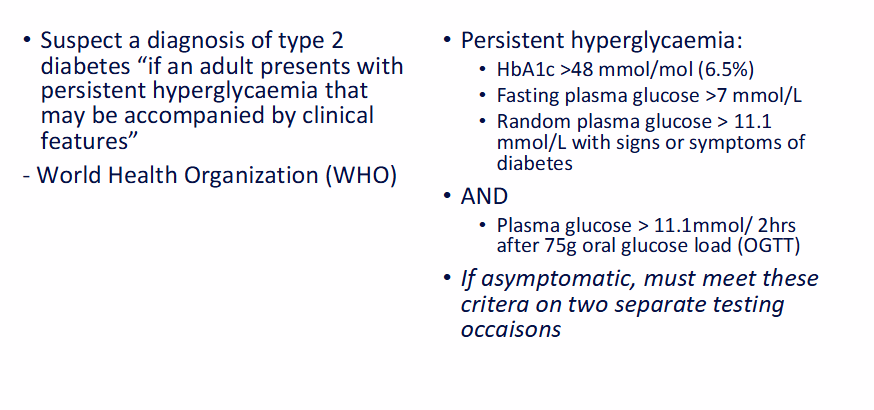
What criteria for persistent hyperglycaemia were listed for diagnosing type 2 diabetes?
WHO-related thresholds shown in the lecture:
- HbA1c >48 mmol/mol (6.5%).
- Fasting plasma glucose >7 mmol/L.
- Random plasma glucose >11.1 mmol/L with signs or symptoms of diabetes.
- Plasma glucose >11.1 mmol/L 2 hours after a 75 g oral glucose load in an OGTT.
.
If asymptomatic, the criteria must be met on two separate testing occasions.


What is HbA1c and why is it used in diabetes assessment?
HbA1c is glycated haemoglobin.
It reflects exposure of haemoglobin to glucose over time.
Lecturer explanation:
Because diabetes involves persistent hyperglycaemia, increased glycation of haemoglobin can be used as evidence of abnormal glycaemic control.

What is the oral glucose tolerance test (OGTT) procedure described in the lecture?
The patient:
1. Fasts overnight under standardised conditions.
2. Consumes a 75 g oral glucose load.
3. Has plasma glucose measured 2 hours later.
A value >11.1 mmol/L at 2 hours was listed as a diagnostic threshold.
Why must asymptomatic people sometimes meet diabetes criteria on two separate occasions?
Repeat testing helps show that the abnormal result reflects a real, persistent underlying abnormality rather than a one-off measurement.
Lecturer explanation:
This connects to test/retest reliability: a genuine persistent abnormality should be reproducible.
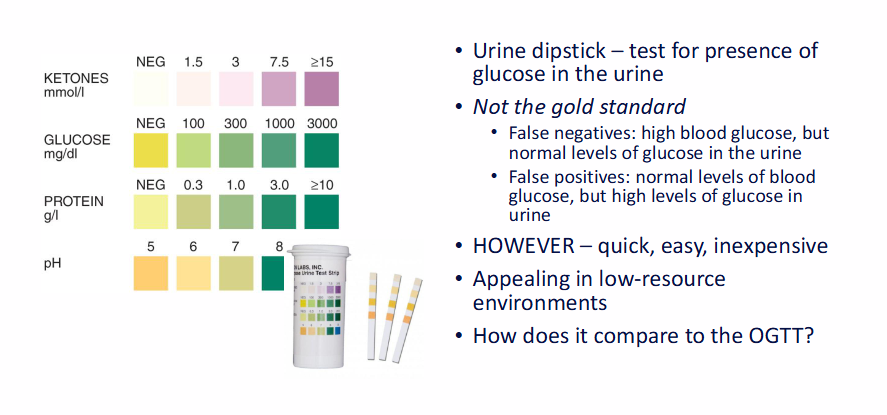
How does the urine dipstick test for glucose work, and why is it not the diabetes gold standard?
It detects glucose in urine using a colour-changing test strip.
It is not the gold standard because:
- False negatives can occur: blood glucose is high but urine glucose is normal.
- False positives can occur: blood glucose is normal but urine glucose is high.
Why can urine glucose disagree with blood glucose?
False negative explanation:
The kidneys may conserve glucose effectively, so blood glucose is high but little glucose appears in urine.
.
False positive explanation:
A low renal threshold or renal problem may allow glucose into urine despite normal blood glucose.


Why might urine glucose testing still be useful?
Advantages:
- Quick
- Easy
- Inexpensive
- No fasting required
Therefore, it may still be appealing in low-resource environments even though it is not the gold standard.
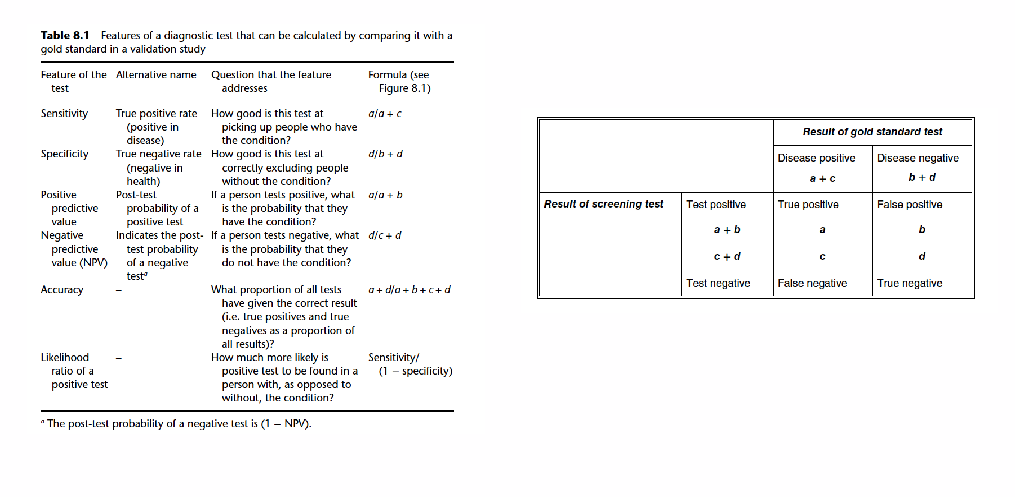

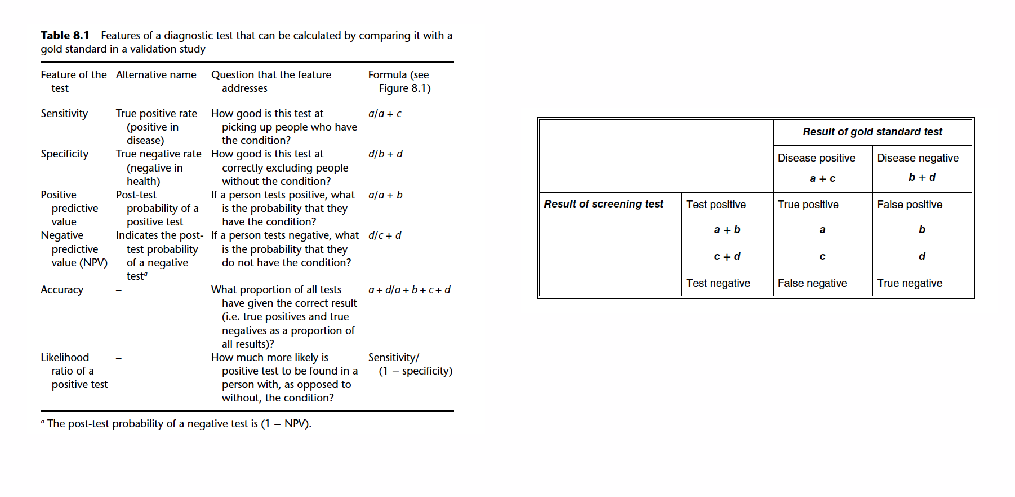
What does sensitivity measure, and what is its formula?
Sensitivity asks:
How good is the test at detecting people who truly have the condition?
.
Alternative name:
True-positive rate.
.
Formula:
Sensitivity = TP / (TP + FN)
or a / (a + c)
.
High sensitivity means few false negatives
Consequences of low sensitivity:
disease not detected in people in people who have it
high rate of false negatives
False reassurance that people do not have disease
People might delay seeking treatment
Costs without the benefits


What does specificity measure, and what is its formula?
Specificity asks:
How good is the test at correctly excluding people who do not have the condition?
.
Alternative name:
True-negative rate.
.
Formula:
Specificity = TN / (FP + TN)
or d / (b + d)
.
High specificity means few false positives.
.
Consequences of low specificity:
disease is “detected” in those that do not have it
High rate of false positives
unnecessary anxiety
unnecessary investigative procedures
Costs will increase with no compensating benefits


What does positive predictive value (PPV) measure, and what is its formula?
PPV asks:
If a person tests positive, what is the probability that they truly have the condition?
.
Formula:
PPV = TP / (TP + FP)
or a / (a + b)
.
PPV = true positive / positive test result
.
It is the post-test probability of disease after a positive result.

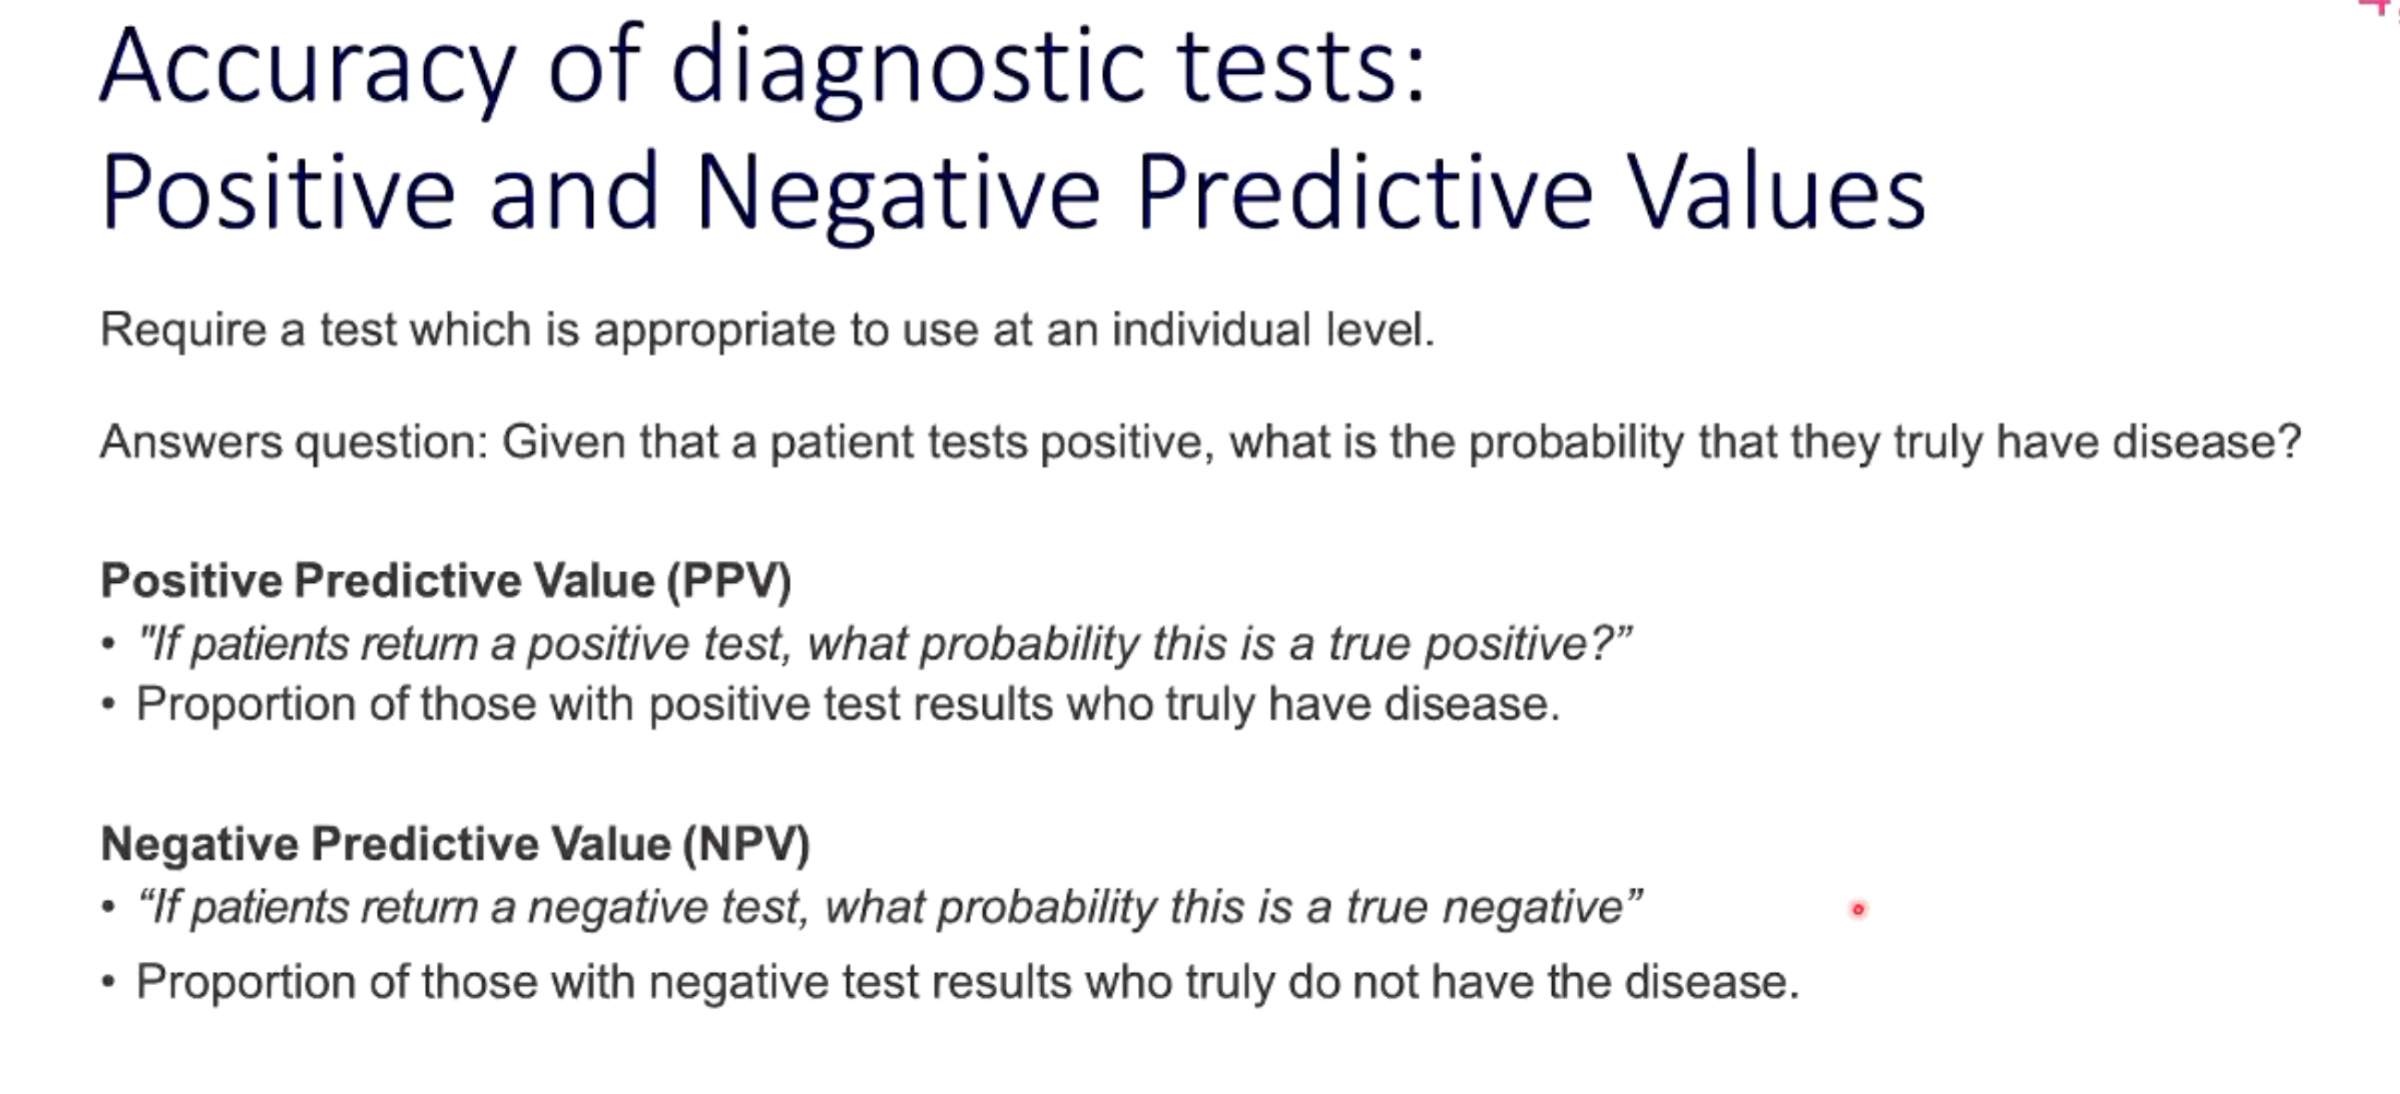
What does negative predictive value (NPV) measure, and what is its formula?
NPV asks:
If a person tests negative, what is the probability that they truly do not have the condition?
Formula:
NPV = TN / (FN + TN)
or d / (c + d)
.
NPV = true negative / negative test result
.
It is used to interpret a negative test result.

What does diagnostic accuracy measure, and what is its formula?
Accuracy asks:
What proportion of all tests gave the correct result?
.
Formula:
Accuracy = (TP + TN) / (TP + FP + FN + TN)
or (a + d) / (a + b + c + d)

What is the positive likelihood ratio (LR+), and what is its formula?
LR+ asks:
How much more likely is a positive test in a person with the condition than in a person without it?
Formula:
LR+ = Sensitivity / (1 − Specificity)
Equivalent interpretation:
True-positive rate divided by false-positive rate.

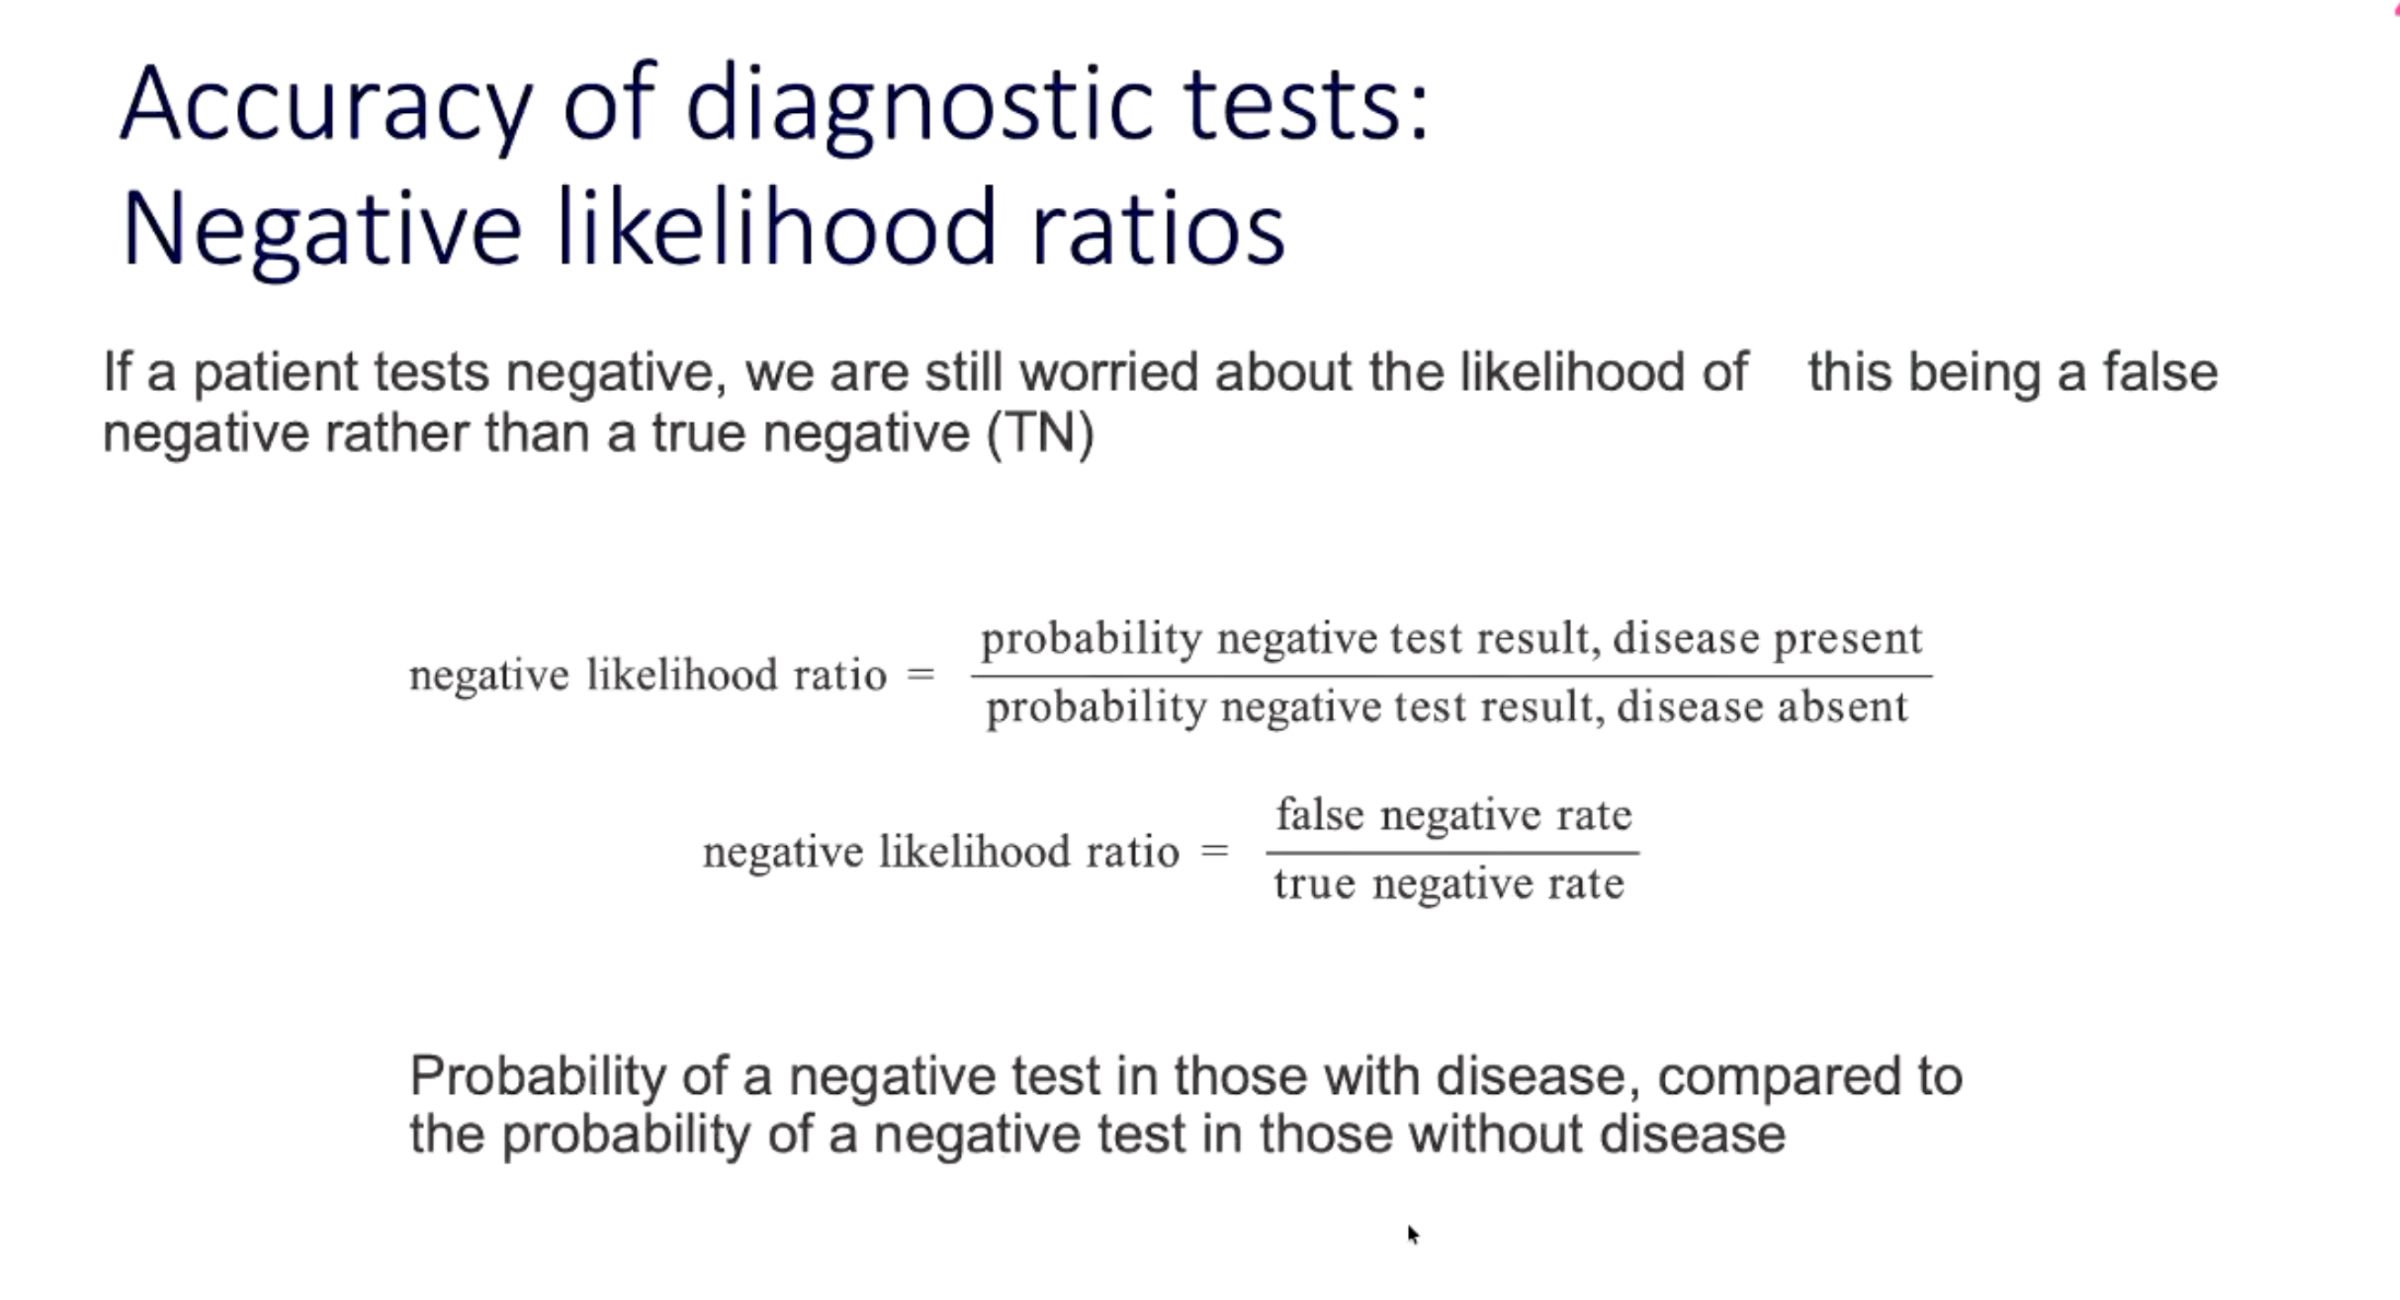
What is the negative likelihood ratio (LR−), and what is its formula?
LR− compares:
The probability of a negative test among people with the disease
with
the probability of a negative test among people without the disease.
Formula:
LR− = (1 − Sensitivity) / Specificity
Equivalent interpretation:
False-negative rate divided by true-negative rate.


What requirements define a diagnostic validation study?
The same population should be subjected to:
- The gold-standard reference test.
- The index test being validated.
Every participant is classified by both tests so the four cells of the two-by-two table can be filled.


What were the results in the urine-glucose versus OGTT validation example?
True positive = 6
False positive = 7
False negative = 21
True negative = 966
Total disease present:
6 + 21 = 27
Total disease absent:
7 + 966 = 973
Total participants:
1000

What was the sensitivity of the urine-glucose test in the validation example?
Sensitivity = TP / (TP + FN)
= 6 / (6 + 21)
= 6 / 27
≈ 22%
Interpretation:
The test had low sensitivity and missed many people who truly had diabetes.
What are the clinical consequences of low sensitivity?
Low sensitivity produces many false negatives.
Consequences:
- Disease may go undetected.
- Patients may receive false reassurance.
- Treatment may be delayed.
Lecturer explanation:
If an invasive or costly test also has poor sensitivity, exposing patients to its burden may be difficult to justify ethically.
What was the specificity of the urine-glucose test in the validation example?
Specificity = TN / (FP + TN)
= 966 / (7 + 966)
= 966 / 973
≈ 99%
Interpretation:
The urine-glucose test was highly specific; people without diabetes rarely tested positive.
What are the clinical consequences of low specificity?
Low specificity produces many false positives.
Consequences:
- Unnecessary anxiety.
- Additional investigations.
- Unnecessary cost.
- Possible unnecessary treatment.
- Exposure to harms without corresponding benefit.
How do high sensitivity and high specificity differ clinically?
High sensitivity:
Correctly identifies almost everyone who has the disease.
Few false negatives.
High specificity:
Correctly excludes almost everyone who does not have the disease.
Few false positives.
Lecturer conclusion for urine glucose:
It was not sensitive but was relatively specific.
What was the PPV of the urine-glucose test in the validation example?
PPV = TP / (TP + FP)
= 6 / (6 + 7)
= 6 / 13
≈ 46%
Interpretation:
Among people with a positive urine-glucose result, fewer than half actually had diabetes according to the gold standard.
What was the NPV of the urine-glucose test in the validation example?
NPV = TN / (FN + TN)
= 966 / (21 + 966)
= 966 / 987
≈ 98%
Interpretation:
A negative urine-glucose result was strongly associated with not having diabetes in this study population.
Why are sensitivity and specificity not the same as predictive values?
Sensitivity and specificity describe how the test behaves in groups whose disease status is already known.
Predictive values answer patient-facing conditional questions:
- Given a positive result, how likely is disease?
- Given a negative result, how likely is absence of disease?
They use different denominators and answer different questions.
How should the urine-glucose test be interpreted in a patient with or without diabetes symptoms?
A negative result is more reassuring when the pre-test probability is already low, such as in an asymptomatic low-risk person.
If a patient has strong symptoms and risk factors, a negative urine test should not automatically end the investigation because the test has many false negatives.
Lecturer emphasis:
Test results must be interpreted together with clinical context and pre-test probability.
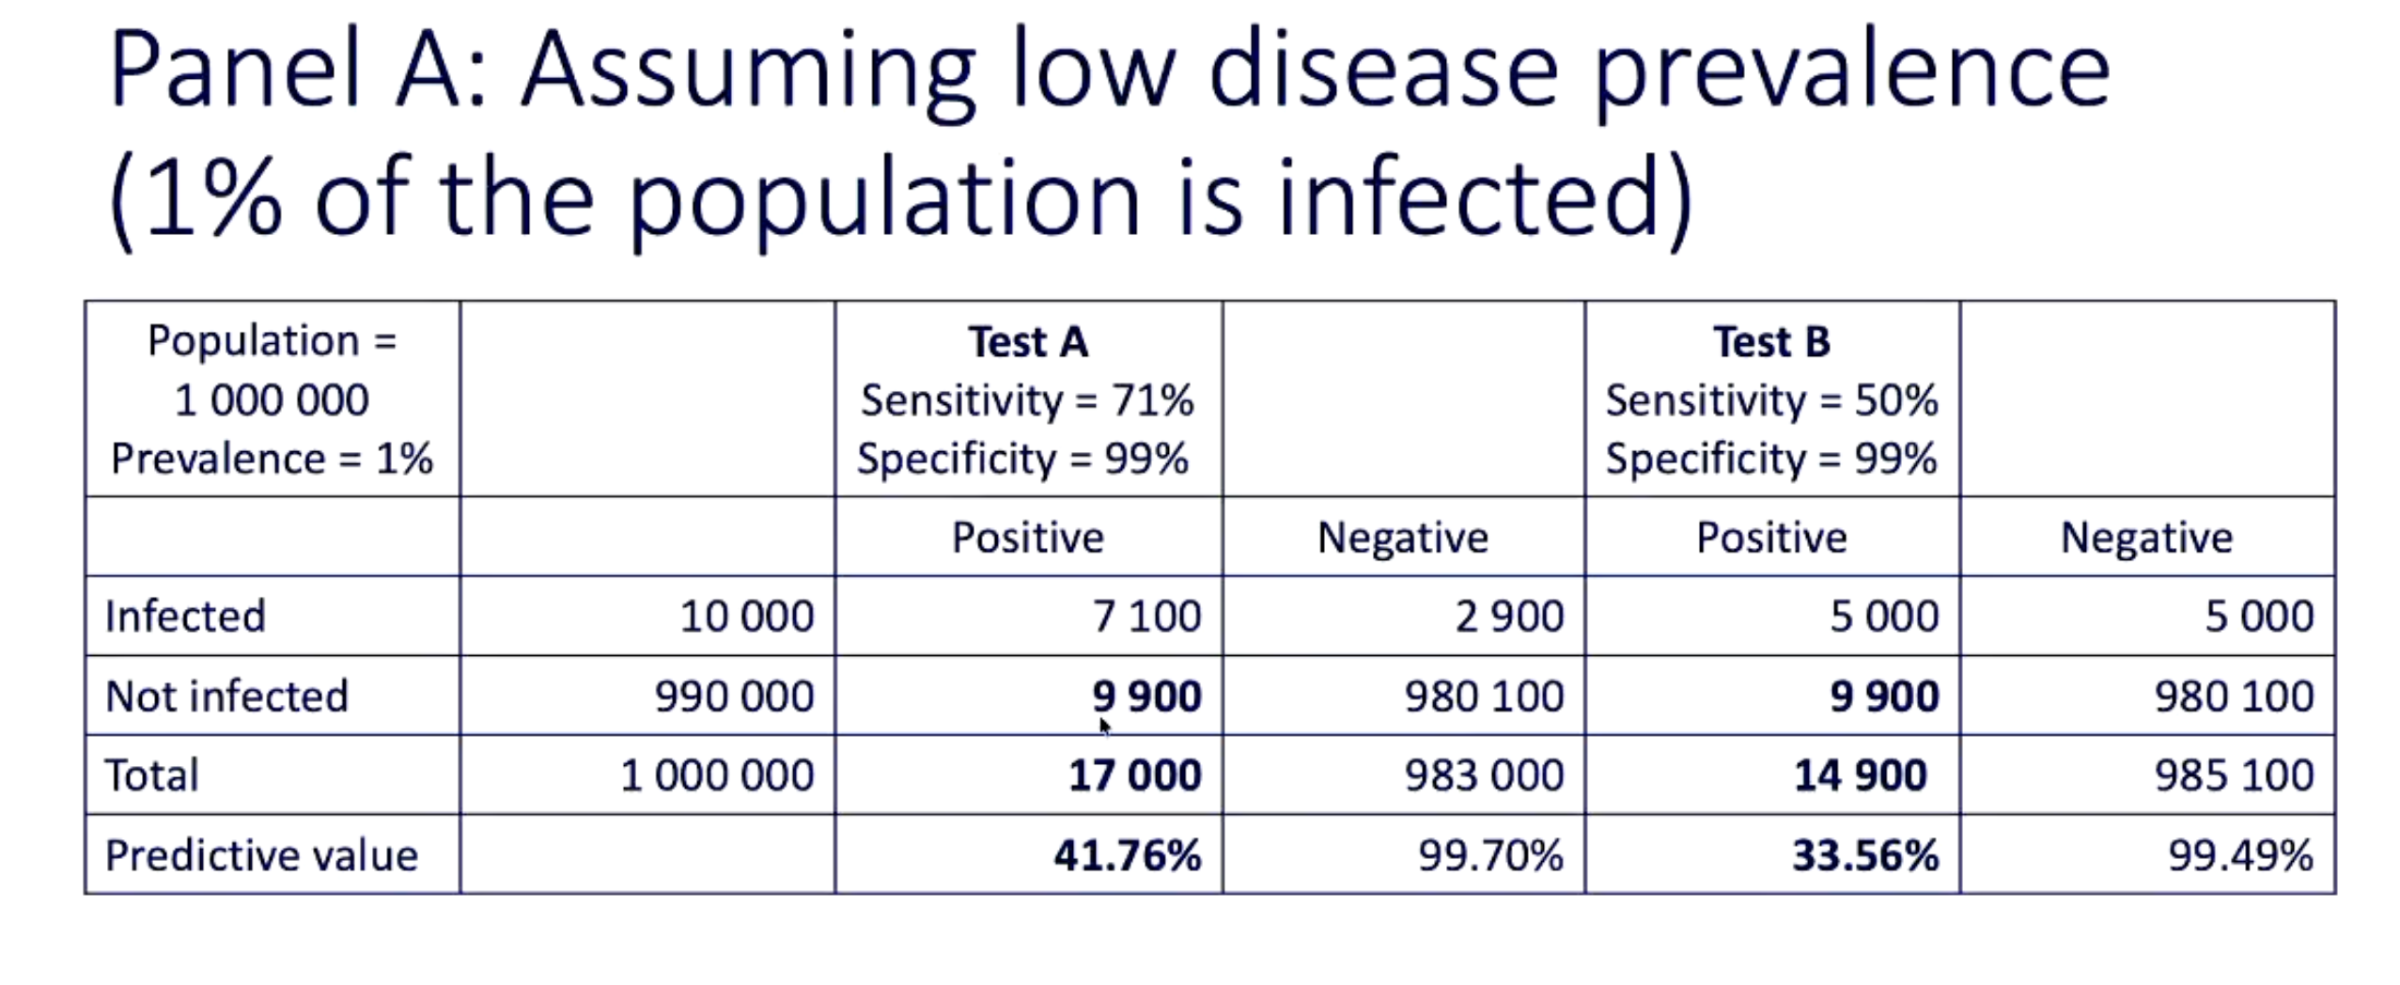
How does disease prevalence affect positive and negative predictive values?
PPV and NPV depend on the prevalence of disease in the tested population.
When prevalence rises:
- More tested people truly have disease.
- PPV generally increases.
When prevalence changes, PPV and NPV can change even though the test's sensitivity and specificity remain the same.


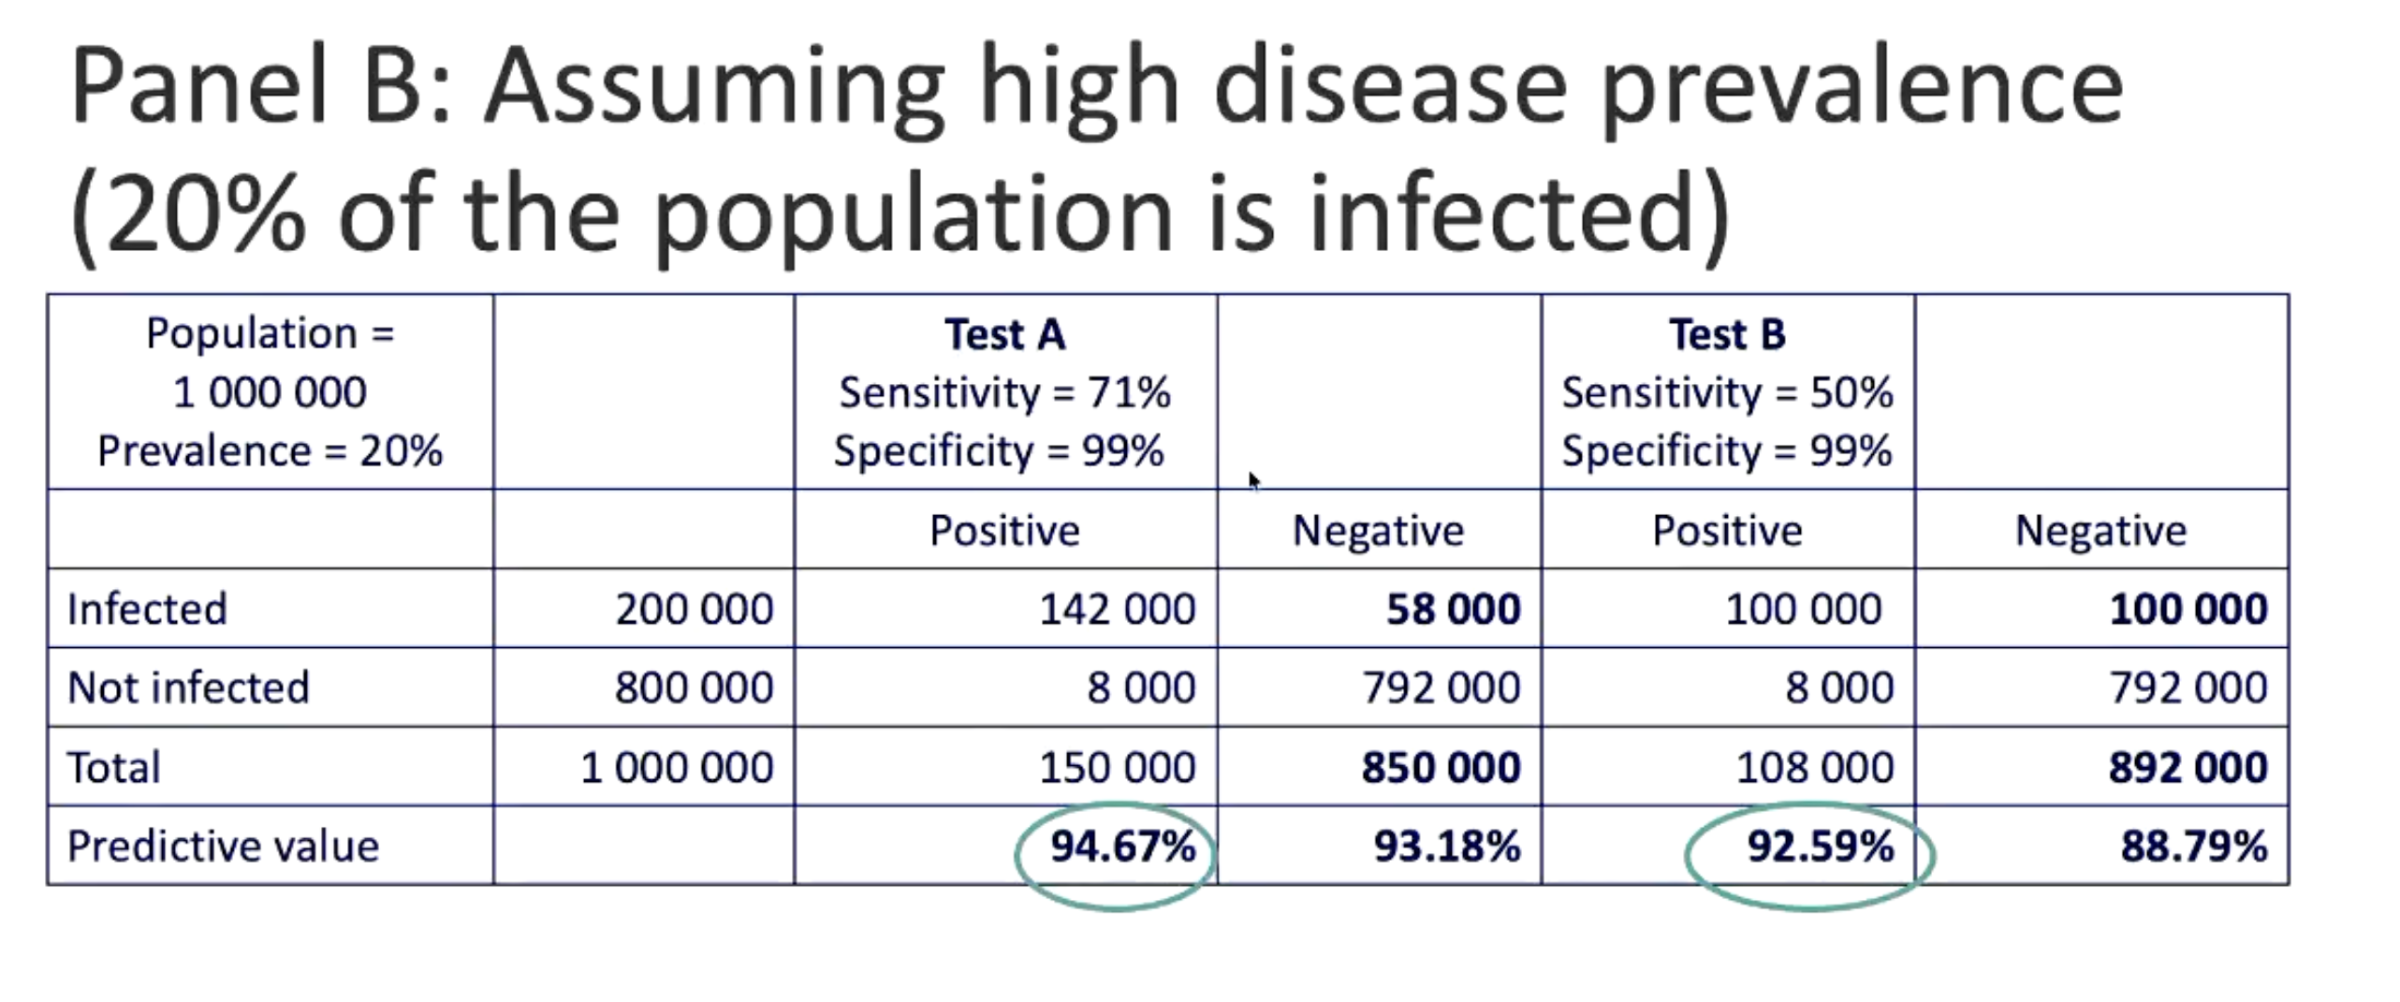
What population example did the lecturer use to explain prevalence effects on predictive value?
The lecturer considered a population of 1,000,000 people.
At 1% prevalence:
- 10,000 infected.
- 990,000 not infected.
.
At 20% prevalence:
- 200,000 infected.
For the same test, PPV increased when prevalence rose because more people in the tested population truly had the disease.
Why can a predictive value reported in one study be misleading when applying the test elsewhere?
Predictive values reflect both test performance and disease prevalence in the study population.
Therefore, before applying a published PPV or NPV, ask whether the prevalence in the study population resembles the prevalence in the clinical population of interest.
Why are likelihood ratios useful compared with predictive values?
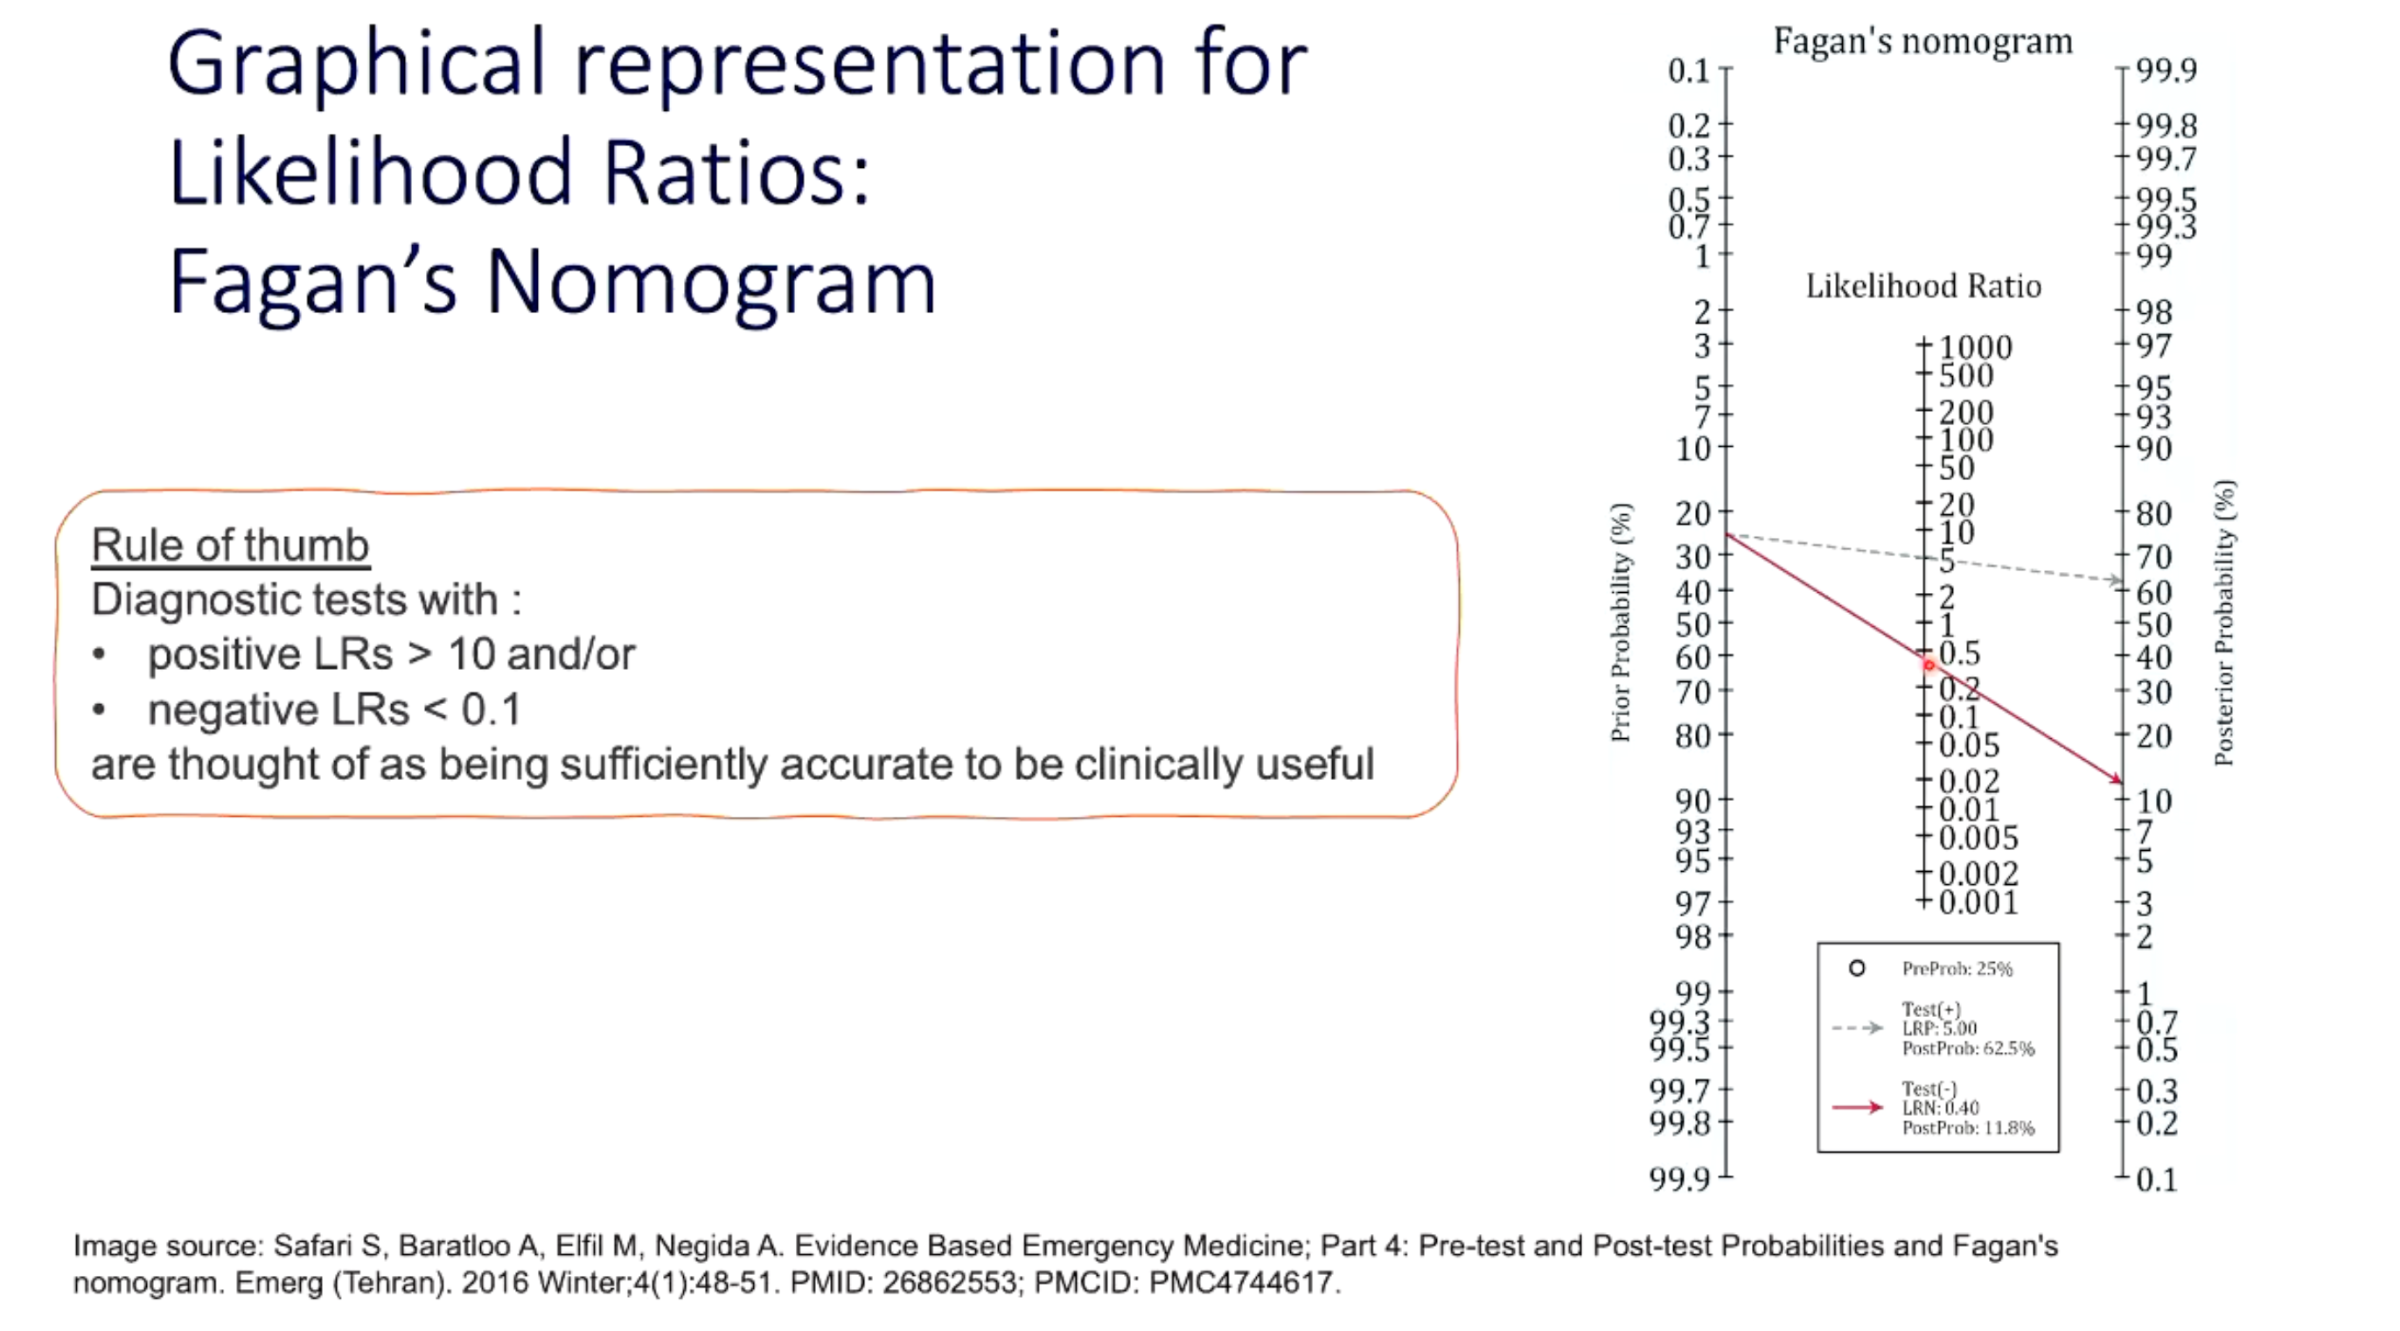
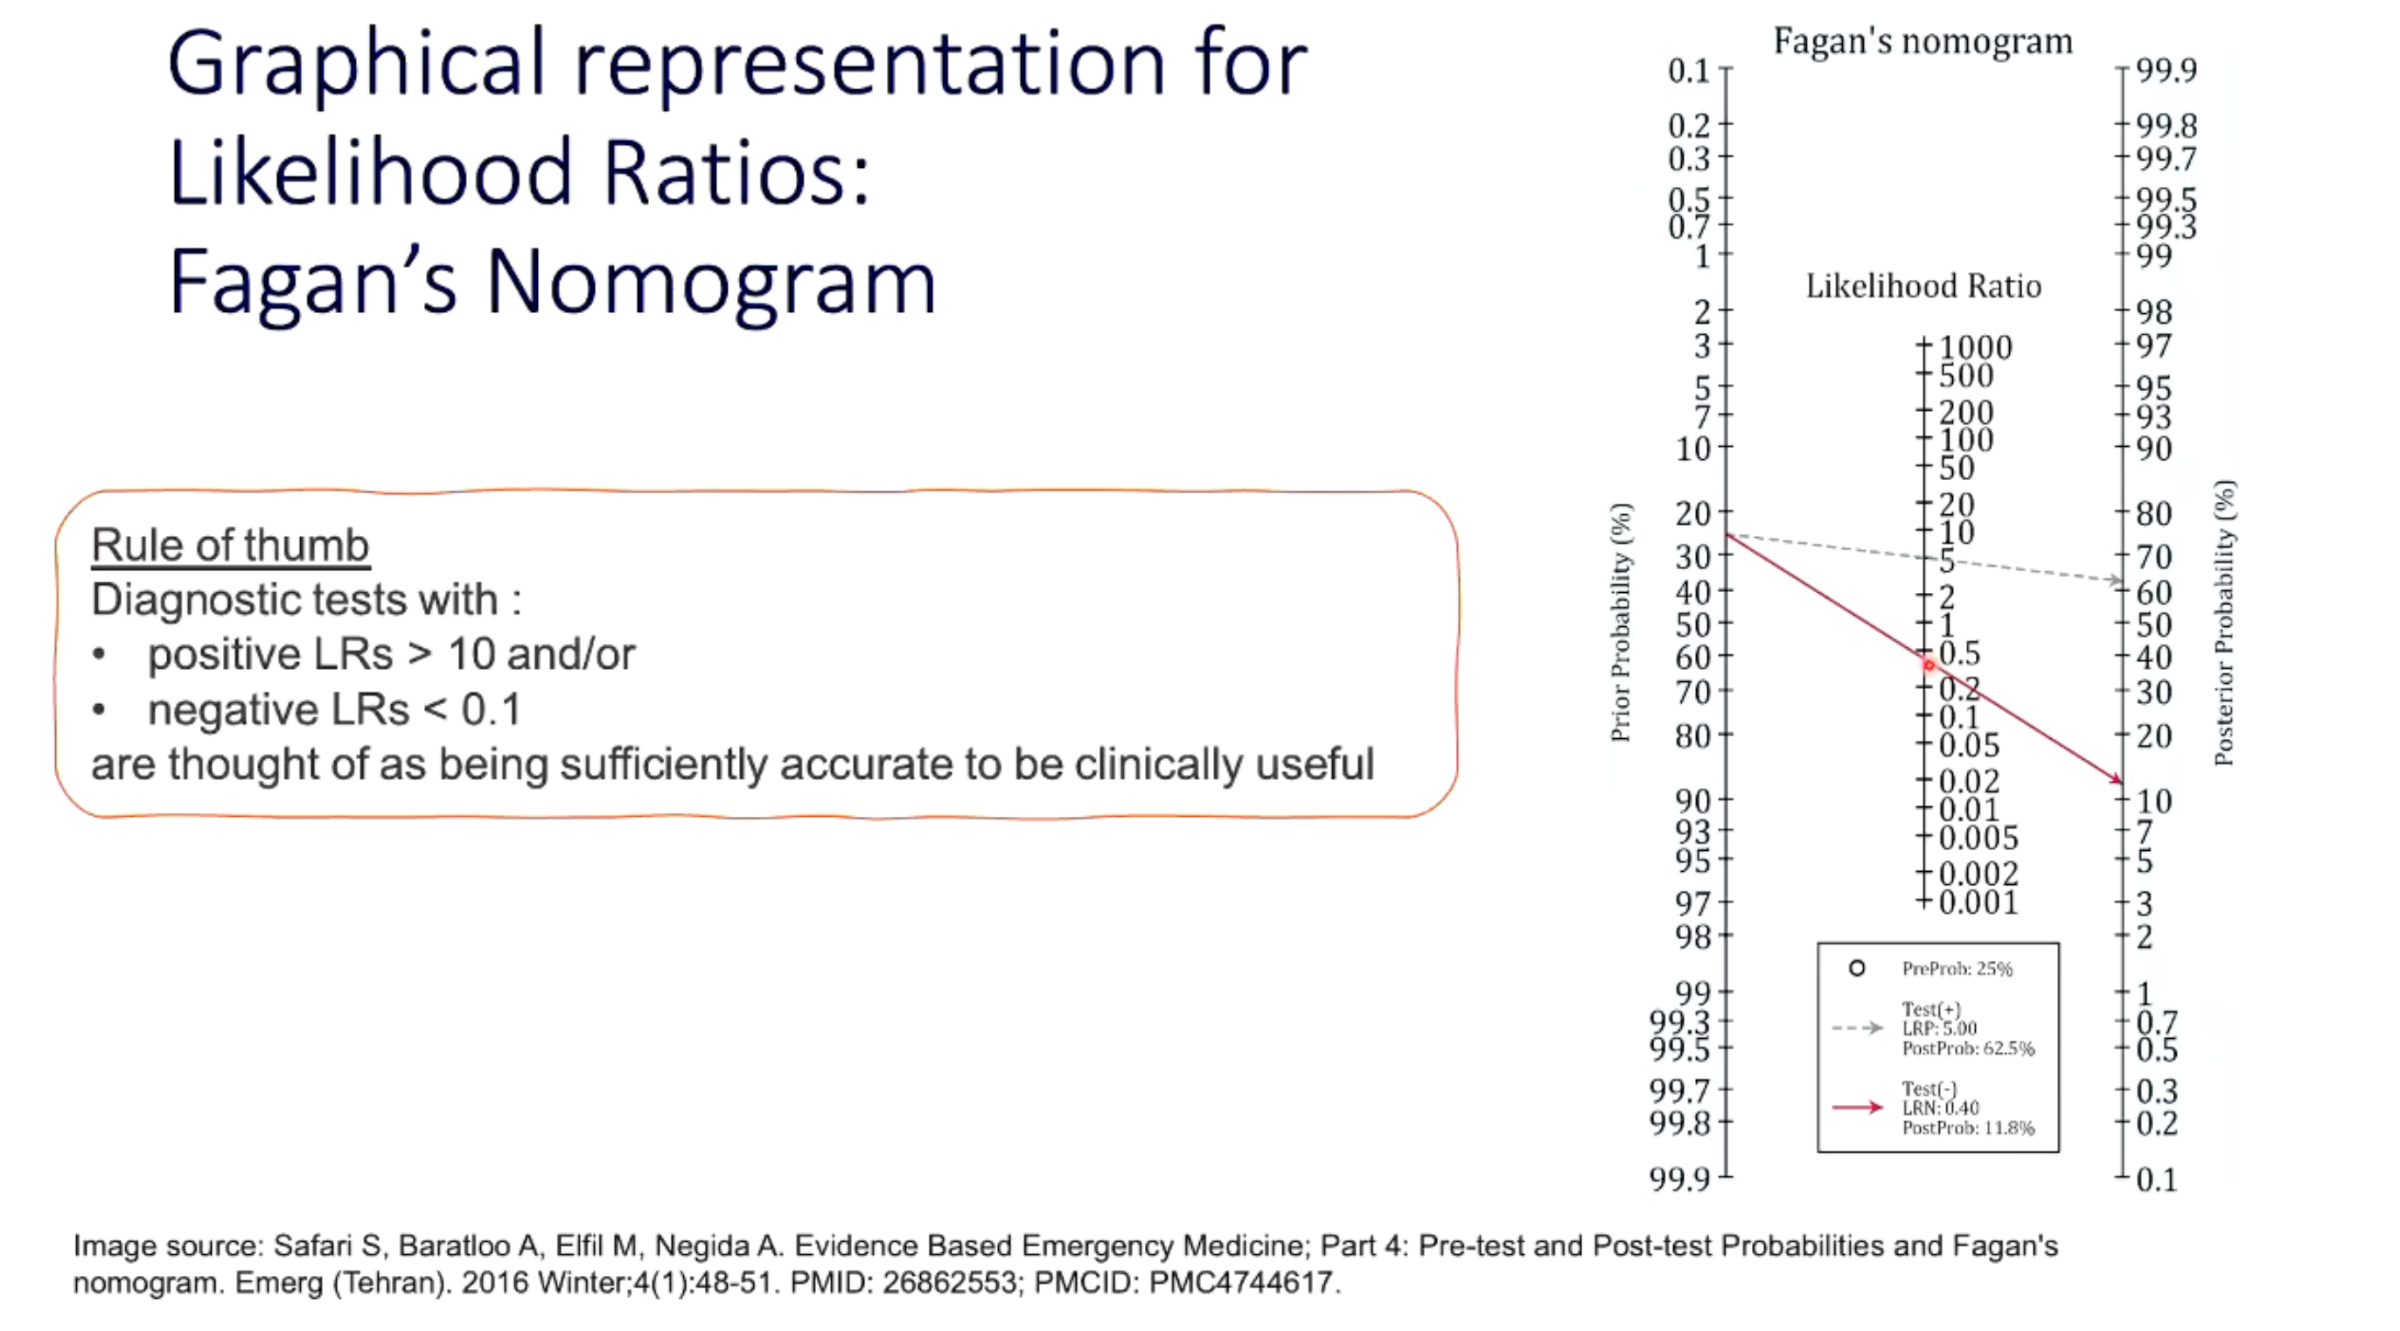
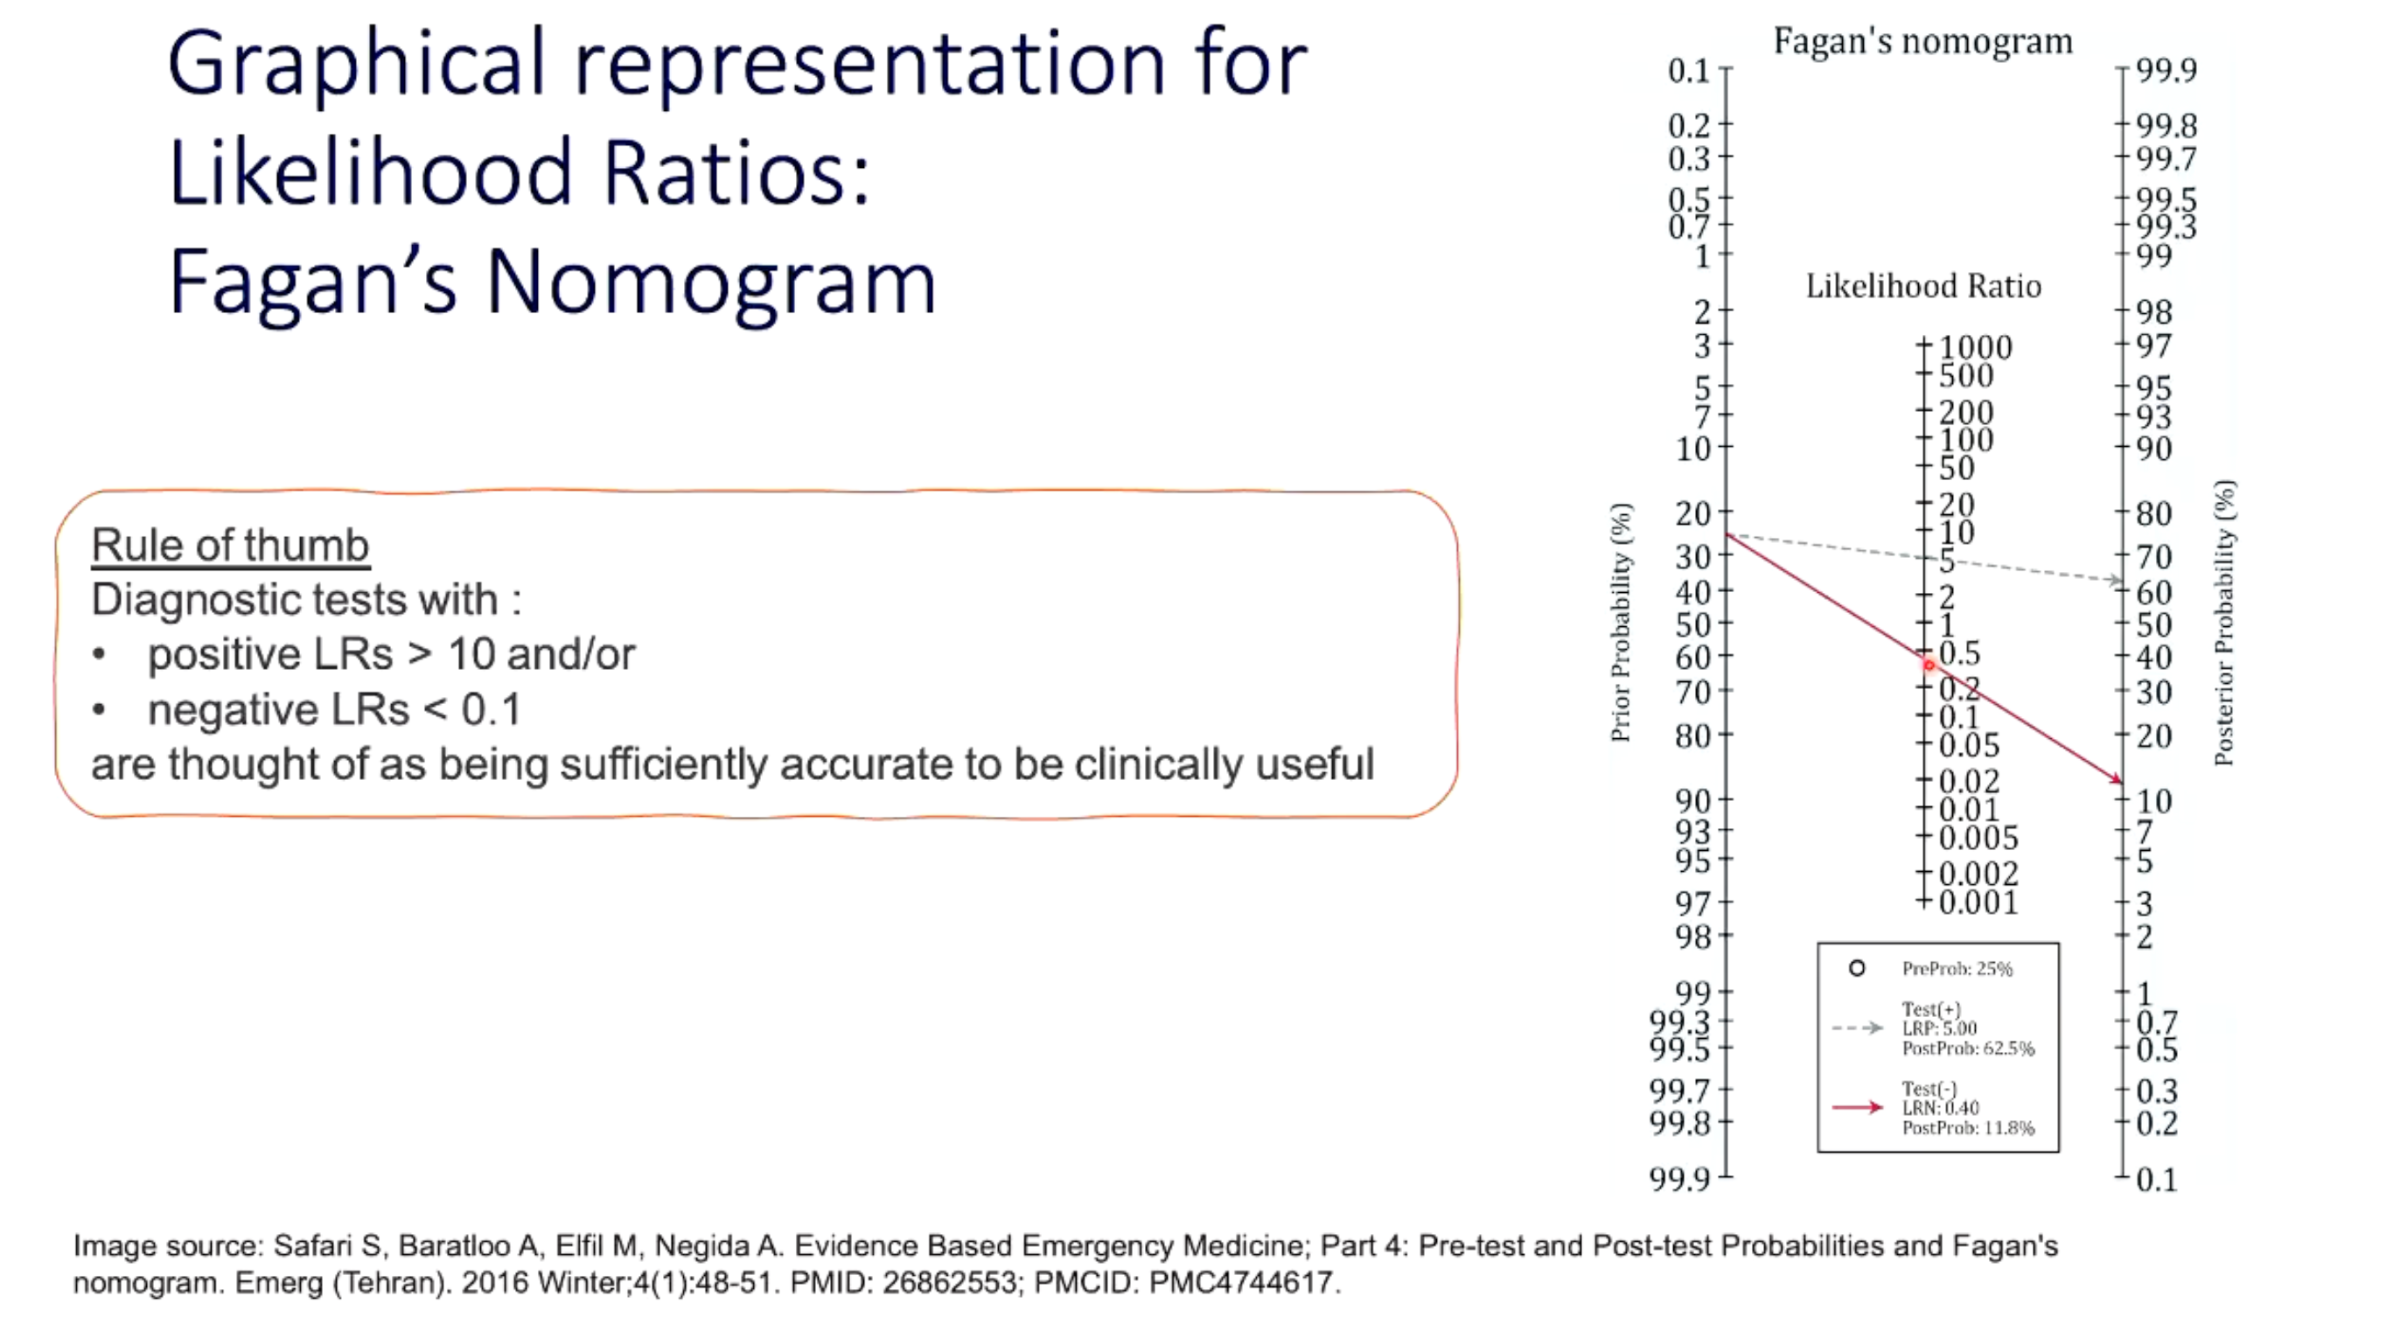
Likelihood ratios are derived from sensitivity and specificity.
They are not altered by disease prevalence in the same way as PPV and NPV.
They can also be applied directly to a patient's pre-test probability to estimate post-test probability.
How should positive and negative likelihood ratios be interpreted?
LR+:
The larger the value, the more strongly a positive result supports disease.
Rule of thumb:
LR+ >10 can provide a strong clinically useful increase in probability.
LR−:
The smaller the value, the more strongly a negative result argues against disease.
Rule of thumb:
LR− <0.1 can provide a strong clinically useful decrease in probability.

What is pre-test probability?
The estimated probability that a patient has the condition before the new test result is known.
It may be based on:
- Population prevalence.
- Signs and symptoms.
- Risk factors.
- Clinical history.
Example:
If disease prevalence is 20% and no other information is available, 20% can be used as a starting pre-test probability.
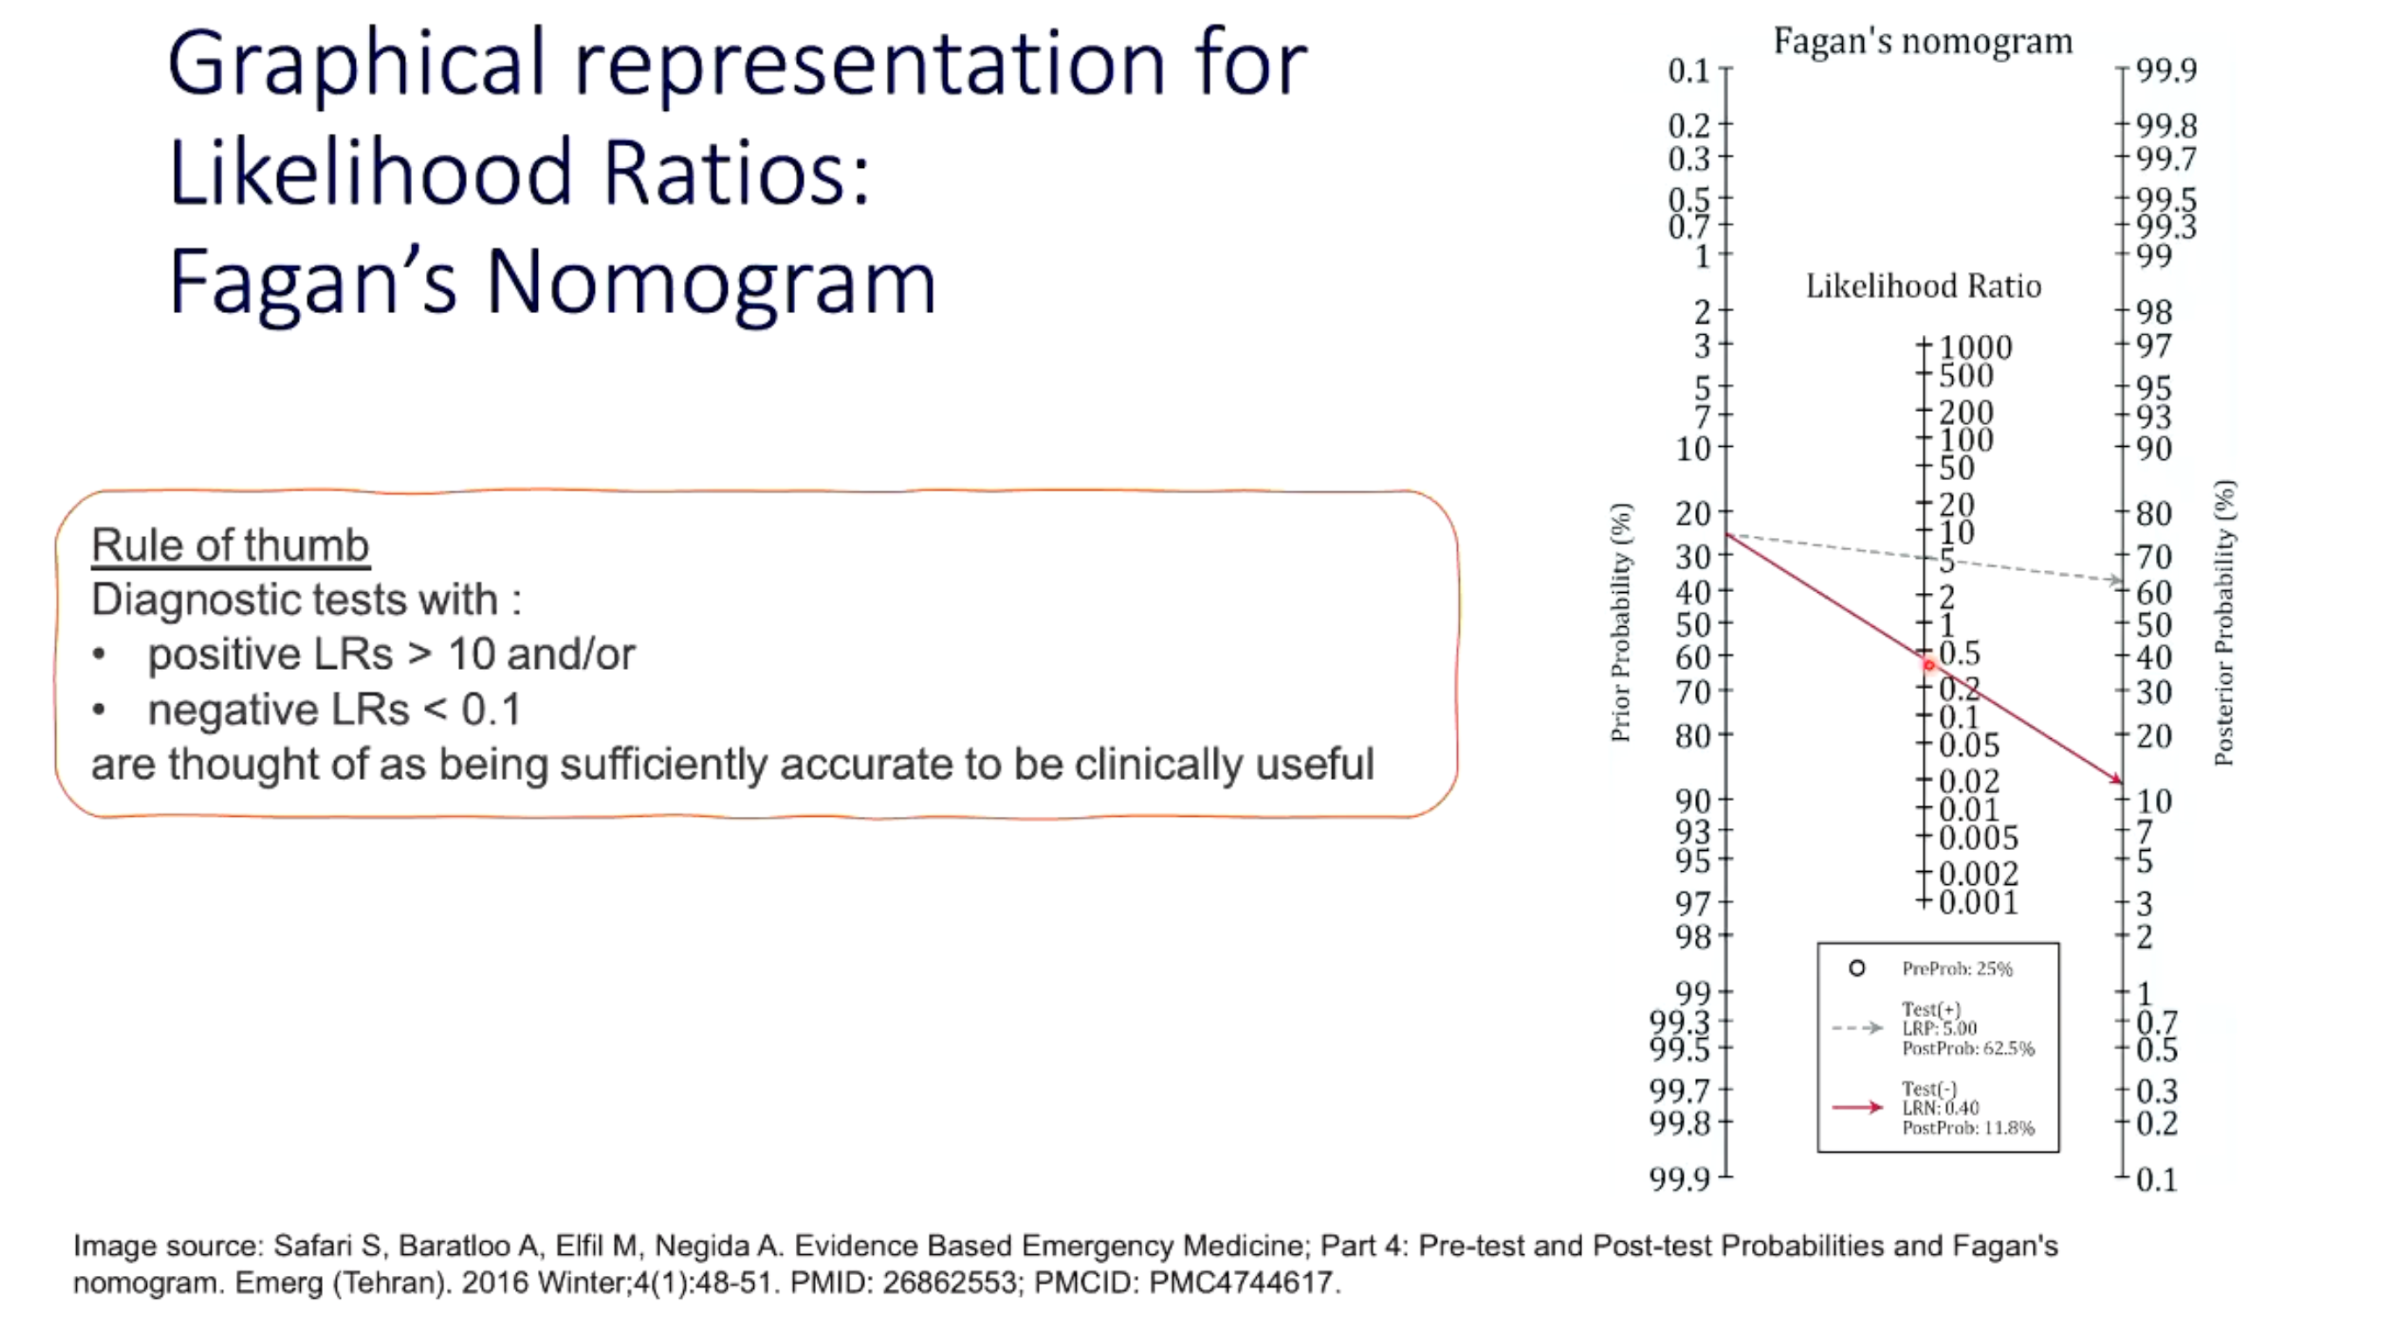
How can a likelihood ratio convert a pre-test probability into a post-test probability?
1. Convert pre-test probability to pre-test odds.
2. Multiply pre-test odds by the appropriate likelihood ratio.
3. The result is post-test odds.
4. Convert post-test odds back to a post-test probability.
A nomogram or calculator can perform the same conversion.

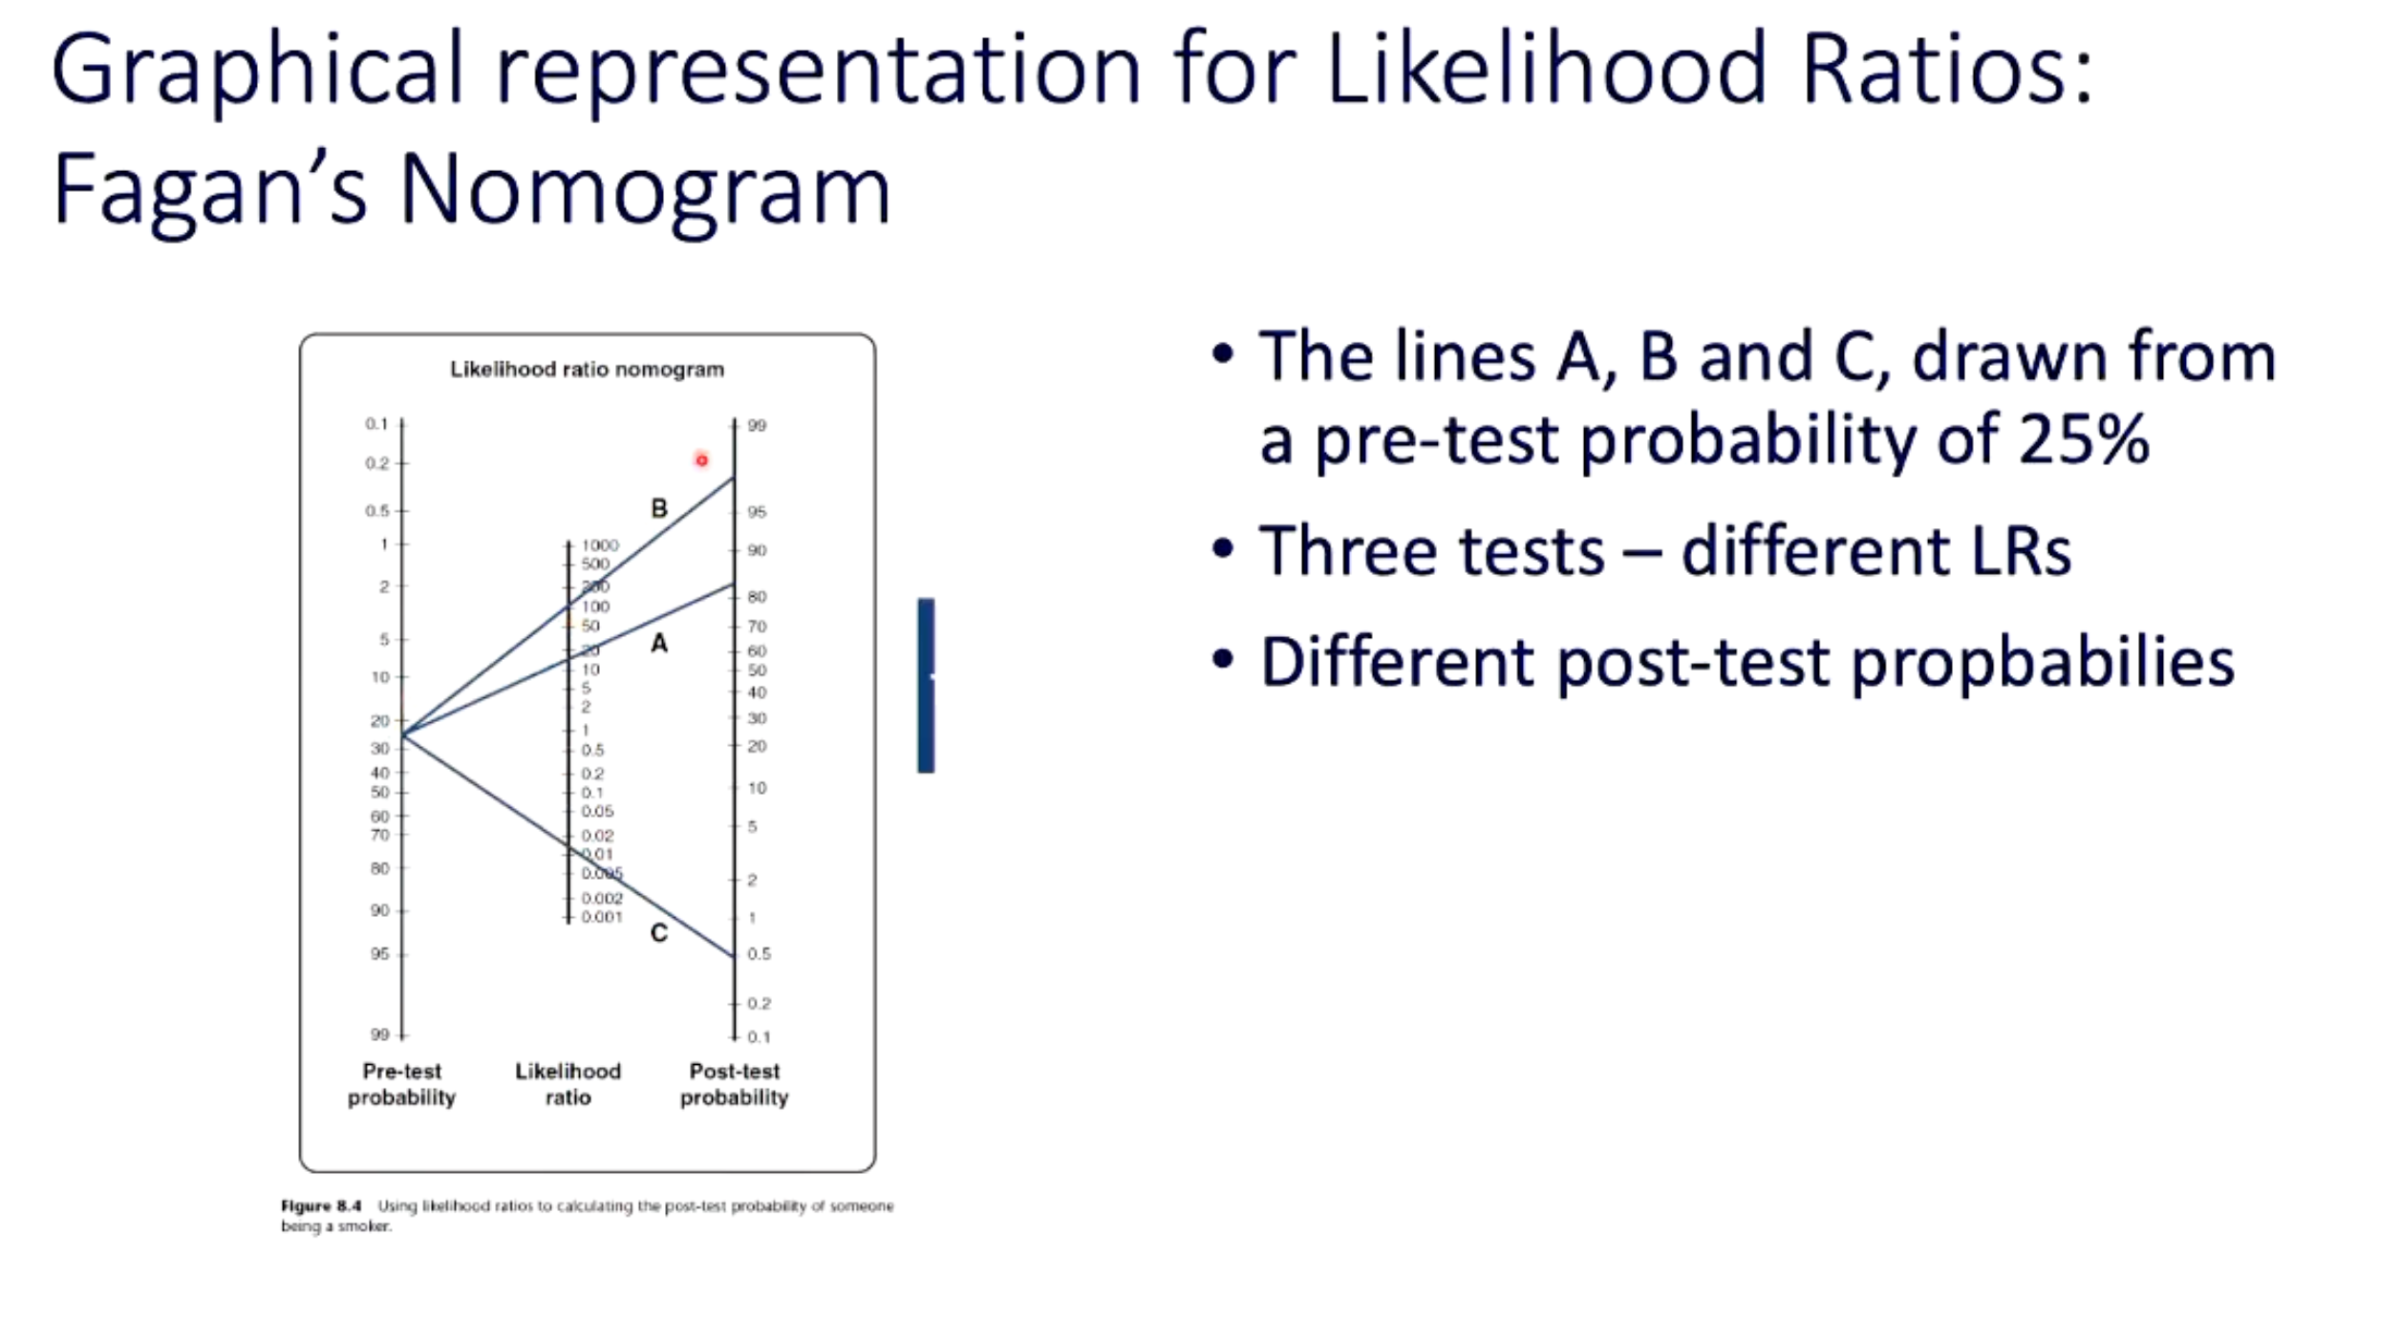
What did the lecturer's positive-likelihood-ratio nomogram example show?
A patient with a pre-test probability of about 25% and a positive test with LR+ ≈5 could have a post-test probability of about 60%.
The purpose of the example was to show how strongly a test result can shift clinical probability depending on its likelihood ratio.

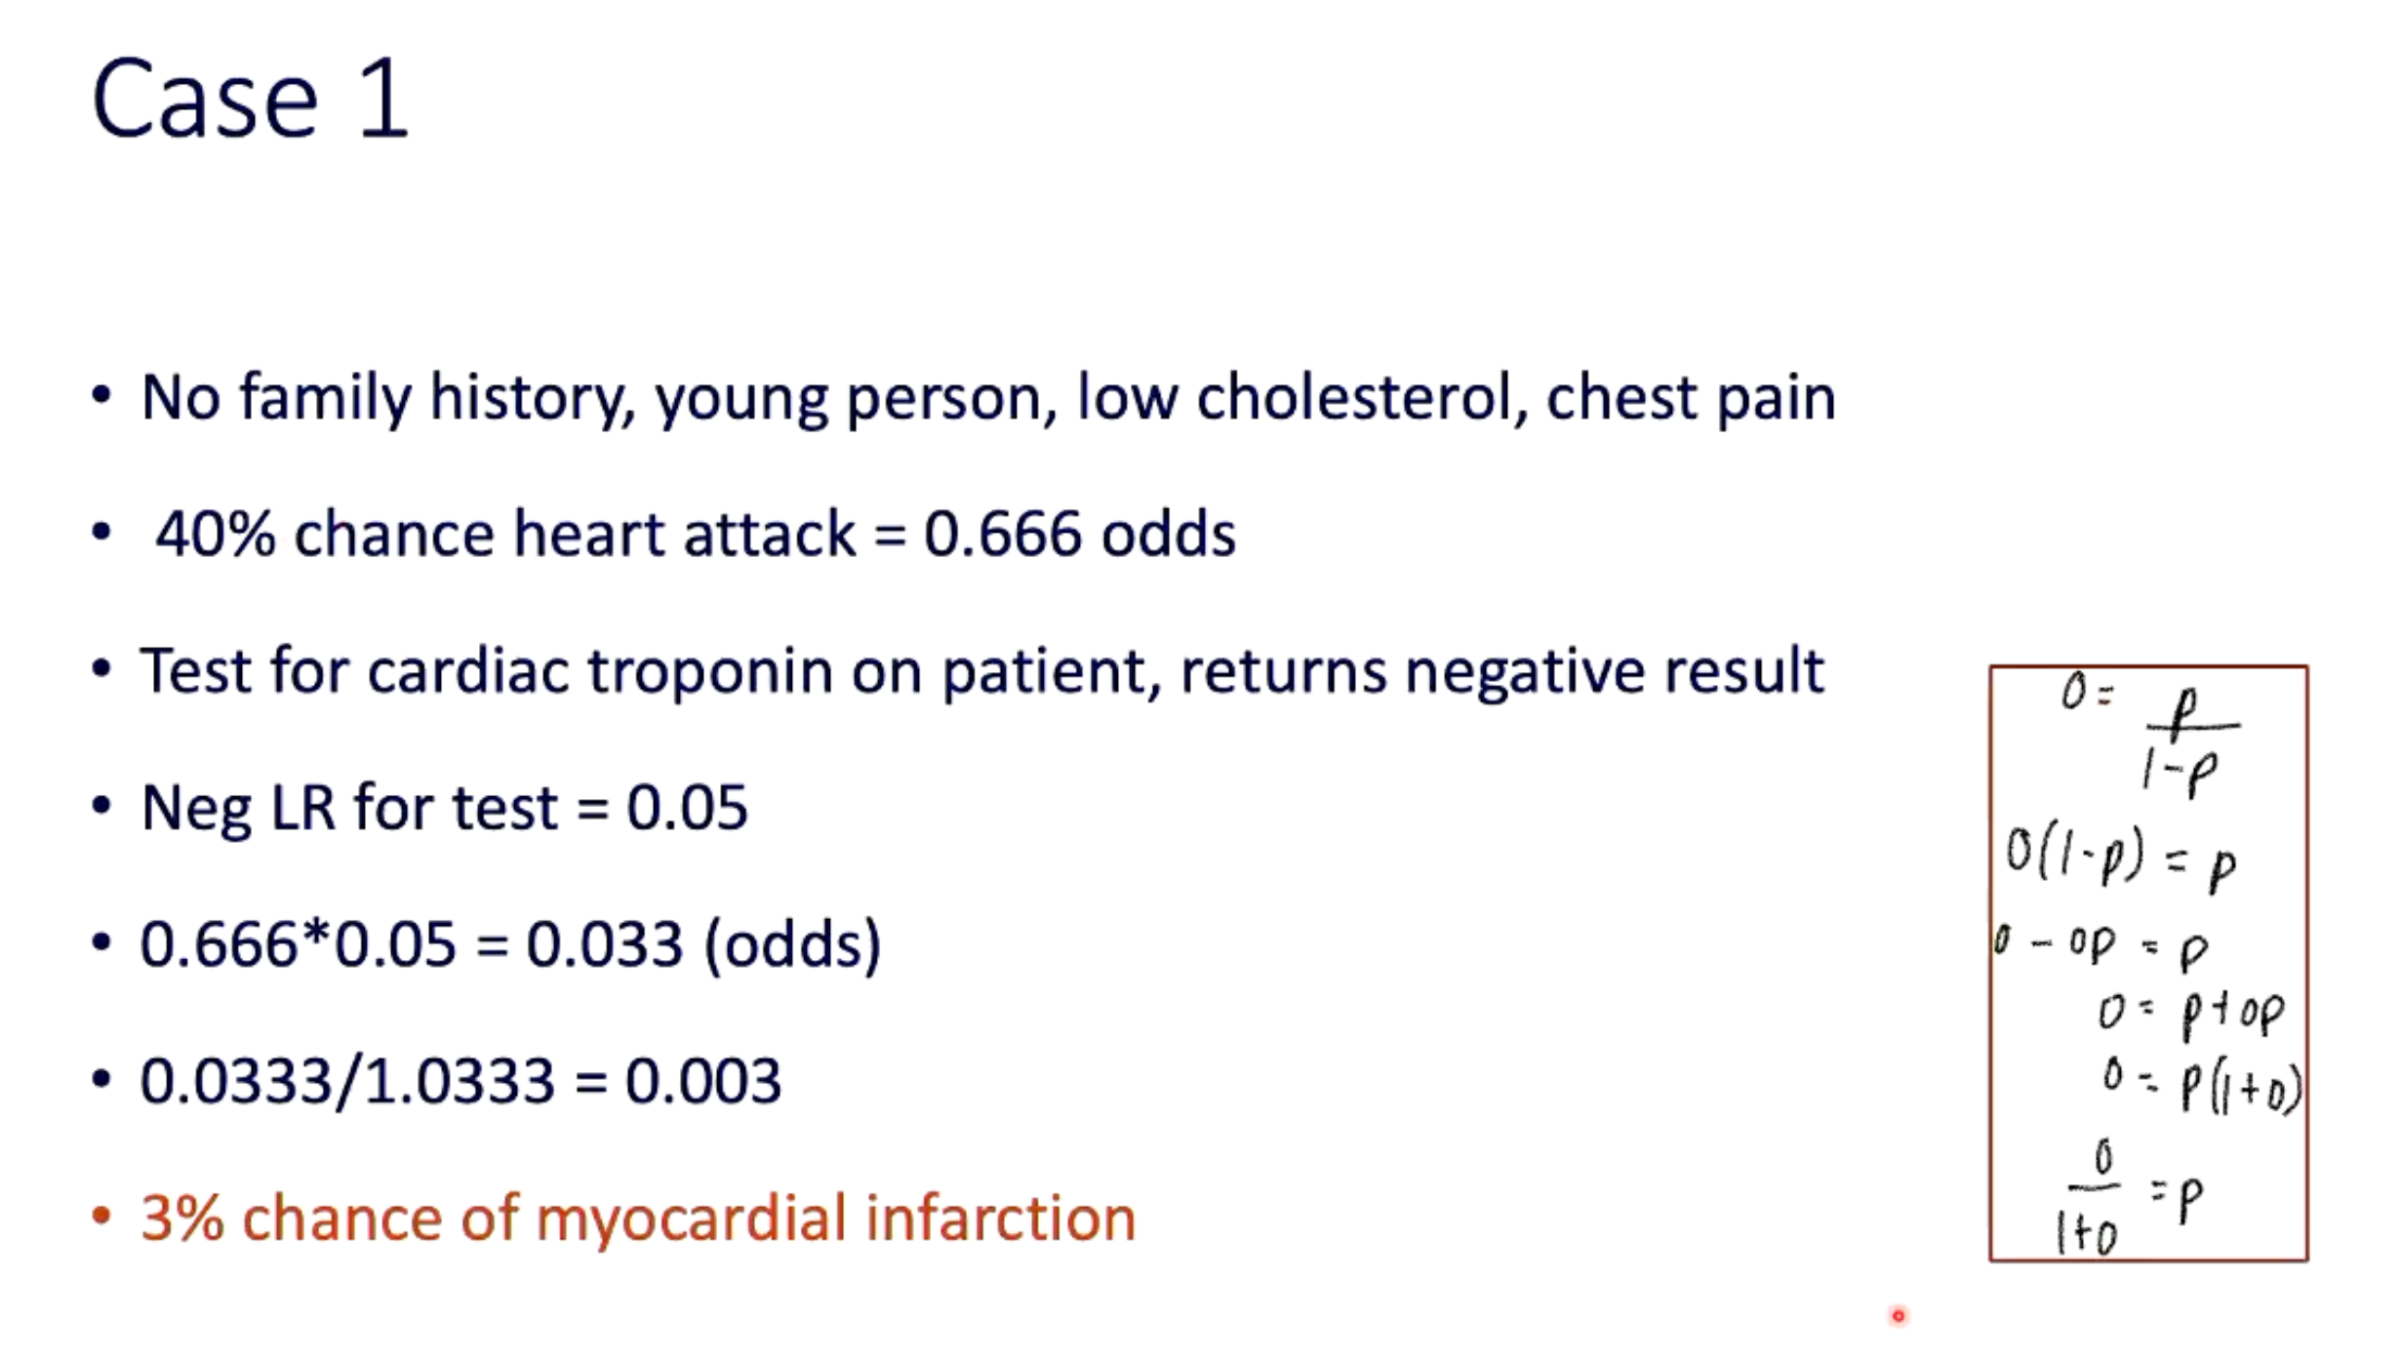
How did a negative troponin test change probability in the lecturer's lower-risk myocardial-infarction example?
Clinical starting estimate:
40% pre-test probability of myocardial infarction in a younger person with no family history and low cholesterol.
.
Convert 40% to odds:
≈0.66.
.
Negative troponin:
LR− = 0.05.
.
Post-test odds:
0.66 × 0.05 ≈ 0.033.
.
Converted back to probability:
≈3%.
.
Interpretation:
The negative result markedly reduced the probability of myocardial infarction.


How did the same negative troponin test behave in a higher-risk myocardial-infarction example?
Clinical starting estimate:
95% pre-test probability in an older person with family history, high cholesterol and chest pain.
Convert 95% to odds:
19.
.
Negative troponin:
LR− = 0.05.
Post-test odds:
19 × 0.05 = 0.95.
.
Converted back to probability:
≈49%.
Interpretation:
Despite the same negative test, the patient still had about a 49% estimated probability of myocardial infarction, so further investigation remained warranted.

What key principle do the two troponin examples demonstrate?
The same diagnostic result can have very different clinical meaning in patients with different pre-test probabilities.
A strong negative test can almost rule out disease in a lower-risk patient while still leaving substantial residual risk in a high-risk patient.
Lecturer emphasis:
Diagnostic tests must be interpreted in context, not in isolation.