AP Micro unit 2
1/106
There's no tags or description
Looks like no tags are added yet.
Name | Mastery | Learn | Test | Matching | Spaced | Call with Kai |
|---|
No analytics yet
Send a link to your students to track their progress
107 Terms
consumer surplus
amount ur willing to pay
found at price equalibirum Pe
consumer surplus rises when
price falls [Price ceiling is set or got lowered]
producer surplus
bare minimum a product must sell for
calculating producer/consumer surplus
consumer → area above equilibrium till demand curve
producer → area below equilibrium till supply demand
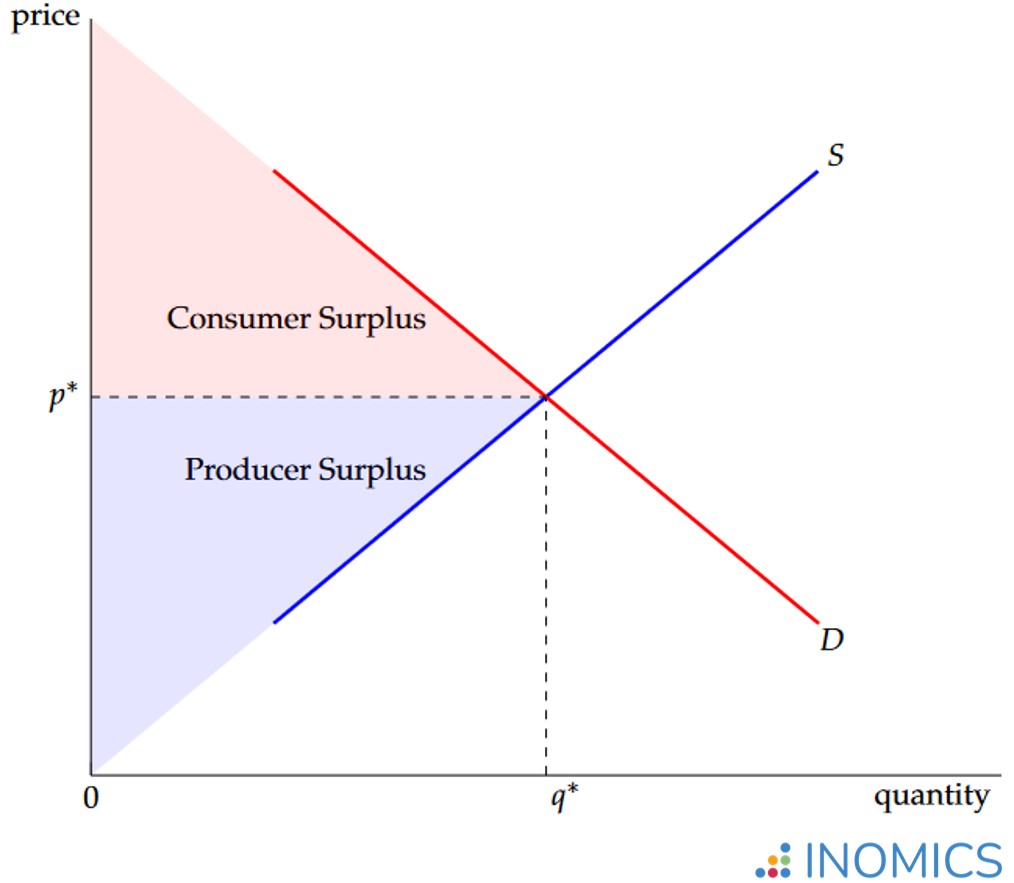
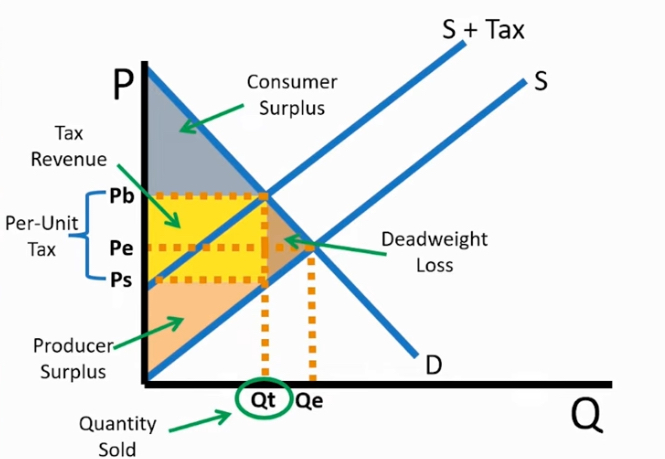
total/ Economic surplus
product surplus area + consumer surplus area [plus tax rev]
Allocation efficiency
when total surplus is maximized with no dead weight loss: found at equilibrium
calculating consumer surplus decreases
Cs1 - Cs2 = total Cs
Market Disequilibrium
when demand doesnt equal the supply
conditions in shortage
Qd > Qs → price is set below equilibrium
conditions in surplus
Qs > Qd → price is above equilibrium
determining graph when price increases or decreases
in market disequilibrium
graph de/increase of demand/supply curve
re-graph equilibrium
the new quantity is considered Qs [quantity in supply] and compare it to Qe
double shift in market disequilibrium
indetermanite = increases then decreases
[or vise versa]
in/decrease = if it occurs twice
get pic from yt
Individual to Market Demand
add up all the individual Qd for each column and keep the price
Demand Vs Quantity Demand
demand
is the entire slope demand or table demand
A shift in price DOES NOT effect this kind of demand
Demand Vs Quantity Demand
quantity demand [Qd]
a specific quantity at a certain price
a shift in price =Qd is shifted up or down the slope
Determinates of Demand
*what shifts demand
taste and prefrence
market Size
Price of related goods
change in income
expectations
Determinates of Demand
taste and prefrence
The popularity of the product going going up or down
Determinates of Demand
market size
an in/decrease in the number of buyers/population
Determinates of Demand
price of related goods
substitutes → an increase in price of good A causes a increase in demand of good B [and vice versa]
complements → noting peanut butter and jam need each other: cheaper jam means buying more peanut butter, expensive jam = less peanut butter
Determinates of Demand
change in income
normal goods → think of as the expensive brand, as wage goes up = demand goes up
inferior goods → think of as cheap brand,
as wage goes up = less demand
but as wage goes down =demand goes down
Determinates of Demand
expectations
expected price drop in the future =
decrease in demand
expected price increase in the future =
increases demand
Demand general definition
as price goes up = qd goes down
MU goes down as u buy more so slope is downturned
as price goes up demand becomes less and less [vice versa]
Supply general definition
as price goes up so does Qs = more production
low price meand less Qs = less production
individual supply to market supply
same as demand, add the individuals up but keep the price
supply vs Qs
supply → price DOESNT change supply
Qs → price does change qs
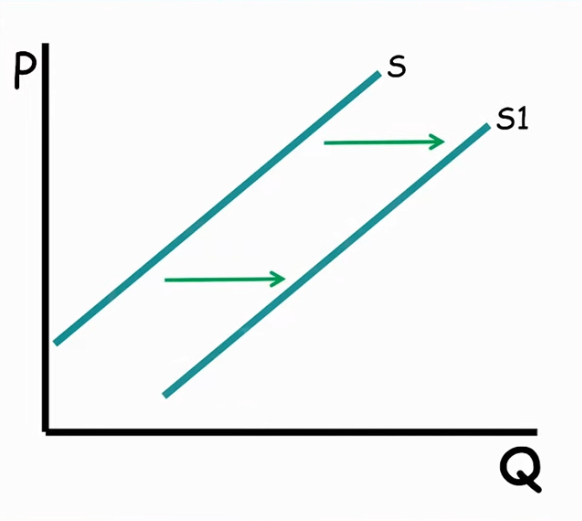
Increase in supply
a shift to the right
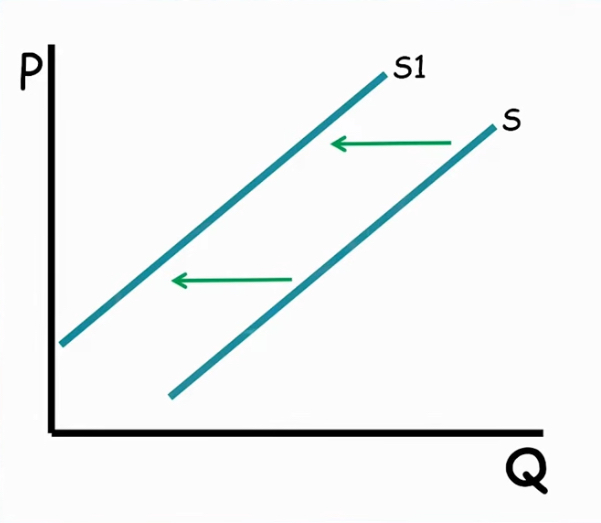
decrease in supply
shift to the left
Determinates of Supply
in the short run
input prices
government tools
number of sellers
technology
price of other goods
Determinates of Supply
Input prices
production cost goes down
[all prices have more qs]
EX→ as the price of fertilizer [ability to produce] goes down, farmers will plant more wheat.
but if it goes up, they will plant less wheat
Determinates of Supply
Government tools
taxes: increases cost of production = less produce
subsides: government paying = encourages more produce
regulations: decreases production [banning smth]
Determinates of Supply
Number of sellers
more farmers = more production
less farmers = less production
aka more or less labor
Determinates of Supply
technology
increases productivity = more production
Determinates of Supply
prices of other goods
strawberries dropped in price = farmers will make less strawberries due to its reduction in revenue → moving to wheat increase for more profit
Price elasticity of supply
definition
how sensative consumers are to the change in price
Price elasticity derminantes
an item is a necessity, has few substitutes or is cheap
Demand is inelastic
Price elasticity Derterminintes
an item has many substitutes or is luxury
Demand is elastic
Price elasticity Derterminintes
shape of demand slope
steeper [vertical] = inelastic [as price increases drastically qd changes slightly]
wider [horizontal] = elastic [as price increases qd changes drastically]
Total Revenue relationship
Price decreases → Inelastic Demand
TR decreases
no change in TR when
Unit elastic
Total Revenue relationship
Price decrease → elastic Demand
TR increases [bc they stretch in motion]
![<p>TR increases [bc they stretch in motion]</p>](https://knowt-user-attachments.s3.amazonaws.com/cfc65e9f-ac42-4f22-9a6f-492da9c66d0f.jpg)
TR with Marginal Revenue + rule for all downward sloping D
when MR hits the x-axis
we have reached unit elastic
top = elastic
bottom = inelastic

Marginal Revenue and TR relationship
if MR is + = elastic
if MR is 0 = unit elastic
if MR is - = inelastic
note:- its just called that dont think too hard curve doesnt change, only in name
determining graph when price increases or decreases
tax, subsidy, and Regulations
shift the supply curve
find new Qe = Qd
find Qs by continuing from same price to new supply curve
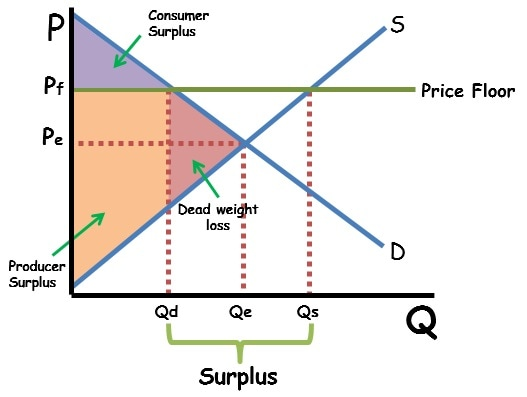
Price flooring Definition
government imposes minimum price on product to sell for
Price ceiling Definition
government imposes max price of product set to sellers
Price floor binding
Pf must be placed above equilibrium
if not → non-binding or false
binding price
a market cant adjust naturally to equilibrium
leads to DWL
the market is affected
Pc or Pf is non-binding
Market is unaffected
Pf creates a
Surplus bc Qs > Qd
Pc creates a
Shortage bc Qd > Qs
How to graph Pc or Pf
Draw line across
Qd is found after hitting the demand slope and downwards
Qs is found after hitting the slope curve then downwards
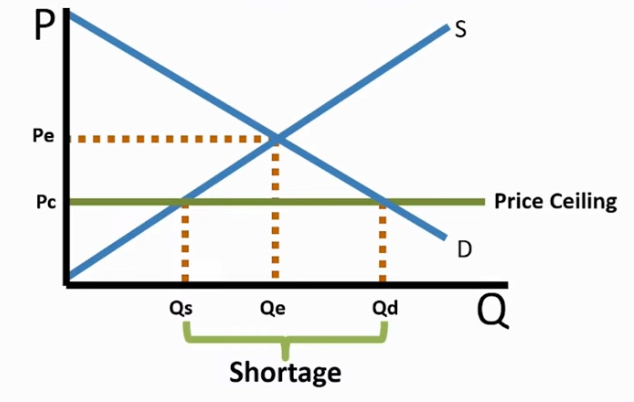
price ceiling binding
Pc must be below Pe
if not → is non-binding or false
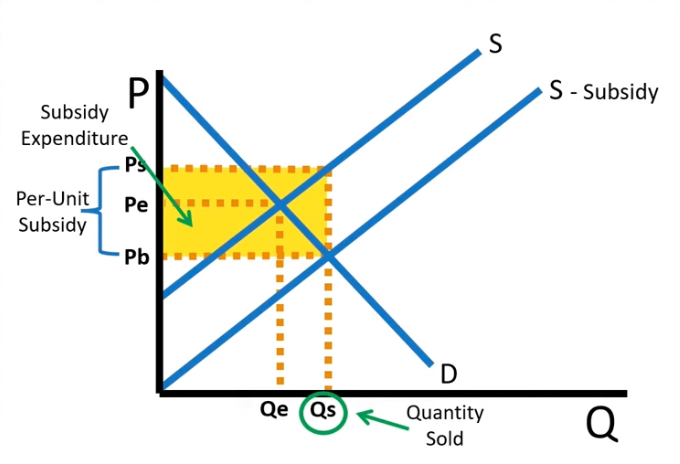
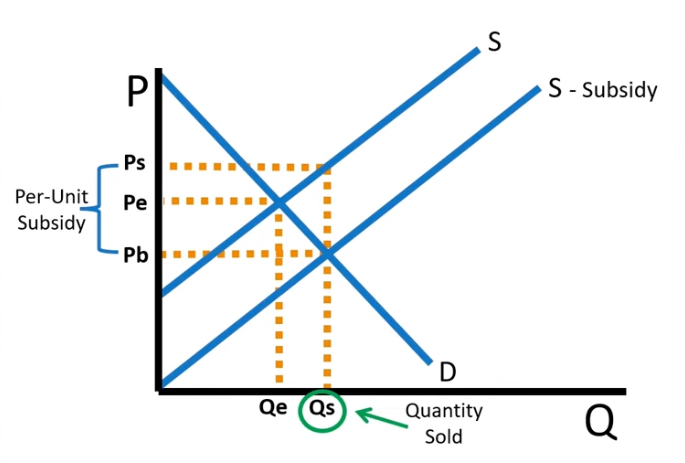
subsidies
Subsidy Expenditure
Found by multiplying Qs by per unit subsidy
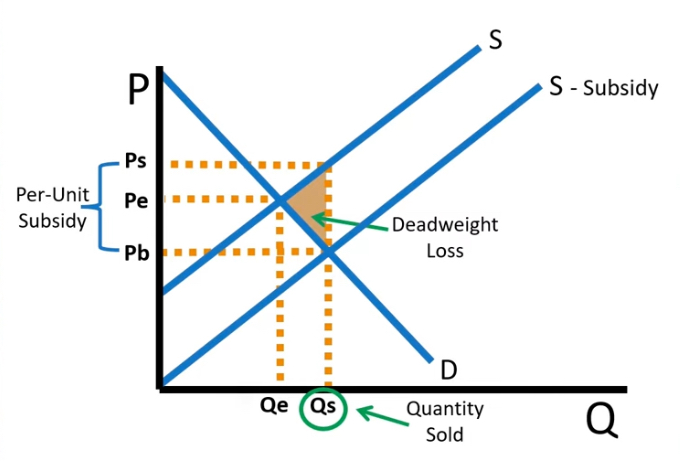
subsidies
Find DWL
Found using
per unit subsidy times Qs - Qe times 1/2
what occurs to the supply curve after a subsidy
a shift to the right
when a tax is added to the price
the supply curve shifts to the left
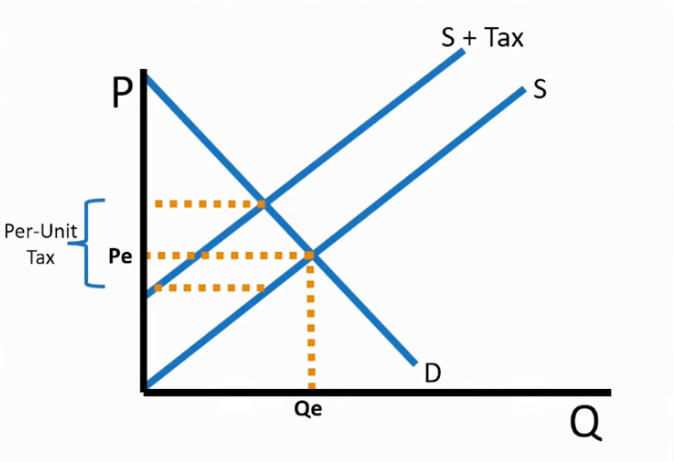
Tax overall graph
Cs and Ps got smaller = economic surplus decreases
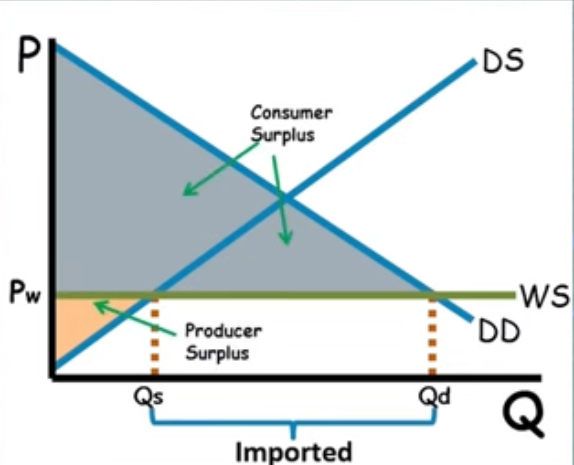
Import Quota
limit on quantity of a good that can be imported
Autarky [price]
a country at equilibrium doesnt trade
PW
world price [pre-tax and tariffs]
Usually under Pe
CS/PS when Pw is charted
cs increases
ps decreases

CS/PS when Pw +tariff is charted
cs: still bigger but decreases
ps: still smaller but increase
→ still graphed under Pe
World trade
World price that is below Pe
The difference between Qd and Qs is the amount of imported goods.
Qd>Qs

World trade
Increases economic surplus (bc cs or ps got wayyy bigger)
World trade
World price above Pe
There will be an export of Qs - Qd
Qd < Qs

World trade
World price + tariff → find tax revenue
includes both PW and PW + tariff in order to find
Multiply (Pw + tariff - Pe) with new tariff (Qd - Qs)
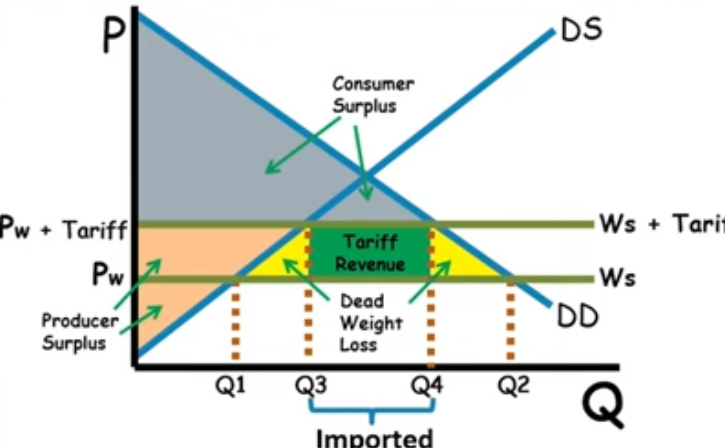
World trade
Tariff effect on trade
decreases Economic surplus
Creates Dead weight loss
PES Elasticity [Coefficients] for Supply
Formula
Change in % Q supply / change % in price
→ only way to determine elasticity via numbers
Price of elasticity
Relatively Elastic
Curve of supply (y-intercept) is Greater than 1
Price of elasticity
Unit elastic
Curve of supply (y-intercept) is Exactly one
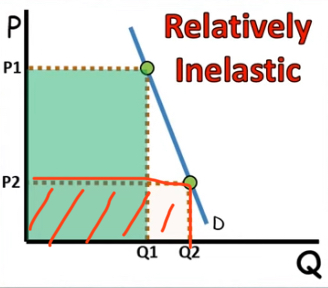
Price of elasticity
Relatively Inelastic
The supply curve (y-intercept) is less than 1
Price of elasticity
Perfectly Elastic
The supply curve is horizontal
Elasticity Coefficient is infinite or undefined
Price of elasticity
Perfectly inelastic
A vertical supply curve with one quantity at any price
Elasticity Coefficient = 0
Cross Price Elasticity
Change in percent Quantity Demand of Good A /change in percent of price of good B
→ DEMAND EFFECTS PRICE YOU CANNOT CONCLUDE THAT THE PRICE OF PRODUCT A EFFECTS PRICE OF GOOD B DIRECTLY YOU MUST FIRST DETERMINE SHIFT IN DEMAND
Income Elasticity
Positive Coefficient
A normal good (more money more expensive stuff)
Income Elasticity
Negative coefficient
Inferior good (money goes down so cheap items bought are more)
Cross price elasticity
definition
How the price of one good changed Qd of another
Cross price Elasticity
Positive coefficient → jelly prices go up
Is therefore a substitute good (one cost goes up so the other gets bought more)
→ honey demand goes up
Cross price Elasticity
Negative Coefficient → jelly falls in price
A complement good (one increases $ so does D of the other)
→ peanut butter demand goes up
Economic surplus only increases when
When Pw is set in place below or under Pe
When u maximize efficiency by returning to Equilibrium
Pc and Pf when binding cannot
be moved up or down when ur asked in a Question
World Trade
country is an importer
their Qd > Qs = Pw is under Pe
World Trade
country is an exporter
their Qd < Qs = Pw is over Pe
Price elasticity of SUPPLY
using the same formulas as elasticity coefficient
same elasticity types as demand
Elastic coefficient formula
[new - old] / old x 100
aka percent change formula
Income elasticity formula
change in % Q / change in % income
“quit a job that pays 25k a yr per yr, what is the o.p.c after for 5 yrs”
multiply money lost with time
Price elasticity
Qs vs Qd
Qs: you cant use the TR and price relationship
“10% increase in price resaults ina what percent increase for Qs?” w a previously mentioned coeff
increase is the proper term but doesnt mean we went up in original number just plug in the numbers
→ x% /10 % = 2
notes:- the coeff can relate to two equations
World Trade
What do consumers/producers pay
free trade: At Pw
with traiffs: pw +t
“2 hours of labor for one unit of good y”
“2 units of good x with one hour of labor”
Determine input or output
top = input
bottom = output
→ pay attention to first unit not the second mentioned
Price elasticity
absolute value coefficient
if the coeff given is absolute u will determine increase/decrease by prior given info u determine will the demand/price go up or down
Marginal utility formula
change in Total Utility / change in Q
Quantity sold/exchanged
price floor
is the Qd
→ doesnt increase
Quantity sold/exchanged
price ceiling
is the Qs
→ doesnt increase
Once a shift in supply or demand has taken place what occurs
an increase/decrease in total economic surplus
change in equilibrium
price elasticity of supply
determinintes
all things bc more elastic as these increase
Time
Easier to get inputs
easier to move resources
extra space
can be well stored
price elasticity of demand
determinintes
all things bc more elastic as these increase
more substitutes
luxuries
income
longer time to adjust
narrowly defined markets [broad = inelastic]
[5 → mint ice cream is direct and has subs but just food is broad and few subs]
“No trade in world trade/imports”
Producing at equilibrium
It's a movement along demand if:
→ and definitely not cross price when:
They mention elastic / inelastic
They say price increases
They do not mention another good
They do not mention costs or production