Welfare, Public Good, Externalities
1/46
There's no tags or description
Looks like no tags are added yet.
Name | Mastery | Learn | Test | Matching | Spaced |
|---|
No study sessions yet.
47 Terms
Fiscal Policy
concerns any decision regarding public spending (public goods and services and subsidies) and public revenue (taxation)
The Fiscal Policy is reflected in the Public Budget
Annual Law
Approved by Parliament
Binding for the Government
Main indicators used to assess Fiscal Policy are:
Public Deficit (% of GDP)
Public Debt (% of GDP)
=> ratio Public Debt/GDP => ratio of flow variables
=> ratio Debt/GDP => ratio stock variable/flow variable
Role of fiscal policy (FP)
It is a tool for supporting economic growth (demand-side policy/stabilization policy). Ensures economic stability during downturns by increasing government spending or reducing taxes.
It is a way to ensure the production of public goods according to the society's needs. Examples: National defense, public health, public transportation, etc.
It designs public policies aimed at correcting the spillovers of externalities (positive or negative) and reducing their spillover effects on individual markets. Example: pollution, vaccines, etc.
Systematically wrong or late Fiscal Policies can be a source of great instability (fiscal crisis, government defaults, etc.) that significantly harm people and firms' welfare.
Paternalistic gov
Basic assumption: citizens left to themselves might not act on their own long-term interest
The government decides to act for them.
Very common criteria underlying regulation:
Under-consumption of education
Lack of pensions at retirement
Lack of health insurance
Safety/security provisions
Expansionary FP
To stimulate the economy (increasing government spending or lowering taxes)
Contractionary FP
To cool down the economy (lowering public spending or increasing tax rev)
Neutral FP
If policy decisions on the spending side are compensated with decisions on the revenue side from the point of view of the final contribution to real GDP growth
Public Spending (G)
It represents the total amount spent by the government (national, regional, local, etc.) on goods, services, and public investments; expenditures on infrastructure, health, education, defense, social welfare, etc.
Stimulates Economic Growth: public spending on infrastructure and education increases productivity and creates jobs, driving economic growth.
Stabilizes the Economy: during recessions, governments use spending to boost demand (e.g., through public projects or unemployment benefits).
Redistributes Wealth: programs like social protection and subsidies reduce income inequality and poverty.
Improves Public Welfare: investments in health, education, and safety enhance the quality of life.
Influences Macroeconomic Indicators: public spending affects GDP, inflation, and interest rates, by shaping the economic environment.
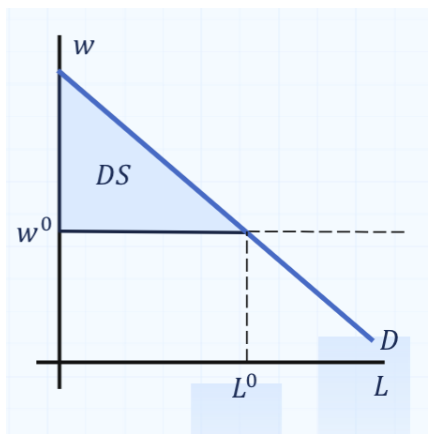
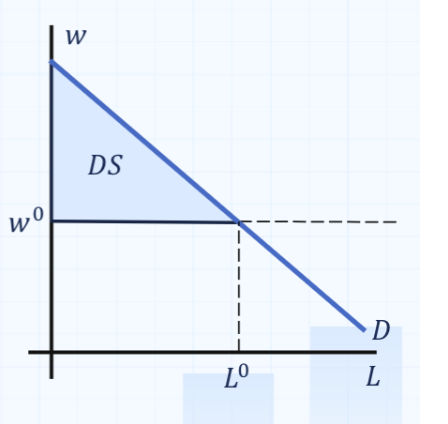
Demanders surplus (DS)
DS = Area between the demand curve and the equilibrium price line up to the equilibrium quantity
Demanders are typically households. However , in factor markets (labor, for ex), the demanders are firms.
The demand curve expresses the sequence of max willingness to pay (MWP), per unit, by the demanders in the market.
Ranking by the MWP per unit, we obtain the (downward sloping, linear or nonlinear) demand curve)
For a given price P0, the area between the demand curve and P0, up to the quantity Q0, is the measure of the demand surplus (DS) in the market.
In the diagram we present the case of a labor market, where the wage is W0 and the quantity of labor is L0.
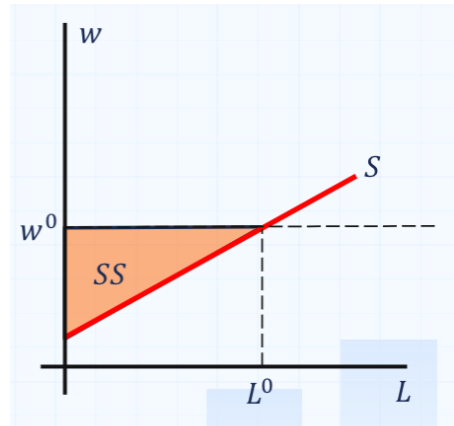
Supplier Surplus (SS)
SS = Area between the supply curve and the equilibrium price line up to the equilibrium quantity
Suppliers are typically firms. However, in factor markets (labor, for example), the suppliers are people
The supply curve expresses the sequence of minimum willingness to charge (MWC), per unit, by the suppliers in the market.
Ranking by the MWC per unit, we obtain the (upward sloping, linear or nonlinear) supply curve.
For a given price w0, the area between the price line w0 and the supply curve, up to the quantity q0, is the measure of the supplier surplus (SS) in this market.
In the diagram we present the case for a labor market, where the wage is w° and the quantity of labor is L0.

Total Surplus =
Total amount of welfare received by the demanders and suppliers
Deadweight loss
Welfare lost in the labor market by both suppliers and demanders because of the implementation of a binding minimum wage
Public goods
Non excludable and nonrival goods:
Because they are non excludable , it is difficult to get people to pay for them voluntarily
Because they are non rival, production costs do not significantly change additional users
There is no way for private firm to earn enough rev to create as much aq society wants
By taxing everyone and producing the public good, the gov can make people better off
Examples of public goods:
Disease prevention
National defense
Public Parks
Street lighting
Lighthouses
Firefighting services
Public libraries
National defense
Implications of Public goods
=> High fixed costs
=> revenues close to 0 (unless rev in a diff way)
Marg cost close to 0
Artificially scarce goods
=> excludable but nonrival
Markets can provide these goods but do so at an inefficient level
Wi fi: excludable and essentially nonrival
Private goods
=> excludable and rival
Most goods are private goods
Private goods can be efficiently provided in competitive markets
common resources
=> Non excludable but rival
Consumers cannot be excluded from consuming these goods, but when anyone consumes it, there is one less for everyone else.
There is a strong incentive to consume these resources before others
Two features
Excludable: People who don’t pay can be easily prevented from using it.
Example: A cheeseburger
Rival: The same unit of the good cannot be consumed by more than one person at a time (or at all)
Kinds of goods
A good is excludable if the supplier of that good asks for a price to prevent people who do not pay from consuming it.
A good is a rival in consumption if the same unit of the good cannot be consumed by more than one person at the same time.
A good that is both excludable and rival is a private good.
When a good is non-excludable, the supplier cannot prevent consumption by people who do not pay for it.
A good is nonrival in consumption if more than one person can consume the same unit of the good at the same time.
A good that is both non-excludable and nonrival is a public good.
Who provides a public good ?
The government doesn't always get involved-in many cases a nongovernmental solution has been found for the free-rider problem.
Some public goods are supplied through voluntary contributions. (private donations support a considerable amount of scientific research). But private donations are insufficient to finance huge, socially important projects like basic medical research.
Some public goods are supplied by self-interested individuals or firms because those who produce them can make money in an indirect way. The classic example is broadcast television, which in the United States is supported entirely by advertising.
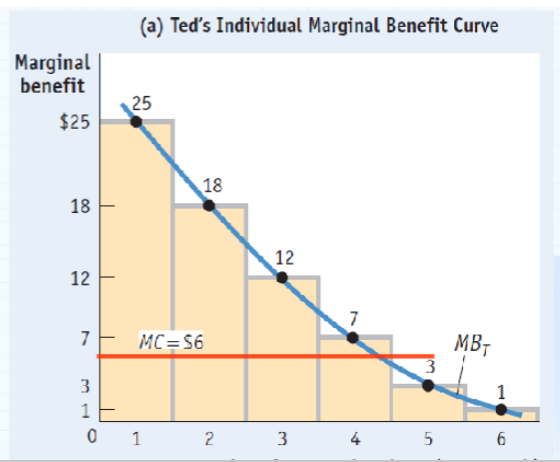
Private position of PG
The greatest quantity for which MB ≥ MC is Qt* = 4 street cleaning per month
In many cases, we cannot rely on individual self interest to yield provision of an efficient quantity of public goods
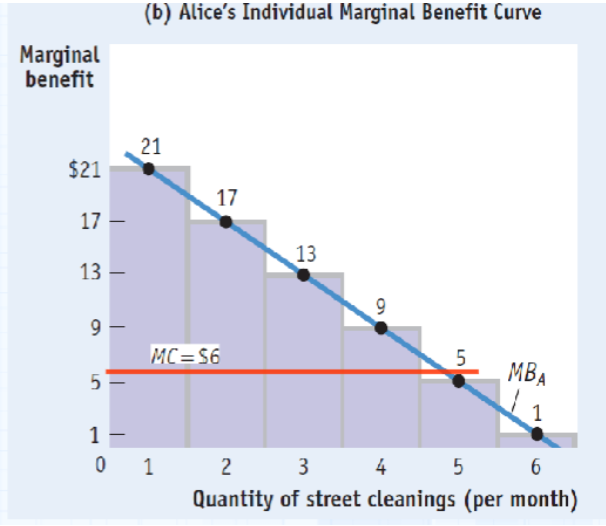
Imagine a city in which there are only two residents, Ted and Alice. Assume that the public good in question is street cleaning
Ted is considering to pay entirely for a (private) provision street cleaning in her area, entirely based on his MWP (measure of his benefit), described by the blue curve below
Assuming that the marginal cost of each street cleaning is constant at MC = $6, what is the number of street cleanings per month he optimally decides to provide the her community
Optimal provision of PG
Should provide the quantity where the gap between benefit and cost is maximum.
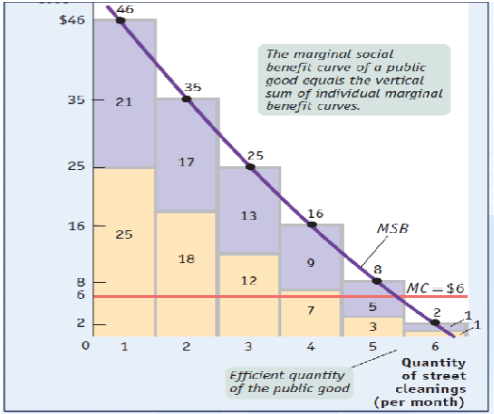
Marginally speaking, it should produce the greatest quantity of public good for which MSB ≥ MC (Lindahl solution):
MSB = MSC or Marginal Social Benefit = Marginal Social Cost
Where the MSB is the sum of the MWP of all the users of the public good, while the MSC is just the marginal cost of production of the public good.
Lindahl solution and under provision, Ted and Alice ex
The diagram also shows why we cannot rely on individual self-interest to yield provision of an efficient quantity of public goods.
Suppose that the city currently did 4 street cleanings (i.e. one less than the efficient quantity) and that either Ted or Alice was asked to pay for the 5th cleaning. Neither one would be willing to pay for it!
Ted would personally gain only the equivalent of $3 in utility from adding one more street cleaning-so he wouldn't be willing to pay the $6 marginal cost of another cleaning. Alice would personally gain the equivalent of $5 in utility-so she wouldn't be willing to pay either.
Without government provision, there is less than the efficient number of cleanings.
The problem of providing public goods calls for government intervention which provides a way for citizens to tax themselves and finance the provision of the public good.
But imagine a city with a million residents, each of whose individual marginal benefit from provision of the public good is only a tiny fraction of the marginal social benefit…
Free riding on non excludable goods
In the case of the government provision of a public good, how much should a person contribute to the public financing of a public good ? Ideally, he/she should contribute by paying taxes proportionally to his/her maximum willingness to pay (MWP) for the good
However, when asked to reveal his/her MWP the individual has the incentive to underreport, since it determines how much taxes he/she will have to pay.
Many individuals are unwilling to pay for their own consumption and instead will take a free ride on anyone who pays.
Free riders disrupt market efficiency.
Enough free riders can cause a non-excludable good to be underprovided by the market.
Externalities
An externality is the side effect of the activity of an economic agent (firm, household, or government) that affects a third party who is not directly involved in the action and that is unpriced (that is, not accounted for in the market price).
These effects can either be generated by production or consumption activity, can either be positive or negative, and occur due to the actions of individuals, firms, or governments.
=> significant concept in economics because they can lead to market failures, where a market does not allocate resources efficiently
=> instance were a market lacks => people hurt by the externalities (MEC)
Consumption vs production externalities
Consider who in the market is generating the external effect
Consumption externalities
Arise from the demand for goods or services, when the act of consuming by someone directly affects the well being of others
Example: Getting vaccinated can be considered a consumption externality because it reduces the spread of contagious disease benefiting the wider community and the cost of the health care system. Cause = smoker (demand of health care services). Market = Health care
Production Externalities
Occur when the production/sale process of a good or service impacts third parties. Production externalities can affect the environment, public health, or other businesses or households.
Example: A paper-producing factory emitting pollution into a river is an example of a production externality because it contaminates water used by downstream communities and harms aquatic life. The affected market is the market for paper.
Negative Externalities
Adverse effects (costs) or third parties due to economic activities. => Typically result in social costs that exceed the private costs borne by the producers of a good.
Example: Air pollution from vehicles is a negative externality because it contributes to environmental degradation and public health issues, such as respiratory problems, which are not accounted for in the price of cars. This is an externality in the market for cars.
Postive Externalities
Occur when economic activities result in benefits to third parties that are not reflected in the market prices. => lead to social benefits that exceed private benefits
Example: Education is a positive externality because it not only benefits the individual who receives the education (by increasing their earning potential) but also benefits society by creating a more informed and productive workforce. The market where the externality displays its effects is the labor market.
Marginal private cost (MPC)
Is the marginal cost borne by a firm when producing one extra head of livestock. This is the market supply curve.
Marginal external cost (MEC)
Of an externality is the marginal cost imposed on society (excluding production costs) by an additional head output. This is typically hard to measure.
Marginal social cost (MSC)
Is the sum of private and external marginal cost. It is the marginal cost imposed on society as a whole by one extra head.
The MSC is upward sloping because nature can often safely handle low levels of manure, waste, and gas but is increasingly harmed as production increases.
Benefit for the demanders of livestock
Is measured by their maximum willingness to pay (MWP) to purchase it.
Marginal private benefit (MPB)
curve of livestock is the demand curve for livestock. => demand function
Marginal external benefit (MEB)
Livestock is 0
Marginal social benefit (MSB)
Of livestock is the same as the marginal private benefit.
MPB = MSB
Socially optimal amount of livestocks
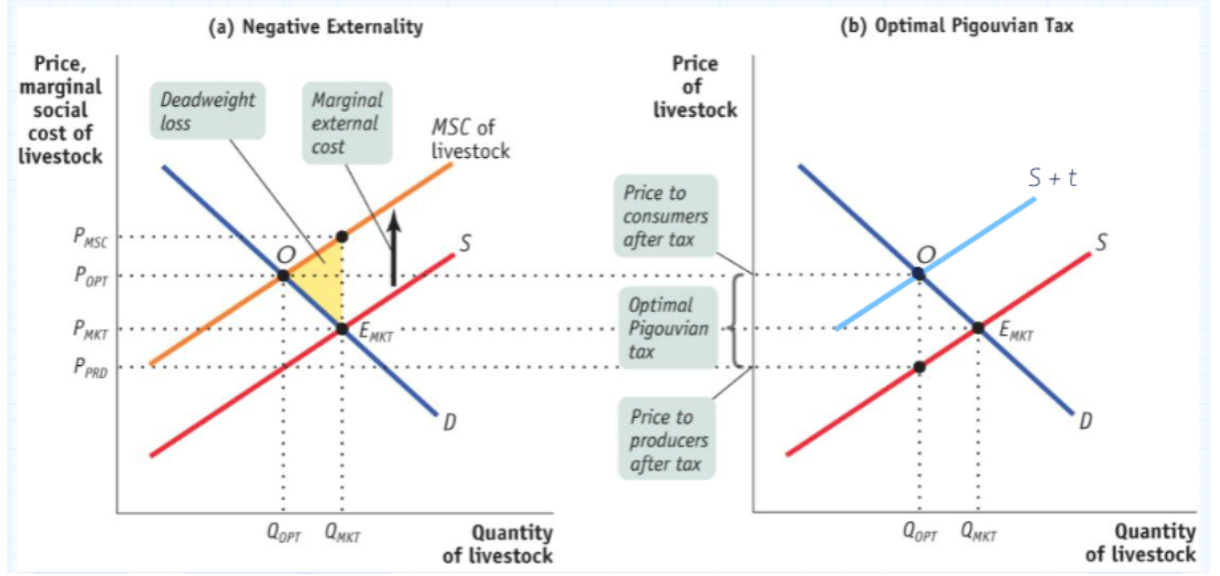
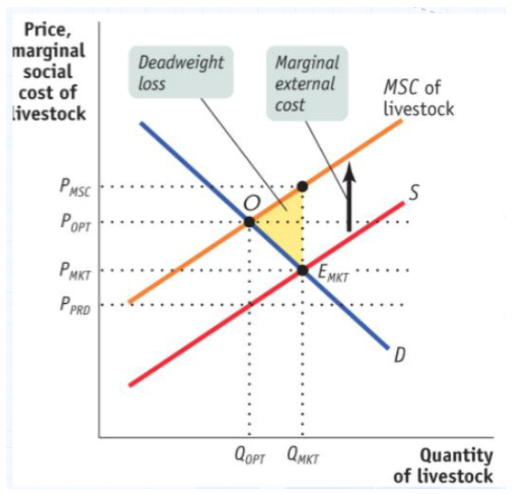
Livestock production generates external costs, so the marginal social cost curve, MSC = supply curve (S), is shifted upward by the marginal external cost, MEC.
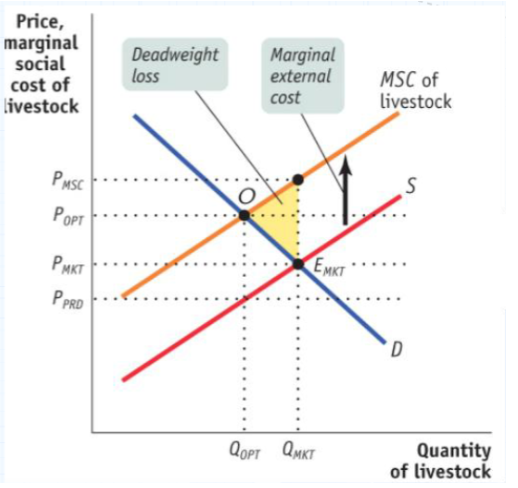
The socially optimal quantity of production, Qopt, is the quantity that would prevail if all costs, both private and external, and benefits were fully accounted for.
The equilibrium market quantity, Qмкt is greater than the socially optimal quantity of livestock production, Qорт.
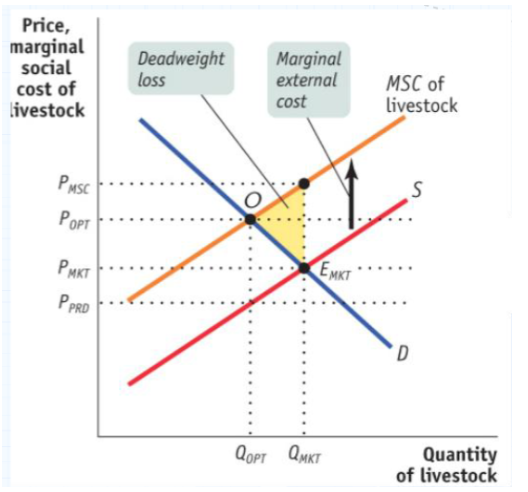
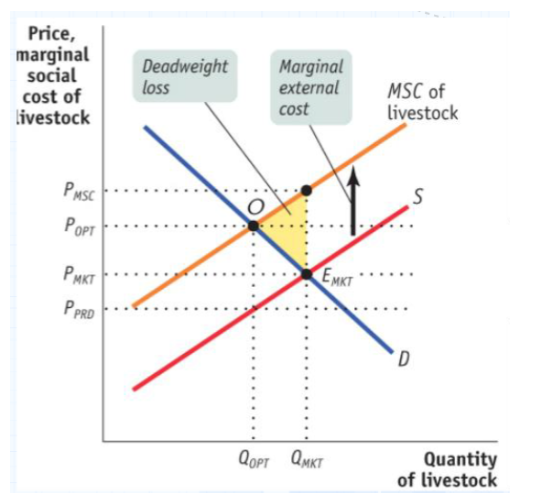
In addition, the equilibrium quantity is associated with a dead-weight loss. i.e. a loss in total surplus of which, many members of society are the victims.
The yellow DWL loss area represents society's net losses from producing Qорт rather than Qмкt
=> loss in TS coming from not internalising an externality
Overview of solutions to externalities
Externalities often lead to market failures (DWL>0), where the private market does not allocate resources efficiently. Solutions to address these inefficiencies can be broadly classified into two categories:
Public solutions
Price floors, quotas, tradable emission permits: Government-imposed to directly limit negative externalities or promote positive ones.
Pigovian Taxes/Subsidies: Taxes imposed on activities that generate negative externalities or subsidies for activities that create positive externalities.
Public Provision of Goods/Services: The government provides goods or services that produce positive externalities, or mitigates the effects of negative externalities.
Private Solutions:
Coasian Remedies: When property rights are clearly defined and transaction costs are low, private parties can negotiate solutions to externalities.
Price floors, quotas, tradable emission permits
a. Gov could intervene by setting price floor (impact on CS,TS and DWL)
b. Gov could intervene by forcing a quota = forcing firms to produce no more than Qopt units of output. (impact on CS, PS, TS and DWL)
c. Tradable emissions permits: firms are licensed to emit limited quantities of pollutants; the licenses can be bought and sold by polluters.
Pigovian Taxes/ subsidies
Gov could impose an excise tax on producers that shafts up the supply curve by just enough to intersect the demand at 0.
=> Taxes designed to internalize an externality are called Pigouvian.
=> remove Victime surplus (VS) when externalities are not internalized