Rangeland Assessment
 Call Kai
 Learn
Learn Practice Test
 Spaced Repetition
 Match
Match Flashcards
 Knowt Play
1/50

There's no tags or description
Looks like no tags are added yet.
Name | Mastery | Learn | Test | Matching | Spaced | Call with Kai | Chat |
|---|
No analytics yet
Send a link to your students to track their progress
51 Terms
Determine if / what management is needed:
three questions:
Are adequate numbers and types of plants present?
Is herbaceous production suitable for the site?
Does forest, brush, or weed management need to be applied?
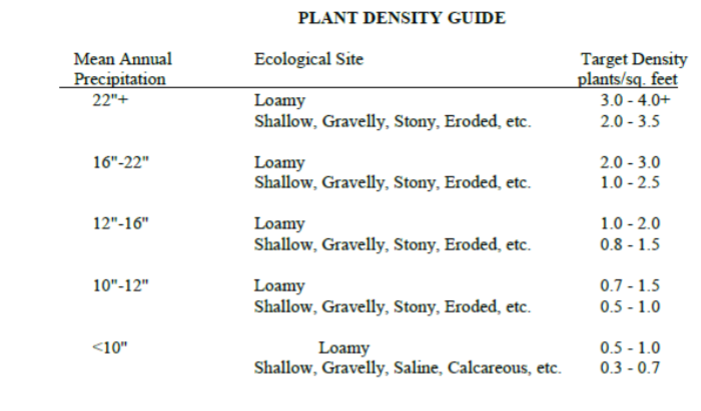
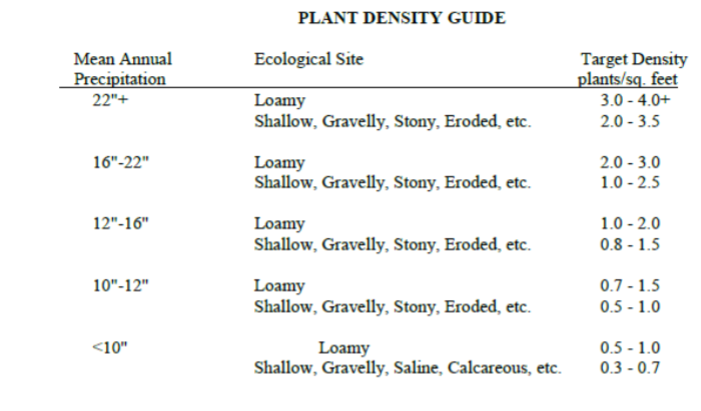
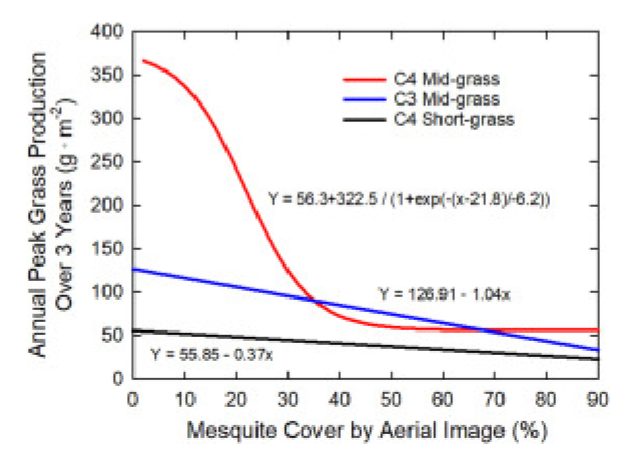
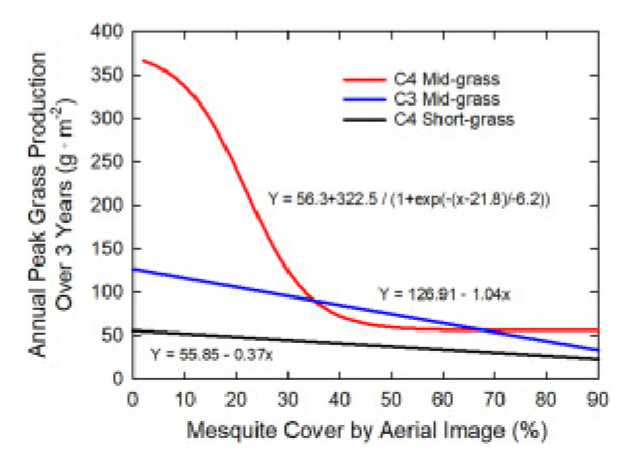
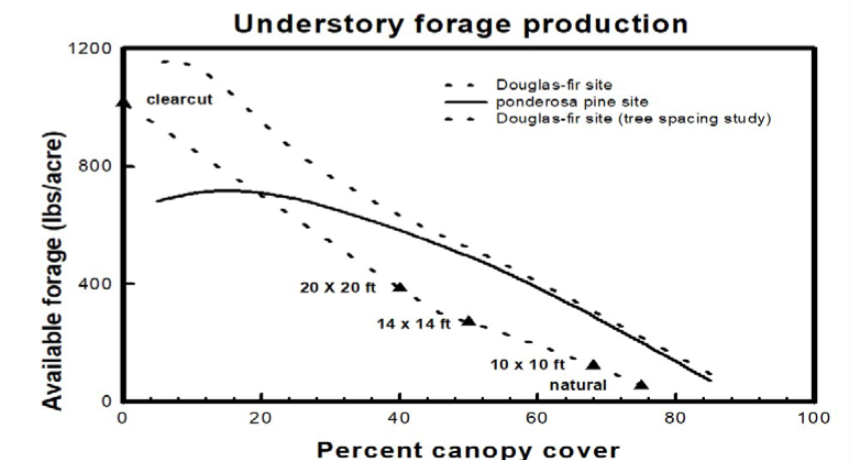
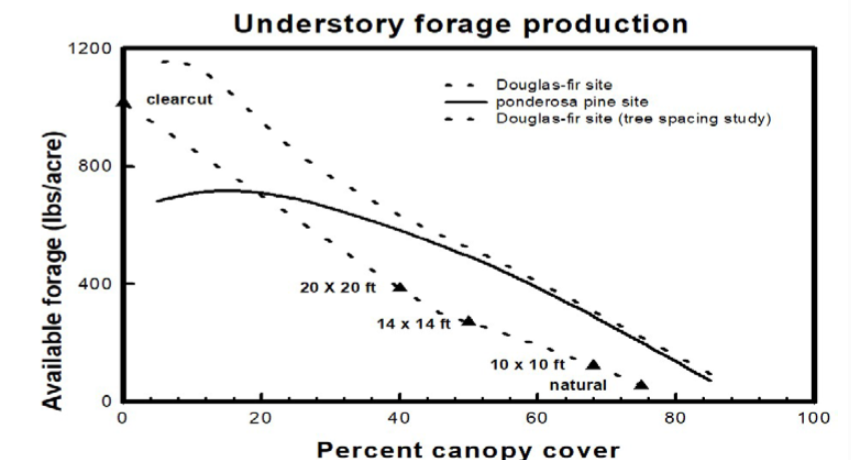
“Generally, seeding will not be done when 15% composition by weight of the desirable plants are _____
present, are well distributed over the treated area, and can be managed to a stand within an acceptable time frame.” – NRCS Range Planting Code 550.
_______: line or path along which observations are recorded
transect
_______: a plot of a defined area, usually rectangular or square
Quadrat
_______: paper or electronic forms used to record and organize data
datasheets
______: abundance and distribution of species; how often it is encountered
Measures presence vs. absence; quantifies presence
frequency
Nested frequency
Dry-weight-rank
Quadrats or plots (Daubenmire or larger)
methods of measuring frequency
Species A occurs % of the time; species B occurs % of the time, etc.
example of frequency
_______: how much of the ground / soil surface is covered by a species / functional group
cover
10-point frames
Single point sampling
Step-point
Daubenmire quadrats
line-intercepts
methods of measuring cover
______: Uses a single-size quadrat to estimate species cover
Procedure:
Place quadrat at specified intervals along transect
Estimate % of quadrat filled by each species present
Cover estimates may be grouped into “classes” or left as raw estimates
Raw estimates - exact %
Example: 52% grass, 19% forbs, 26% litter, 3% bare ground
Daubenmire Quadrats
______: Uses measurements along a transect to quantify cover of individual species
Commonly used to measure cover of trees and shrubs
Easy to do this in areas where woody plants are a minor component
Time consuming with multiple species and canopy layers
Procedure:
Record distances along transect that are occupied by canopies of species of interest
Ex. 50 meter transect with shrub coverage at 10-15 meters (5m), 18-21 meters (3m), 38-45 meters (7m) = 30% coverage
Specifically:
Only record where the canopy covers the transect line
Place the transect under shrubs and between stems of multi-stemmed shrubs
You shouldn’t avoid going though shrubs, cactus, etc with your measuring tape
Line Intercepts
______: the number of individuals per unit of area
Good for measuring seedling emergence, survival, and mortality
Time consuming with high density species
Difficult with sod-forming species
Density
_______ is exact, for example 3 plants per meter squared
absolute density
methods for measuring density
Plot based
small quadrats
large quadrats
belt transects
Plotless
Point-centered quarter
Nearest-neighbor
Random pairs
Wandering quarter
T^2 method
procedures for _____ and _______: set out plot boundary, count individuals within plot, count density per area
large and small plots
belt transect
procedures for _________: Set out transect (plot length), Walk with pole held parallel (plot width), Count individuals falling within the “belt”, Calculate density per area
______: the organic material produced by the vegetation
Production
animals consume _____, not pounds
nutrients
_______: total weight of vegetation within a given area
biomass
______ and _______ can be used interchangeably
Yield & production
______-: total above-ground plant biomass on a site at a particular point in time
Fluctuates within and between years, depending on climate conditions and utilization by grazing animals
Standing crop
________: the maximum amount of above-ground biomass observed at a site during a particular year
Usually coincides with the end of the growing season
Peak Standing Crop
______: herbage or browse which is potential food for animals
forage
______: above-ground biomass of herbaceous plants (grasses and forbes)
herbage
______: the portion of woody plants’ vegetative material available for animal consumption
Usually the current year’s growth of twigs and leaves
browse
_______: fruits, nuts, and seeds (reproductive material) produced by woody plants and used as food by animals
mast
Why do we measure production?
Management indicator
Used to:
Adjust livestock stocking rates
Assess wildlife carrying capacity
Assess site’s value for habitat
Assess feasibility and potential behavior of prescribed fire
Assess success of rangeland improvement practice
Wet weight
Dry matter corrected
Procedure:
Lay out a quadrat or plot
Clip all the aboveground biomass in the plot
Place in paper bags
Weigh the biomass
Dry and reweigh
Direct measurement methods
simple harvest methods
Double weight sampling
Capacitance meter
Rising plate meter
Comparative yield techniques
indirect measurement methods
Data is easy to interpret
Direct measurements require little training
Production is considered a good measure of plant dominance and site capacity
advantages of directly measuring data
Data collection can be very labor intensive and time consuming
Can have high variability of production between quadrats
Cover, frequency, and density measurements are usually quicker.
Seasonal and annual climate fluctuations directly influence production.
Density, frequency, and cover are less susceptible to variations in climate fluctuations.
disadvantages of directly measuring data
_____: how the vegetation is arranged in 3-dimensional space
Based on height of vegetation and / or visual obstruction
structure
Why do we measure structure?
To estimate value of habitat
Thermal cover
Hiding cover
Nesting cover
Movement patterns
To monitor ecosystem health
Microclimate modification
Degradation vs. restoration
Plant vigor
Use by grazing / browsing animals
to measure individual plant structure:
height and diameter
Nudds’ board
Robel pole
Designed for primary use in grasslands.
Originally designed for measuring nesting cover.
Uses a pole that is marked in alternating black and white colors (150 cm tall x 3 cm in diameter).
Black and white alternate every 10-cm
Hays’ vegetation profile board
vertical cover boards
Secure pole at sample location.
Observer stands 4 m away. This distance is usually marked with a string that is attached to the pole at a height of 1 m.
Observer lowers him/herself to sighting height and records the highest band that is completely obscured by vegetation.
Take observations from 4 cardinal directions around the pole at each sampling location and then average them.
Record all the bands which are ≥ 50% obscured by vegetation (live or dead) at 0- 60cm, and record all bands obscured ≥ 25% at 60-150cm.
procedure of vertical cover boards
Quick and easy to estimate vertical cover
Grass height highly correlated with biomass
Good to use clipping and robel pole methods together for biomass estimation
pros of vertical cover boards
cons of vertical cover methods
Usually need two people for measurements
Gives an estimate rather than absolute value for vertical cover
to measure structure you use
Densiometers
Photometric (light) technique
vertical cover boards
_______: the proportion % of cover, density, production, etc. to the area’s total
Not measured in the field
Calculated later based on other measurements made in the field
Can be calculated from canopy cover, density, or biomass values
Can be calculated based on individual species or groups of species (grasses, forbs, shrubs, trees)
Also called: species composition or botanical composition
composition
why do we calculate composition?
Used to describe ecological sites and evaluate rangeland condition (ecological similarity index)
Measurements over time can be used to monitor changes in rangeland condition
Allows comparison of dominance of various species in the plant community
Usually more easily understood / visualized than other vegetation attributes
________: Expressed as a %
All vegetative components add up to 100%
Can be calculated using values from biomass, cover, or density
From biomass
% composition of species A = (weight of species A / total weight of all species) x 100
calculating species composition
Stem Count Index (Browse Utilization Survey)
TPWD Procedure
Mast Production Measurements
Softball Habitat Evaluation Technique
Other Measurements Useful for Management Planning
______: Measures number of browsed stem tips out of a total sample
Stem Count Index (Browse Utilization Survey):
_______: At a location (plot), count browsed tips out of 100 stem tips
Minimum of 3 plants per species are sampled
No more than 34 stem tips counted on 1 plant
Calculate % browse utilization by species
Categorize species into 1st , 2nd, or 3rd choice palatability classes
Compare values to the stocking intensity table developed for the region.
TPWD Procedure:
_____: Weigh or count mast collected in traps
Estimating percentage of tree crown with mast
Counting mast density within plots
Mast Production Measurements:
______: Evaluates adequate access to loafing and escape cover.
Brush thickets should not be more than a softball throw (40 – 60 yds) from each other.
If you throw a softball 15 yards and still see the ball, the grass is too short.
If you throw it 15 yards and don’t see the ball, ground cover is thick enough for visual obstruction.
If you can drop a golf ball and roll it with your foot through the vegetation, the vegetation at ground level is appropriate for chicks
Softball Habitat Evaluation Technique: