CH 16 Data Handling & Preparation/ Data Handing and Data Coding Lecture 9
1/28
There's no tags or description
Looks like no tags are added yet.
Name | Mastery | Learn | Test | Matching | Spaced | Call with Kai |
|---|
No analytics yet
Send a link to your students to track their progress
29 Terms
steps in data preparation for analysis
coding
editing, validating and cleaning
entering
transforming
data editing, 2. coding, 3. statistically adjusting data if required
data editing
to identify omissions, ambiguities, errors, conducted in field by interviewer and field supervisor
problems to identify in editing
interviewer error ( may not be giving respondent correct instructions)
omissions (fail to answer all questions)
ambiguity (response unclear or not legible)
inconsistencies (2 respondes inconsistent)
lack of cooperation (rebeling & checking same response)
ineligible respondent (inappropriate respondent (ex. women only 18)
alternatives available for data editing
contact respondent again done by interviewer
throw whole questionnaire as not useable
throw out problem questions
bypass questions
code illegible to idk or no opinion to simplify
input missing values for certain variables through use of mean profiles
by product of editing
helps in evaluating and guiding the interviews; an interviews tendency to allow a certain type of error should be detected by editing
flawed and missing data in editing
discard flawed records with missing answers
treat flawed record as missing data and treat missing data as separate category
obtain additional. information
data coding
one or multiple columns for each question, each row corresponds to 1 response
indicators or identification #s assigned for each type or responses
different code for diff. answers and missing answers
assign same code for similar answers
data coding open ended q
specify exactly how responses to be entered
column ref synonymous with variable identification link b/t question # columns for each response
each q in separate column and range of permissible values provide key info of the value to be entered
response value into spreadsheet to generate info but needs to be checked for error
assign same code for similar answers
data coding close ended q
long list of possible responses generated & placed into list of items
assignment of a response involves a judgement decision if the response doesn’t match a list item exactly
EX: q why did you select instrument from ajax. may get many responses, decisions must be made about response categories. difficult to put into categories
general rules
one or multiple columns for each question, each row corresponds to 1 response
indicators or identification #s assigned for each type of response
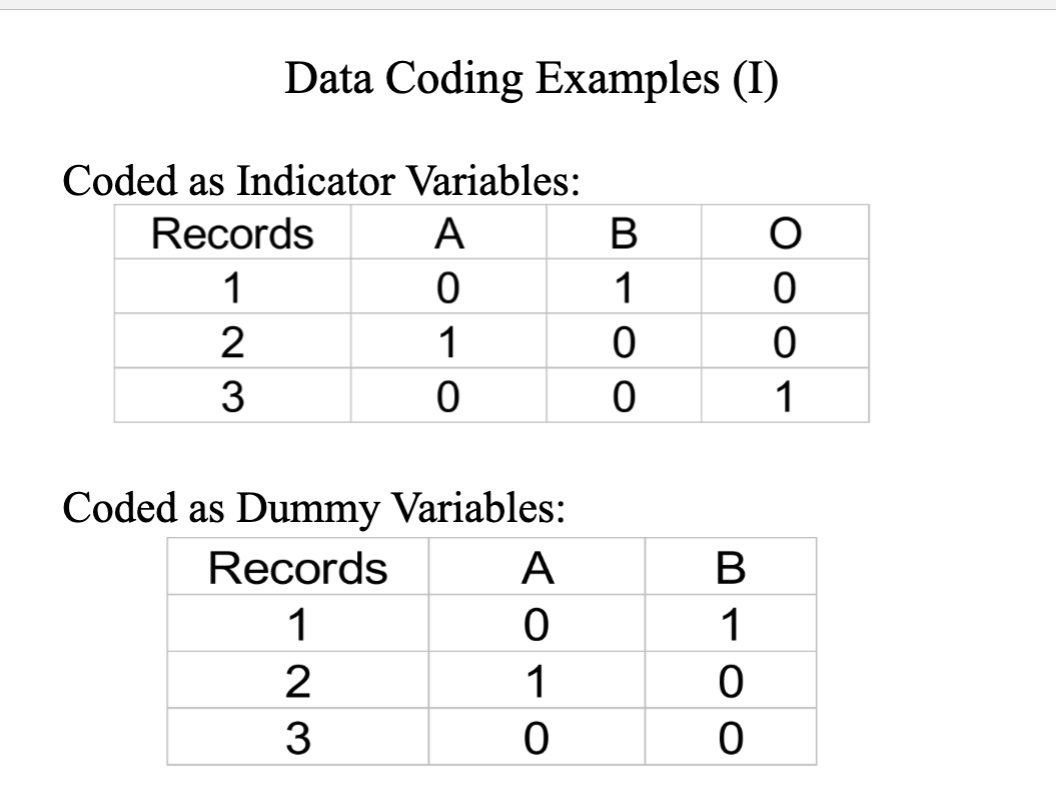
data coding example
which is your favorite online book store
amazon (A)
barnes and noble (B)
other (o)
records
#1 (2)
#2 (1)
#3 (3)
statistically adjusting the data
to enhance its quality for data analysis
weighting
weighting
procedure by which each response in database is assigned a number according into some pre specified rule.
done to make sample data more representative of a target population on specific characteristics
underrepresented categories given higher weights
over-representated given lower weights
used for adjusting the sample so that greater importance is attached to respondents with certain characteristics
example: if a study is conducted to determine market potential of new sports drink → researcher might attach greater weight to opinion of young people because they main users of product
ex: 2.0 to person who under 30
1.0 to person who over 30
variable respecficiation
a procedure in which the existing data are modified to create new variables or in which large number or variables are collapsed into fewer variables
purpose: create variables consistent with study objectives
ex: original variable represented the reasons for purchasing a car w/o response categories. may be put into 4 categories: performance, price, appearance, service
dummy variables
variable 0 or 1 to represent categories
uses extensively for respecifying categorial variables
also known as binary, dichotomous, instrumental and qualitative var.
m levels of qualitative we use m-1 to specify them
m categories→ m-1 dummy var
ex: 2 categories (1st half , 2nd half, m=2 m-1-1 so 1 dummy needed)
scale transformation
for interval, ratio data
manipulation of scale values to ensure comparability with others scales
in same study different scales be employed for measuring different variables
standardization
standardization
type of scale transformation
allows researchers to compare variables that have been measured using different types of scales
ex: scales measures in $$, cents, value of variance you need to change
to compare variances both variables bought down to common unit of measurement
Zi (Xi - X) / Sx
X has _ on it
strategy for data analysis
1st step in data analysis after data preparation is to analyze each question or measure itself by using tabulation
tabulation
consists of counting the number of cases that fall into various categories or counting how many responses fall into each category.
ex: whats your fav color tabulation into a table red:2, Orange: 1, green: 2
primary use for tabulation
determining empirical distribution (frequency distribution) of the variable in question (ex. 40% said blue, 10% said orange)
calculating the descriptive (summary) statistics particularly means or %’s (can compute % , totals helps spot missing/weird mistakes)
cross tabulations
compares 2 variables at same time instead of 1
to assess if any associations is present instead separate b/t two nominal and ordinal variables (non number)
if variables measured as interval or ratio they can be transformed to nominally scaled variables
sample is divided into subgroups in order to learn how the dependent variable varies from subgroup to subgroup
% computed on each cell basis or rows or columns, when computations are by rows or columns cross tab usually referred as contingency tables
ex: the income of household can be rescaled as <30,000 and 39,000 to cross tab with another nominally scaled variable
Frequency Distribution
simply reports the number of responses that each question received and its the simplest way of determining empirical distribution of the variable
part of tabulation
organizes data into classes or groups of values and shows the number of observations from the dataset that falls into each of the classes
response categories may be combined with many question
result in categories w worthwhile # of respondent
histogram: series of rectangles each proportional in width to the range of values with a class proportions in weight to # of items falling into class
descriptive statistics
statistics normally associated with a frequency distribution that helps summarize information at frequency table
includes
measures of central tendency (mean, median, mode)
measures dispersion (ranges sd, coeff of variation)
measures of shape (skewness & kurtosis)
requires data to be collected using interval or ratio scaled questions
factors influencing the choice of statistical techniques
type of data
research design
assumptions underlying the test statistic & related considerations
type of data
nominal, ordinal , interval, ratio
nominal
most primitive form of data, #s assigned to objects, based on objects, belong to particular categories made important
ordinal
represents a higher measurement than nominal, because numbers assigned to reflect order also to identify the objects mean, median and nonparametric tests
interval & ratio
metrics data best for data analysis, wide range of parametic, non parametric test mean, median, mode
research design
a second consideration that affects the choice of analysis is RD to generate data
decisions analyst have to face involve the dependency of observations the number of observations per project, # of groups being analyzed & control excersised over variable of interest
independent or dependent samples?