Potential exam questions
1/37
There's no tags or description
Looks like no tags are added yet.
Name | Mastery | Learn | Test | Matching | Spaced |
|---|
No study sessions yet.
38 Terms
Effects of trade blocs on various stakeholders which you will answer in the first lesson back after HT.
💥 VERSION 1: Consumers and Producers (classic route)
### Introduction
A trade bloc is a group of countries that agree to reduce or eliminate barriers to trade between members (e.g. EU, ASEAN, NAFTA). This can take forms such as a free trade area, customs union, or single market. The effects of trade blocs depend on the nature of integration and the competitiveness of industries.
---
### Effect 1: Consumers benefit from lower prices and greater choice
When tariffs are removed between member countries, imports from within the trade bloc become cheaper as artificial price barriers are eliminated. This leads to an increase in import competition in domestic markets, placing downward pressure on prices for consumers.
As firms face greater competition, countries are incentivised to specialise in the production of goods and services in which they have a comparative advantage. Resources are therefore reallocated towards their most efficient uses, improving allocative efficiency across the economy and increasing overall productive potential.
Furthermore, the removal of tariffs encourages increased intra-bloc trade, expanding market size for firms operating within the trade agreement. This allows firms to produce at a larger scale, benefiting from economies of scale such as spreading fixed costs over higher output. As average costs fall, firms are able to lower prices further, reinforcing the initial reduction in prices caused by increased competition.
Overall, the removal of tariffs leads to lower prices, greater efficiency, and improved consumer welfare within member countries.
Application (AO2) – add to secure top-band marks
In a large trade bloc such as the European Union, car manufacturers can sell to multiple countries tariff-free, increasing output and reducing average costs.
UK consumers importing food products from EU countries previously faced tariffs post-Brexit; removal would lower import prices and increase choice.
Firms in smaller member states gain access to larger markets, allowing them to grow beyond domestic demand constraints.
Increased competition reduces monopoly power of domestic firms, limiting their ability to raise prices.
* Diagram: tariff removal – domestic price falls from Pw+t to Pw, imports rise.
Stakeholder impact:
* Consumers gain from lower prices and wider choice.
* Firms importing raw materials benefit from cheaper inputs.
Chain of reasoning 1: Benefits depend on the extent of competition
The extent to which consumers benefit from tariff removal depends on the level of competition within the market. While increased imports should, in theory, place downward pressure on prices, this outcome is not guaranteed if firms operate in oligopolistic markets.
If a small number of large firms dominate the market, they may engage in tacit collusion, choosing to keep prices artificially high rather than competing aggressively. As a result, reductions in costs from cheaper imports or economies of scale may be retained as higher profits rather than passed on to consumers in the form of lower prices.
Consequently, the expected gains in consumer welfare and allocative efficiency may be limited, meaning the overall benefits of tariff removal are reduced when competition is weak.
Chain of reasoning 2: Short-run structural unemployment
In the short run, the removal of tariffs can lead to structural unemployment as domestic firms that are relatively inefficient face increased competition from cheaper foreign imports.
As these firms lose market share, they may be forced to downsize or exit the market entirely, leading to job losses. Workers made redundant may possess industry-specific skills that are not easily transferable to expanding sectors within the economy.
As a result, there is a time lag before labour can retrain and relocate, meaning unemployment rises in the short run. This can increase government spending on welfare benefits and reduce tax revenues, partially offsetting the long-term efficiency gains from tariff removal.
---
### Effect 2: Domestic producers benefit from larger markets and investment
When countries join a trade bloc, they create a larger integrated market with reduced or zero tariffs for member states. This makes the bloc more attractive to foreign firms seeking to gain tariff-free access to multiple countries, resulting in an increase in foreign direct investment (FDI).
For example, Toyota invested in the UK after it joined the EU, allowing the firm to access the wider EU market without tariffs.
FDI brings capital, technology, and management expertise into the host country, improving productive capacity.
With increased investment and access to a larger market, domestic producers can expand output, enabling them to exploit economies of scale. Larger production runs reduce average costs per unit, improving cost efficiency and potentially allowing firms to lower prices for consumers. Higher productivity also increases national competitiveness in global markets.
Access to a larger consumer base within the trade bloc encourages firms to invest in innovation and research & development (R&D). Firms are more willing to develop new products or improve processes when they can sell to more consumers, expecting higher returns on their investment. This drives dynamic efficiency, leading to higher-quality goods, more variety, and long-term economic growth within the member countries.
Overall, trade blocs stimulate investment, efficiency, innovation, and consumer welfare by creating larger, integrated markets and improving incentives for firms to expand and innovate.
Application (AO2)
EU: Toyota and Nissan building factories in the UK for tariff-free EU access.
ASEAN: Companies from outside Asia investing in Vietnam to export across the ASEAN market.
USMCA: Foreign car manufacturers locating plants in Mexico to benefit from tariff-free access to the US and Canadian markets.
Innovation example: Pharmaceutical firms in the EU invest heavily in R&D due to access to a large, affluent market.
Stakeholder impact:
* Domestic firms gain scale and efficiency.
* Workers benefit from higher employment and skills.
#### Evaluation:
* Inefficient firms may struggle with increased competition, leading to job losses.
FDI may be *footloose** – can relocate if bloc membership changes (e.g. post-Brexit relocations).
Benefits depend on *type of industry** – high-tech sectors benefit more than agriculture.
May cause *income inequality** if gains accrue to capital owners rather than workers.
---
### Judgement:
Overall, trade blocs tend to benefit consumers and competitive producers in the long run due to increased efficiency and lower prices. However, short-term adjustment costs and trade diversion can harm certain domestic industries and non-member countries. The magnitude depends on the bloc’s depth of integration and the country’s competitiveness.
---
# 💥 VERSION 2: Governments and Firms
### Intro
Trade blocs are forms of regional economic integration that promote trade and investment among member states through reduced trade barriers. The impact varies across stakeholders such as firms, governments, and consumers.
---
### Effect 1: Governments benefit from economic growth and employment
Increased trade boosts *aggregate demand (AD = C + I + G + (X-M))**, raising output and employment.
* Greater tax revenues from income and corporation tax as output rises.
Encourages *policy coordination** (e.g. EU environmental or labour standards).
#### Evaluation:
* If trade diversion occurs, inefficient production may rise, reducing world welfare.
Governments *lose tariff revenue** from imports within the bloc.
* Dependence on bloc trade partners can make economies vulnerable to shocks.
---
### Effect 2: Firms benefit from reduced barriers and larger markets
* Common standards and removal of non-tariff barriers reduce compliance costs.
Access to wider markets encourages *mergers and acquisitions**, innovation, and dynamic efficiency.
* Firms can source inputs more cheaply from bloc members → improved competitiveness globally.
#### Evaluation:
* Increased competition may reduce profit margins for small domestic firms.
* Large multinational firms may dominate, leading to market concentration and potential exploitation.
Long-run gains depend on how well firms *adapt and innovate**.
---
### Conclusion:
Firms and governments usually gain in the long term through higher trade volumes and productivity, but short-run adjustment costs and loss of sovereignty can reduce benefits.
---
# 💥 VERSION 3: Developed vs Developing Member Effects
### Effect 1: Developing members benefit from investment and technology transfer
* FDI flows to lower-cost members seeking production efficiency → technology diffusion, employment growth.
* Improves infrastructure and skills (e.g. Eastern Europe after EU accession).
Evaluation:
* FDI may be exploitative or concentrated in capital-intensive sectors.
* Unequal bargaining power → core-periphery dynamic within bloc.
---
### Effect 2: Developed members benefit from export expansion
* Access to emerging markets → demand for advanced goods/services rises.
* Improves trade balance and GDP growth.
Evaluation:
* May worsen income inequality if benefits accrue to high-skilled workers or firms.
* Structural shifts can harm traditional sectors.
---
# 💥 VERSION 4: Diagram-Focused (for strong analytical marks)
Use:
* Trade creation and trade diversion diagram
* Tariff removal diagram
KAA:
* Show welfare gain (consumer surplus rise) for trade creation.
* Explain loss from trade diversion if efficient non-member replaced by less efficient member.
* Discuss efficiency vs allocative outcomes.
Evaluation:
Net welfare effect depends on whether *trade creation > trade diversion**.
Depends on *size of bloc**, elasticities of demand, initial protection levels.
---
# ✅ Possible Stakeholders to Mention
* Consumers: prices, variety, welfare.
* Domestic firms: competition, economies of scale, market access.
* Workers: employment, wages, job security.
* Governments: revenue, growth, policy autonomy.
* Non-member countries: diversion, exclusion effects.
---
# ✅ Example Judgement Sentences
* “In the short run, domestic industries may contract, but in the long run, dynamic efficiency gains dominate.”
* “The net benefit of a trade bloc depends largely on whether trade creation outweighs trade diversion.”
* “Stakeholders in competitive sectors tend to gain, while those in protected or inefficient industries may lose.”
---
Would you like me to make a model 15-mark essay (exact full answer in exam style) from the best version above, hitting band 5 (A)* criteria?
Trade bloc graph
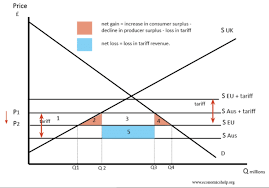
2⃣ Before the trade bloc (with tariff)
The UK imposes a tariff on imports from both the EU and Australia.
The world price (without tariffs) from Australia is P₂ (cheapest).
But because of the tariff, imports from both countries cost P₁.
Therefore, the UK buys at P₁, and imports come from the EU (because maybe Australia faces a higher tariff or is outside the bloc).
At this point:
Domestic suppliers produce Q₁.
Domestic consumers demand Q₄.
Imports = (Q₄ – Q₁).
3⃣ After joining the trade bloc (tariff removed for EU)
Now, as part of the EU trade bloc, the UK removes the tariff on EU goods, but keeps it on Australia (non-member).
The price in the UK falls from P₁ → P₂.
Imports now come only from the EU, at P₂.
4⃣ Labelled areas (1–5)
Area | What it represents | Explanation |
|---|---|---|
1 | Loss of producer surplus | Domestic UK producers lose this area because the price falls from P₁ → P₂ and they now produce less (Q₁ → Q₂). |
2 + 4 | Gain in consumer surplus | Consumers gain from lower prices and greater consumption (price falls to P₂ and demand rises to Q₄). |
3 + 5 | Tariff revenue loss / Net welfare effect | The government used to receive tariff revenue when the price was P₁, shown by area 3 + 5. After joining the bloc, tariff revenue disappears because EU goods are tariff-free. |
3 | Net gain from trade creation | This area represents efficiency gains — imports now come from a more efficient EU producer instead of inefficient domestic production. It’s a welfare gain. |
5 | Net welfare loss from trade diversion | This area shows the loss from switching imports from a more efficient non-member (Australia, lower price) to a less efficient member (EU). It’s a welfare loss because of trade diversion. |
5⃣ Summarised interpretation
Concept | What happens | Welfare effect |
|---|---|---|
Consumer surplus | Increases by (1 + 2 + 3 + 4 + 5) | ✅ Gain |
Producer surplus | Falls by 1 | ❌ Loss |
Government revenue | Falls by (3 + 5) | ❌ Loss |
Net welfare effect | (3 – 5) | ✅ if trade creation (3) > ❌ trade diversion (5) |
6⃣ In words:
The UK gains from cheaper imports from the EU (trade creation) — area 3.
But it loses because imports are diverted away from a more efficient supplier (Australia) — area 5.
The net welfare effect depends on whether area 3 > area 5.
✅ Key terms recap:
Trade creation: When joining a trade bloc causes imports to shift from high-cost domestic production → lower-cost member production (efficiency gain).
Trade diversion: When imports shift from a lower-cost non-member → higher-cost member (efficiency loss).
Analyse the main causes of globalisation.
Introduction
Globalisation refers to the increasing integration and interdependence of economies worldwide, through the growing flows of goods, services, capital, labour, and ideas across borders. Over recent decades, globalisation has accelerated due to a combination of technological, political, and economic factors that have reduced the barriers to international interaction. This essay will analyse the main causes — focusing on technological advancement and trade liberalisation — and will evaluate the extent to which each has been crucial in driving globalisation.
(AO1 = clear definition, AO2 = application, AO3 = line of argument)
Paragraph 1 — containerism
Containerisation has been a major driver of globalisation by revolutionising the way goods are transported internationally. Standardised shipping containers drastically reduce the time, cost, and risk associated with moving products by sea. Lower transport costs allow firms to source inputs from multiple countries, establishing global supply chains and maximising cost efficiency.
Lower shipping costs → cheaper imports and exports
By reducing the per-unit cost of transport, containerisation allows firms to import raw materials and intermediate goods at lower prices.
Example: Clothing brands like H&M import fabrics from Asia and assemble garments in low-cost countries, selling globally at competitive prices.
Reduction in logistical complexity → expansion of global supply chains
Containers simplify handling, reduce damage and theft, and enable standardisation of ports and logistics systems.
This makes it feasible for firms to fragment production across borders, exploiting the comparative advantage of different countries.
Example: Apple sources chips from Taiwan, assembles iPhones in China, and sells worldwide—logistics are possible because containers standardise and secure transport.
Economies of scale in shipping → further cost reductions
Containerisation allows the use of mega-ships that carry thousands of containers, lowering average transport costs per unit.
Lower shipping costs can be reinvested into production or passed on to consumers as lower prices, encouraging higher international trade volumes.
Application: The rise of ultra-large container vessels in ports like Rotterdam and Singapore has increased the volume of goods moved globally.
Faster and more reliable transport → market expansion
Reduced shipping times make it viable to trade perishable goods or high-value electronics globally.
This allows firms to enter new international markets and respond to consumer demand efficiently.
Example: European supermarkets import fresh fruit year-round from South America due to reliable container shipping.
Lower risk → increased foreign direct investment (FDI)
Safer, more predictable shipping reduces risk for multinational firms investing in production abroad.
FDI rises as companies confidently set up production in countries where labour or resources are cheaper, boosting global economic integration.
Example: Toyota invested in the UK to access the EU market, knowing containerised transport could reliably move cars and parts.
Stimulates global supply chain innovation → dynamic efficiency
Firms invest in better inventory management, just-in-time production, and advanced tracking systems because containerisation ensures predictable delivery schedules.
This promotes productivity gains, cost efficiency, and innovation, which further embeds globalisation into production networks.
Example: Amazon’s global logistics network relies heavily on containerised shipping to enable rapid delivery and global expansion of e-commerce.
Eval:
Evaluation / Limitations of containerisation as a driver of globalisation
Uneven benefits across countries
While containerisation benefits countries with major ports and strong infrastructure, landlocked or poorly connected countries may gain little, limiting globalisation’s reach.
Example: Many African nations rely on overland transport and see higher costs, so containerisation mainly boosts trade for countries like China, Germany, or the Netherlands.
Environmental costs
Increased container shipping contributes to CO₂ emissions, marine pollution, and congestion in ports.
Environmental regulations or carbon taxes could increase transport costs, partially offsetting the cost reductions containerisation offers.
Dependency on global supply chains
Firms become highly dependent on long-distance transport, which can be disrupted by strikes, pandemics, or geopolitical tensions.
Example: The Suez Canal blockage in 2021 delayed container ships globally, showing how over-reliance can disrupt trade flows.
Not a sufficient driver alone
Containerisation reduces costs, but other factors are also required for globalisation: free trade agreements, ICT for coordination, and FDI incentives.
Without complementary policies, the potential gains from containerisation may not materialise fully.
Diminishing returns for very small firms
Small producers may struggle to benefit from containerisation because they cannot fill containers or negotiate bulk shipping rates, limiting their ability to globalise.
Large multinationals capture most of the advantages, potentially increasing global inequality.
Short-term vs long-term effects
While containerisation lowers transport costs and boosts trade, initial infrastructure investment is very high (ports, cranes, IT systems), which may limit short-term accessibility.
2nd Chain of reasoning (digital technology):
Advances in information and communication technology (ICT), particularly the internet, have allowed for instant communication across borders.
This enables outsourcing and offshoring of services (e.g. call centres in India for UK firms).
It has also accelerated financial globalisation, as capital can move electronically across borders at near-zero cost.
Diagram (appropriate):
→ Shift of the PPF outwards for the world economy: technological progress increases productive capacity globally, allowing more trade and interdependence.
(Label axes as goods X and Y, show PPF shifting outward.)
Evaluation (limitations):
However, not all countries have benefited equally — the digital divide limits poorer nations’ ability to engage in global trade.
Furthermore, technological progress can reduce the need for physical trade in some cases (e.g. 3D printing or nearshoring), potentially slowing future globalisation.
Paragraph 2 — Trade liberalisation and policy decisions
1st Chain of reasoning (lower trade barriers):
Governments and international organisations such as the World Trade Organization (WTO) have encouraged the removal of tariffs, quotas, and subsidies, promoting free trade.
For example, the creation of trade blocs like the EU or ASEAN has enhanced intra-regional trade.
Lower barriers reduce the cost of exporting and importing, encouraging multinational enterprises (MNEs) to operate globally.
2nd Chain of reasoning (FDI and deregulation):
Alongside trade liberalisation, many countries have liberalised capital markets and deregulated industries, allowing foreign direct investment (FDI).
FDI spreads technology, management expertise, and capital across borders — key features of globalisation.
For example, China’s “Open Door” policy (1978 onwards) attracted Western MNEs like Volkswagen and Apple, integrating China into the global economy.
Diagram (appropriate):
→ AD/AS model: an increase in exports and FDI shifts AD to the right, boosting growth — illustrating how openness promotes global interconnectedness.
Evaluation (limitations):
However, trade liberalisation can be reversed during protectionist periods — e.g. US tariffs on Chinese goods during the trade war.
Additionally, liberalisation may increase globalisation unevenly, benefiting capital-rich nations and multinational firms more than local producers or poorer economies.
Judgement / Conclusion
In conclusion, while multiple factors have contributed to globalisation, technological progress has arguably been the fundamental driver, as it underpins the feasibility and speed of trade, communication, and capital flows. Trade liberalisation and FDI have built upon this technological foundation, but without transport and communication innovation, the scale of integration seen today would be impossible. Nevertheless, future globalisation may depend more on policy stability and digital inclusion than on physical technology, as nations re-evaluate global supply chain risks post-COVID.
Application Summary (AO2 examples):
Apple’s global supply chain (US–China–Taiwan)
China’s Open Door Policy (1978) attracting FDI
Trade blocs: EU, ASEAN
WTO membership increases trade participation
Digital divide between Sub-Saharan Africa and OECD nations
Discuss the role of multinational corporations (MNCs) in promoting globalisation.
Introduction
A multinational corporation (MNC) is a firm that owns or controls production or services in more than one country. MNCs play a central role in driving globalisation — the process of increasing economic integration between countries — by spreading capital, technology, labour, and ideas across borders. Through investment, trade, and global value chains, MNCs have become the main mechanism by which economies become interlinked. This essay will analyse how MNCs promote globalisation through foreign direct investment (FDI) and technology and cultural diffusion, while evaluating the extent of their role relative to other drivers such as governments and technology.
(AO1 definition, AO2 context, AO3 argument preview)
Paragraph 1 — FDI and the integration of global production
1st Chain of reasoning (FDI expansion):
MNCs expand globally by investing directly in foreign countries — known as foreign direct investment (FDI).
FDI connects economies as MNCs set up subsidiaries, factories, and supply chains abroad, integrating capital and labour markets.
This leads to the creation of global value chains, where production occurs across multiple nations (e.g. design in the US, manufacturing in China, assembly in Vietnam).
For example, Apple’s global supply chain links the US, China, and Taiwan, demonstrating how MNCs physically and financially tie economies together.
2nd Chain of reasoning (Trade and specialisation):
MNCs promote international trade as they import intermediate goods and export final products, increasing cross-border flows of goods and services.
This encourages specialisation according to comparative advantage — nations produce goods where they have lower opportunity cost.
Consequently, global trade as a share of GDP has risen dramatically since the rise of MNCs in the late 20th century.
Diagram (appropriate):
→ World PPF shifting outward — MNCs’ investment and efficiency raise global productive potential and enable higher output combinations.
Evaluation:
However, the benefits may be unevenly distributed: MNCs often locate where costs are lowest, exploiting cheap labour and weak regulation.
In addition, profits are frequently repatriated to the home country, limiting the net gain for host nations.
Thus, while MNCs foster global integration, they may reinforce inequality and dependency patterns (neo-colonial argument).
Paragraph 2 — Technology transfer and cultural diffusion
1st Chain of reasoning (Technology and knowledge spillovers):
MNCs bring advanced technology and management expertise to host nations.
Local firms can learn through demonstration effects and labour mobility, raising productivity and competitiveness.
This process spreads innovation internationally — a key element of globalisation.
For example, Toyota’s operations in the UK diffused lean production methods, influencing domestic car manufacturing practices.
2nd Chain of reasoning (Cultural and consumer globalisation):
MNCs spread global brands such as McDonald’s, Coca-Cola, and Netflix, standardising consumer tastes across nations.
This promotes cultural globalisation, linking societies through shared consumption patterns and media.
Global advertising and digital marketing integrate societies beyond trade and finance, strengthening cross-border interdependence.
Diagram (appropriate):
→ AD/AS model: inward FDI shifts AD (via investment spending) and LRAS (via productivity gains), illustrating how MNCs integrate economies.
Evaluation:
However, cultural globalisation can lead to homogenisation, eroding local traditions and diversity.
Moreover, technology transfer is not automatic — MNCs may keep core innovations in the parent country to maintain competitive advantage, limiting global diffusion.
Judgement / Conclusion
In conclusion, MNCs are the primary vehicle of globalisation, linking nations through FDI, trade, technology, and culture. Their operations create global supply chains and drive both economic and cultural integration. However, their influence depends heavily on government policies, technological infrastructure, and institutional quality in host countries. Without regulation and equitable policies, MNCs can entrench dependency rather than mutual integration. Therefore, while MNCs promote globalisation, they do not act alone — they function within a wider framework of liberalised trade and advancing technology that makes globalisation possible.
Application (AO2 examples)
Apple – global supply chain, technological integration
Toyota UK – technology transfer and FDI
McDonald’s / Netflix / Coca-Cola – cultural globalisation
China’s Open Door Policy (1978) – attracted MNCs, driving export-led growth
Bangladesh’s garment industry – employment through MNC contracts but with low wages
Repatriation of profits – limits benefits for host nations (e.g. Shell in Nigeria)
Evaluate the impact of globalisation on economic growth in developing countries.
Introduction
Globalisation refers to the increasing economic integration between countries through trade, capital, labour, and information flows. For developing countries, globalisation can be a key driver of economic growth—defined as the increase in real GDP over time—by expanding markets, attracting investment, and promoting efficiency. However, its impact is not uniform, as benefits can be offset by structural weaknesses, inequality, and external vulnerability. This essay will analyse how globalisation promotes growth in developing countries through trade and FDI, before evaluating limitations such as income inequality, dependence, and volatility.
Paragraph 1 — Globalisation promotes growth through trade and specialisation
1st Chain of reasoning (comparative advantage & export-led growth):
Globalisation enables developing countries to specialise in goods where they have a comparative advantage, such as labour-intensive manufacturing or primary goods.
By exporting to global markets, they achieve export-led growth, increasing aggregate demand (AD) and GDP.
For example, Vietnam has leveraged low-cost labour to become a major exporter of textiles and electronics, achieving average GDP growth above 6% annually.
Increased export earnings fund infrastructure, health, and education, fostering long-term development.
2nd Chain of reasoning (economies of scale and competition):
Open trade exposes domestic firms to international competition, encouraging efficiency and innovation.
Larger export markets allow firms to achieve economies of scale, lowering average costs and raising output.
This improves allocative and productive efficiency, stimulating long-run growth (LRAS shifts right).
Diagram:
→ AD/AS diagram — Globalisation increases AD (via exports) and LRAS (via productivity gains), leading to higher real GDP and potential growth.
Evaluation (limitations):
However, heavy reliance on a narrow export base can make developing economies vulnerable to global demand shocks (e.g., falling commodity prices).
Some may experience Dutch disease, where growth in export sectors crowds out others, stunting diversification (e.g., oil economies like Nigeria).
Paragraph 2 — Globalisation promotes growth through FDI and technology transfer
1st Chain of reasoning (FDI inflows):
MNCs establish operations in developing countries, bringing foreign direct investment (FDI) that injects capital and creates employment.
FDI can raise productivity and stimulate industrialisation — e.g., China’s Open Door Policy (1978) attracted MNCs such as Volkswagen and Apple, transforming it into a global manufacturing hub.
This increases the productive capacity of the economy, shifting LRAS rightwards.
2nd Chain of reasoning (Technology and human capital spillovers):
Globalisation spreads technology and management expertise, improving local production methods.
Workers gain skills and training, leading to higher human capital and long-term sustainable growth.
For instance, India’s IT sector developed through global outsourcing, boosting GDP and service exports.
Evaluation (limitations):
However, MNCs may repatriate profits to home countries, limiting local multiplier effects.
FDI can be concentrated in low-wage, low-value-added sectors, leading to limited technological spillovers.
Furthermore, weak governance and corruption may prevent developing nations from retaining the benefits of FDI.
Paragraph 3 (optional for 25-mark excellence) — Potential negative impacts on growth
1st Chain of reasoning (inequality and dependency):
Globalisation can widen income inequality within developing nations as skilled workers benefit more than unskilled ones.
Rising inequality can hinder long-term growth by reducing aggregate demand and limiting investment in human capital.
2nd Chain of reasoning (environmental degradation):
Increased industrial activity driven by MNCs can cause pollution and resource depletion, undermining sustainable growth.
For instance, lax environmental regulations in Bangladesh’s garment industry have caused long-term costs that reduce welfare and future growth potential.
Evaluation:
Yet, sustainable FDI and regulatory frameworks (e.g., green industrial policies) can ensure growth remains inclusive and environmentally sound.
Judgement / Conclusion
Overall, globalisation has been a powerful catalyst for economic growth in many developing economies, particularly those that have adopted export-oriented and market-friendly policies (e.g. China, Vietnam, India). However, its success depends on domestic institutions, infrastructure, and governance. Countries that fail to manage FDI, diversify exports, or invest in education often see limited benefits or even harmful dependence.
Therefore, the impact of globalisation on growth in developing countries is conditional — it promotes rapid growth when complemented by sound policy and inclusive development strategies, but can exacerbate vulnerability and inequality when mismanaged.
Application (AO2 examples)
China (1978–present) — FDI-driven manufacturing boom
Vietnam — export-led growth model
India — service-sector and IT globalisation
Bangladesh — textile exports, but low wages and poor conditions
Nigeria — oil dependence and limited diversification
Discuss the impact of globalisation on income inequality.
Introduction
Globalisation refers to the increasing interconnectedness of economies worldwide through trade, investment, migration, and technology transfer. It can affect income inequality both between countries (global inequality) and within countries (domestic inequality). While globalisation has lifted hundreds of millions out of poverty, especially in emerging economies, it has also created winners and losers, contributing to widening gaps within nations. This essay will analyse both the reduction of global inequality and the widening of domestic inequality, before reaching a balanced conclusion.
(AO1 definition + AO2 context + AO3 line of argument)
Paragraph 1 — Globalisation reduces inequality between countries
1st Chain of reasoning (FDI and growth in developing economies):
Globalisation promotes foreign direct investment (FDI) flows to developing economies.
FDI brings capital, technology, and skills, increasing productivity and employment.
This drives economic growth and raises average incomes, narrowing the income gap between rich and poor nations.
For example, China’s integration into the global economy through export-led growth lifted around 800 million people out of poverty, reducing global inequality.
2nd Chain of reasoning (Access to global markets):
Developing nations can access larger export markets, specialising according to comparative advantage.
This allows them to move up the value chain, improving national income per capita.
For instance, Vietnam’s textile and electronics exports have significantly raised GDP and living standards.
Diagram (appropriate):
→ World Production Possibility Frontier (PPF) — globalisation shifts the world PPF outwards as resources are allocated more efficiently through trade and specialisation.
(Label X and Y as different goods; show outward shift of PPF.)
Evaluation (limitations):
However, the benefits may be concentrated in specific sectors or regions, leaving rural or informal workers behind.
Moreover, countries without infrastructure or human capital to attract FDI — e.g. many in Sub-Saharan Africa — may be excluded, perpetuating inequality between global regions.
Paragraph 2 — Globalisation increases inequality within countries
1st Chain of reasoning (Skilled vs unskilled wage gap):
In advanced and emerging economies, globalisation increases demand for skilled labour (to operate technology, manage MNEs) while reducing demand for low-skilled labour exposed to global competition.
This widens the wage differential between high- and low-skilled workers.
For example, in the UK and US, real wages for manufacturing workers have stagnated, while returns to education and capital have risen.
2nd Chain of reasoning (Capital mobility and profit concentration):
Globalisation allows multinational firms to locate production where costs are lowest and repatriate profits.
This boosts the income and wealth of shareholders and executives in developed nations but reduces bargaining power for domestic workers.
Consequently, income from capital rises faster than income from labour, increasing within-country inequality (Piketty’s theory).
Diagram (appropriate):
→ Lorenz curve / Gini coefficient — globalisation can make the curve more bowed (higher Gini), showing rising inequality within nations.
Evaluation (limitations):
However, government intervention (e.g. progressive taxation, education spending, minimum wage laws) can mitigate inequality.
Also, access to cheaper imported goods increases real purchasing power for low-income consumers, partially offsetting income inequality.
Judgement / Conclusion
In conclusion, globalisation’s overall impact on inequality is ambiguous and context-dependent. It has clearly narrowed global inequality by enabling the rapid growth of emerging economies such as China and India, yet it has also widened income gaps within many advanced and developing nations due to skill-biased technological change and capital mobility. The extent of inequality therefore depends on domestic policies — such as education, redistribution, and labour market regulation — which determine how the gains from globalisation are shared. Without inclusive policies, globalisation risks entrenching inequality even as it raises global prosperity.
Application Summary (AO2 examples)
China’s export-led growth → reduced poverty, narrowed global inequality
Vietnam → rapid GDP growth from trade integration
UK and US manufacturing decline → skill-based inequality
Sub-Saharan Africa → limited FDI → persistent poverty
Evaluate whether globalisation has reduced poverty in developing economies.
Introduction
Globalisation refers to the increasing economic integration between countries through trade, capital, labour, and information flows. For developing countries, globalisation can be a key driver of economic growth—defined as the increase in real GDP over time—by expanding markets, attracting investment, and promoting efficiency. However, its impact is not uniform, as benefits can be offset by structural weaknesses, inequality, and external vulnerability. This essay will analyse how globalisation promotes growth in developing countries through trade and FDI, before evaluating limitations such as income inequality, dependence, and volatility.
Paragraph 1 — Globalisation promotes growth through trade and specialisation
1st Chain of reasoning (comparative advantage & export-led growth):
Globalisation enables developing countries to specialise in goods where they have a comparative advantage, such as labour-intensive manufacturing or primary goods.
By exporting to global markets, they achieve export-led growth, increasing aggregate demand (AD) and GDP.
For example, Vietnam has leveraged low-cost labour to become a major exporter of textiles and electronics, achieving average GDP growth above 6% annually.
Increased export earnings fund infrastructure, health, and education, fostering long-term development.
2nd Chain of reasoning (economies of scale and competition):
Open trade exposes domestic firms to international competition, encouraging efficiency and innovation.
Larger export markets allow firms to achieve economies of scale, lowering average costs and raising output.
This improves allocative and productive efficiency, stimulating long-run growth (LRAS shifts right).
Diagram:
→ AD/AS diagram — Globalisation increases AD (via exports) and LRAS (via productivity gains), leading to higher real GDP and potential growth.
Evaluation (limitations):
However, heavy reliance on a narrow export base can make developing economies vulnerable to global demand shocks (e.g., falling commodity prices).
Some may experience Dutch disease, where growth in export sectors crowds out others, stunting diversification (e.g., oil economies like Nigeria).
Paragraph 2 — Globalisation promotes growth through FDI and technology transfer
1st Chain of reasoning (FDI inflows):
MNCs establish operations in developing countries, bringing foreign direct investment (FDI) that injects capital and creates employment.
FDI can raise productivity and stimulate industrialisation — e.g., China’s Open Door Policy (1978) attracted MNCs such as Volkswagen and Apple, transforming it into a global manufacturing hub.
This increases the productive capacity of the economy, shifting LRAS rightwards.
2nd Chain of reasoning (Technology and human capital spillovers):
Globalisation spreads technology and management expertise, improving local production methods.
Workers gain skills and training, leading to higher human capital and long-term sustainable growth.
For instance, India’s IT sector developed through global outsourcing, boosting GDP and service exports.
Evaluation (limitations):
However, MNCs may repatriate profits to home countries, limiting local multiplier effects.
FDI can be concentrated in low-wage, low-value-added sectors, leading to limited technological spillovers.
Furthermore, weak governance and corruption may prevent developing nations from retaining the benefits of FDI.
Paragraph 3 (optional for 25-mark excellence) — Potential negative impacts on growth
1st Chain of reasoning (inequality and dependency):
Globalisation can widen income inequality within developing nations as skilled workers benefit more than unskilled ones.
Rising inequality can hinder long-term growth by reducing aggregate demand and limiting investment in human capital.
2nd Chain of reasoning (environmental degradation):
Increased industrial activity driven by MNCs can cause pollution and resource depletion, undermining sustainable growth.
For instance, lax environmental regulations in Bangladesh’s garment industry have caused long-term costs that reduce welfare and future growth potential.
Evaluation:
Yet, sustainable FDI and regulatory frameworks (e.g., green industrial policies) can ensure growth remains inclusive and environmentally sound.
Judgement / Conclusion
Overall, globalisation has been a powerful catalyst for economic growth in many developing economies, particularly those that have adopted export-oriented and market-friendly policies (e.g. China, Vietnam, India). However, its success depends on domestic institutions, infrastructure, and governance. Countries that fail to manage FDI, diversify exports, or invest in education often see limited benefits or even harmful dependence.
Therefore, the impact of globalisation on growth in developing countries is conditional — it promotes rapid growth when complemented by sound policy and inclusive development strategies, but can exacerbate vulnerability and inequality when mismanaged.
Application (AO2 examples)
China (1978–present) — FDI-driven manufacturing boom
Vietnam — export-led growth model
India — service-sector and IT globalisation
Bangladesh — textile exports, but low wages and poor conditions
Nigeria — oil dependence and limited diversification
Sub-Saharan Africa — limited infrastructure restricts global integration
Assess the view that globalisation leads to economic convergence between countries.
Introduction
Economic convergence refers to the process by which poorer countries’ incomes grow faster than richer countries’, narrowing the gap in GDP per capita over time. Globalisation — the increasing integration of economies through trade, capital, labour, and technology flows — is often seen as a mechanism driving this convergence by spreading ideas, investment, and productivity. However, convergence is not automatic: institutional weaknesses, uneven access to technology, and global inequalities can produce divergence instead. This essay will assess the extent to which globalisation fosters convergence, using both empirical evidence and theoretical reasoning.
(AO1 = definitions; AO2 = context; AO3 = argument outline)
Paragraph 1 — Globalisation promotes convergence through trade and FDI
1st Chain of reasoning (trade and comparative advantage):
Globalisation enables developing countries to specialise in industries where they have a comparative advantage, expanding exports.
This raises income and productivity, allowing catch-up growth with developed economies.
For example, Vietnam’s export-led industrialisation (in electronics and textiles) has rapidly raised per capita income, narrowing the gap with advanced economies.
As trade integrates economies, technology and capital spread across borders, fostering convergence.
2nd Chain of reasoning (FDI and technology transfer):
Globalisation encourages FDI from multinational corporations (MNCs) seeking low-cost production locations.
This brings technology, management know-how, and skills to developing nations, boosting total factor productivity.
For instance, China’s FDI-led industrial growth post-1978 saw rapid GDP per capita growth of ~10% annually, converging towards OECD levels.
According to neoclassical growth theory, capital mobility allows poorer countries (with lower capital-to-labour ratios) to enjoy higher marginal returns, accelerating growth and convergence.
Diagram (appropriate):
→ Solow growth model diagram: show poorer country (low capital per worker) catching up to richer country’s steady-state income due to capital inflows and technology diffusion.
Evaluation:
However, convergence assumes efficient institutions and absorptive capacity.
Many developing countries lack human capital and infrastructure to absorb technology effectively.
In Sub-Saharan Africa, despite openness, growth has lagged due to weak governance, corruption, and poor infrastructure — causing divergence rather than convergence.
Paragraph 2 — Globalisation can cause divergence through unequal benefits
1st Chain of reasoning (skill-biased globalisation):
Globalisation often benefits skilled workers and capital owners more than low-skilled labour, increasing within-country inequality.
Developing nations may remain locked into low value-added production (e.g., raw materials, simple manufacturing) while rich nations dominate high-tech sectors.
This “unequal integration” slows relative income growth, reinforcing divergence.
For example, Bangladesh’s garment sector generates growth but at low wages and limited technology transfer, preventing real convergence with advanced economies.
2nd Chain of reasoning (terms of trade and dependency):
Globalisation can worsen terms of trade for primary-goods exporters as global prices fluctuate, reducing income stability.
This fosters dependency on developed economies for technology and demand, limiting self-sustaining growth.
Dependency theory argues that MNCs extract surplus from poorer countries, reinforcing divergence.
Diagram (optional alternative):
→ Lorenz curve or world income distribution: shows persistent global income gaps despite rising global trade and FDI.
Evaluation:
Nonetheless, globalisation’s impact depends on policy frameworks: countries like South Korea and Singapore used openness alongside education and industrial policy to achieve convergence.
Hence, divergence is not inevitable — it reflects how globalisation is managed, not globalisation itself.
Judgement / Conclusion
Overall, globalisation has the potential to promote economic convergence, but this depends on whether developing countries possess the institutions, education, and infrastructure to absorb technology and compete globally. Evidence suggests conditional convergence: countries that integrate effectively and implement sound policies (e.g., East Asia) converge rapidly, whereas those with structural weaknesses (e.g., many Sub-Saharan nations) diverge. Therefore, globalisation is a necessary but not sufficient condition for convergence — it provides the opportunities, but national policies determine whether those opportunities are realised.
Application (AO2 examples)
China (1978–present) — convergence via FDI and export-led growth
Vietnam — rapid GDP growth and global integration
South Korea & Singapore — policy-driven convergence with high-income nations
Bangladesh — export growth but limited technological upgrading
Sub-Saharan Africa — persistent divergence despite openness
World Bank data — global inequality between countries has narrowed, but within-country inequality has risen
To what extent does globalisation benefit producers more than consumers?
Introduction
Globalisation is the process of increasing economic integration across countries through trade, investment, technology, and labour mobility. Producers and consumers are affected differently: producers may benefit from access to larger markets and cheaper inputs, while consumers can benefit from lower prices and greater variety of goods. This essay will analyse the impacts on both groups, evaluating whether the gains are evenly distributed or whether one group benefits more. Evidence from global trade, multinational corporations (MNCs), and digital markets will be applied.
(AO1 = definition, AO2 = context, AO3 = argument outline)
Paragraph 1 — Benefits to producers
1st Chain of reasoning (larger markets and economies of scale):
Globalisation allows producers to sell goods internationally, expanding their market beyond domestic borders.
Larger markets enable economies of scale, reducing average costs and increasing profit margins.
For example, Apple sells products worldwide, maximising returns from R&D investment and lowering per-unit costs.
2nd Chain of reasoning (FDI and technology transfer):
Producers benefit from foreign direct investment (FDI), which brings capital, technology, and management expertise.
MNCs establish operations in developing countries, enhancing productivity and access to global supply chains.
Toyota in the UK improved manufacturing efficiency and domestic suppliers’ capabilities, increasing producer surplus.
Diagram (appropriate):
→ SRAS/AD or supply-demand diagram: lower production costs (shift SRAS right) increase producer surplus and output.
Evaluation:
However, global competition can also pressure domestic producers to reduce costs or close inefficient firms.
Not all producers gain equally — small firms may lack resources to compete internationally, benefiting mainly large firms.
Paragraph 2 — Benefits to consumers
1st Chain of reasoning (lower prices and variety):
Trade liberalisation and global supply chains reduce production costs, allowing firms to sell goods more cheaply.
Consumers benefit from lower prices, more choice, and higher quality products.
For example, imports of electronics and clothing from Asia have significantly reduced prices in the UK and US.
2nd Chain of reasoning (innovation and quality improvements):
Global competition encourages firms to innovate, benefiting consumers through better products and services.
Access to global digital services (e.g., Netflix, Spotify) gives consumers worldwide unprecedented content and choice.
Diagram (appropriate):
→ Supply and demand: globalisation shifts supply curve right (lower costs), increasing consumer surplus and reducing equilibrium price.
Evaluation:
However, consumers may face non-price costs, such as environmental damage or exploitation in production (e.g., fast fashion).
Some gains are concentrated in wealthier consumer groups; poorer consumers may not access certain products or services.
Paragraph 3 — Comparative assessment (extent of benefit)
Producers often capture direct financial gains through profits, economies of scale, and global expansion.
Consumers benefit indirectly through lower prices and product variety, but gains can be diffuse and spread thinly across populations.
Some studies suggest producer surplus may grow faster than consumer surplus in developing countries due to limited purchasing power and global supply chains extracting surplus.
Policy interventions (e.g., competition law, trade tariffs) can shift the balance, increasing consumer benefits or protecting domestic producers.
Judgement / Conclusion
In conclusion, globalisation benefits both producers and consumers, but the extent varies by context. Large firms and MNCs tend to capture more concentrated and tangible benefits (profits, market expansion, technology gains), while consumers benefit through lower prices and greater choice, which is more dispersed. Overall, globalisation may slightly favour producers, particularly in economies open to FDI and export-led growth, but well-functioning markets, competition, and regulatory frameworks can ensure that consumer gains are significant and sustainable.
Application (AO2 examples)
Apple and Samsung — global sales, economies of scale, profit growth
Toyota UK — FDI and productivity gains for producers
UK clothing imports from Bangladesh/China — cheaper consumer goods
Netflix, Spotify — consumer access to global content
Fast fashion — producer gains, but consumer welfare mixed with ethical concerns
Evaluate the impact of globalisation on the environment.
Introduction
Globalisation refers to the growing integration of economies worldwide through trade, capital flows, migration, and the spread of technology. This process has profound environmental implications, both positive and negative. On one hand, globalisation can increase pollution, resource depletion, and carbon emissions through higher production and transportation. On the other hand, it can promote the spread of green technology, international environmental standards, and global cooperation. This essay will analyse these impacts and assess the overall effect of globalisation on environmental sustainability.
(AO1 definition + AO2 context + AO3 line of argument)
Paragraph 1 — Negative environmental impacts
1st Chain of reasoning (increased production and resource use):
Globalisation encourages export-led growth, industrialisation, and mass production to supply global markets.
This leads to higher consumption of natural resources (water, minerals, fossil fuels) and higher levels of pollution.
For example, China’s rapid industrialisation to meet global demand increased CO₂ emissions, making it the world’s largest emitter.
2nd Chain of reasoning (transport and carbon emissions):
Increased global trade requires long-distance transport of goods via ships, planes, and trucks.
This contributes significantly to greenhouse gas emissions and climate change.
For instance, shipping 90% of global trade produces around 3% of global CO₂ emissions annually.
Diagram (appropriate):
→ Negative externality diagram: Supply curve shifts left due to environmental costs not reflected in market prices; social cost exceeds private cost, leading to overproduction and environmental degradation.
Evaluation:
However, not all globalisation-driven production harms the environment equally — some sectors are more resource-intensive than others.
Environmental damage can be mitigated by regulations, carbon pricing, or cleaner technologies.
Paragraph 2 — Positive environmental impacts
1st Chain of reasoning (technology and knowledge transfer):
Globalisation facilitates the spread of green technology and knowledge across countries.
MNCs and trade networks can introduce renewable energy technologies, efficient production processes, and environmental standards to developing countries.
For example, solar panel technology from Germany has been adopted in India and China, reducing reliance on fossil fuels.
2nd Chain of reasoning (international cooperation and regulation):
Globalisation allows countries to coordinate international environmental agreements to tackle issues like climate change.
Examples include the Paris Agreement (2015) and WTO environmental standards, which are more enforceable due to economic interdependence.
This encourages firms and governments to internalise environmental costs and reduce pollution.
Diagram (optional):
→ Pigouvian tax / market correction: introducing environmental regulation shifts supply curve left to account for external costs, reducing overproduction.
Evaluation:
However, international agreements are voluntary and often unevenly enforced, so benefits can be limited.
Technology transfer often depends on profit incentives rather than environmental necessity, so adoption may be slow in poorer nations.
Paragraph 3 — Balancing positive and negative impacts
The net effect of globalisation on the environment is ambiguous.
While global trade and industrialisation can increase pollution, globalisation also spreads cleaner technologies, best practices, and awareness, potentially mitigating environmental damage.
Policy frameworks, corporate social responsibility, and consumer preferences play a key role in determining the balance.
Sustainable development depends on linking economic growth with environmental protection — globalisation can facilitate this but does not guarantee it.
Judgement / Conclusion
In conclusion, globalisation has a mixed impact on the environment. Its expansion of production, transport, and consumption has increased environmental pressures in terms of emissions, resource depletion, and pollution. However, it has also enabled international cooperation, technology transfer, and the adoption of environmental standards, which can mitigate these negative effects. The overall impact depends heavily on government policies, global agreements, and corporate practices. Therefore, globalisation can be compatible with environmental sustainability, but only if accompanied by strong regulations and incentives for green growth.
Application (AO2 examples)
China’s industrialisation → high CO₂ emissions
Global shipping industry → 3% of global emissions
Solar technology transfer → Germany to India/China
Paris Agreement 2015 → international coordination
Fast fashion industry → pollution, overconsumption, but increasing regulation (e.g., Bangladesh Accord on Fire and Building Safety)
Carbon pricing and green taxes → internalising externalities
To what extent is globalisation a force for good?
Introduction
Globalisation is the increasing integration and interdependence of economies and societies worldwide, through trade, investment, technology, and the movement of labour and information. It has the potential to deliver economic growth, poverty reduction, technological progress, and cultural exchange. However, it also poses challenges, including inequality, environmental degradation, and cultural homogenisation. This essay will analyse the extent to which globalisation is beneficial, considering its economic, social, and environmental impacts, and will evaluate the conditions under which it can be considered a force for good.
(AO1 = definition; AO2 = context; AO3 = line of argument)
Paragraph 1 — Economic benefits of globalisation
1st Chain of reasoning (trade and growth):
Globalisation enables countries to specialise according to comparative advantage and access larger markets.
Export-led growth increases GDP, employment, and income.
Example: China and Vietnam experienced rapid economic growth and poverty reduction through integration into global trade networks.
2nd Chain of reasoning (FDI and technology transfer):
Multinational corporations bring capital, skills, and technology to host countries.
Knowledge and technology spillovers improve productivity and innovation.
Example: India’s IT sector developed through outsourcing contracts from Western countries, creating jobs and raising living standards.
Diagram (optional):
→ AD/AS model: export-led growth and FDI increase AD and LRAS, raising output and income.
Evaluation:
Benefits are uneven; some countries or sectors gain more than others.
Small domestic firms may be outcompeted, and low-skilled workers in developed countries may lose out.
Paragraph 2 — Social and cultural benefits
1st Chain of reasoning (poverty reduction and living standards):
Rising economic growth allows investment in health, education, and infrastructure, improving quality of life.
Example: Global integration lifted 800 million Chinese citizens out of extreme poverty since 1980.
2nd Chain of reasoning (cultural exchange and connectivity):
Globalisation promotes cultural exchange, knowledge sharing, and international collaboration.
Example: global access to information, digital services, and entertainment such as Netflix and online education.
Evaluation:
However, globalisation can homogenise cultures, eroding local traditions.
Benefits may be concentrated among urban populations, leaving rural or marginalised groups behind.
Paragraph 3 — Environmental and ethical concerns
1st Chain of reasoning (environmental costs):
Increased production, transportation, and consumption raise carbon emissions, resource depletion, and pollution.
Example: China’s industrialisation and global shipping contribute to high CO₂ emissions.
2nd Chain of reasoning (inequality and exploitation):
Globalisation can increase inequality within and between countries.
Labour exploitation in low-cost manufacturing sectors, e.g., Bangladesh garment factories, highlights ethical concerns.
Diagram (optional):
→ Negative externality: social costs exceed private costs, showing environmental and social harm.
Evaluation:
Yet globalisation also spreads green technologies, global environmental standards, and CSR practices, mitigating harm.
Example: adoption of solar technology and international climate agreements.
Judgement / Conclusion
Globalisation can be considered a force for good, but its benefits are conditional. Economically, it drives growth, innovation, and poverty reduction; socially, it fosters knowledge sharing and global connectivity. However, without strong institutions, regulation, and policy frameworks, globalisation can exacerbate inequality, environmental degradation, and cultural homogenisation. Overall, globalisation is potentially beneficial, but its “goodness” depends on how it is managed, regulated, and distributed.
Application (AO2 examples)
China and Vietnam — export-led growth, poverty reduction
India IT sector — technology transfer and employment
Bangladesh garment industry — economic growth but ethical concerns
Netflix, Spotify — global access to digital content
Global environmental agreements — Paris Agreement, solar technology adoption
Multinational corporations — FDI and knowledge transfer
Analyse how comparative advantage leads to gains from trade.
Introduction
Comparative advantage occurs when a country can produce a good or service at a lower opportunity cost than another country. According to the theory of comparative advantage, even if one country is less efficient in producing all goods, it can still benefit from trade by specialising in goods where it has the lowest opportunity cost. This specialisation allows countries to produce and consume beyond their domestic production possibility frontier (PPF), creating gains from trade for all trading partners. This essay will analyse the mechanism through which comparative advantage generates trade gains, supported by diagrams and real-world examples.
(AO1 = definition, AO2 = context, AO3 = outline of argument)
Paragraph 1 — Specialisation and efficiency
1st Chain of reasoning (specialisation according to opportunity cost):
By identifying comparative advantage, countries specialise in goods they produce most efficiently relative to others, minimising opportunity costs.
Specialisation allows resources to be allocated more efficiently, raising total global output.
Example: Brazil specialises in coffee production, while the US specialises in wheat production. Each produces more efficiently than attempting self-sufficiency.
2nd Chain of reasoning (trading allows consumption beyond PPF):
Once countries specialise, they can trade surpluses for goods they produce less efficiently.
This enables both countries to consume combinations of goods beyond their own PPF, representing a gain from trade.
Diagram (appropriate):
→ PPF and gains from trade diagram:
Draw two countries’ PPFs; show production points with specialisation and trade allowing consumption beyond PPF.
Evaluation:
Gains depend on the terms of trade — if terms are too unfavourable, one country may gain very little.
Specialisation can create dependency on other countries, increasing vulnerability to external shocks.
Paragraph 2 — Dynamic gains and efficiency improvements
1st Chain of reasoning (economies of scale and lower costs):
Specialisation allows firms and countries to produce larger quantities of fewer goods, achieving economies of scale.
Lower average costs increase output efficiency and consumer welfare through lower prices.
Example: Japanese car manufacturers specialise in cars for export markets, achieving scale and lower unit costs.
2nd Chain of reasoning (technological and knowledge transfer):
International trade encourages innovation and adoption of new technologies, as countries compete and exchange goods.
Access to new technologies can improve production efficiency, creating further gains from trade over time.
Example: South Korea imported machinery and technology, improving domestic production capacity in electronics.
Diagram (optional):
→ Supply curve or LRAS shift: trade and specialisation shift LRAS outward, showing potential output gains.
Evaluation:
Comparative advantage assumes perfect mobility of factors within countries and no transport costs, which may not hold in reality.
Gains are often unevenly distributed between producers and consumers, and some sectors may lose out due to competition.
Judgement / Conclusion
In conclusion, comparative advantage generates gains from trade by allowing countries to specialise efficiently and exchange goods, increasing total global output and enabling consumption beyond domestic limits. Dynamic effects such as economies of scale and technology transfer amplify these gains. However, the benefits depend on terms of trade, infrastructure, and factor mobility, and some groups within countries may experience losses. Overall, comparative advantage provides a powerful theoretical basis for understanding the mutual benefits of trade, while recognising real-world limitations.
Application (AO2 examples)
Brazil — coffee; US — wheat
Japan — car exports achieving economies of scale
South Korea — technology transfer through trade in electronics
China — low-cost manufacturing for global markets
EU trade integration — countries specialise according to comparative advantage
Evaluate whether countries always benefit from specialising according to comparative advantage.
Introduction
Comparative advantage occurs when a country can produce a good at a lower opportunity cost than another. According to trade theory, specialisation in goods where a country has comparative advantage allows for efficient allocation of resources, higher total output, and the potential for gains from trade. However, whether countries always benefit from such specialisation is contested, as outcomes depend on terms of trade, factor mobility, external shocks, and distributional effects. This essay will analyse the benefits of specialisation and evaluate the circumstances under which it may not lead to net gains.
(AO1 = definition, AO2 = context, AO3 = outline of evaluation)
Paragraph 1 — Benefits of specialisation according to comparative advantage
1st Chain of reasoning (efficient resource allocation and output gains):
By specialising in goods where opportunity cost is lowest, countries use scarce resources more efficiently.
Total world output rises, and countries can trade surpluses for other goods, consuming beyond their PPF.
Example: Brazil (coffee) and US (wheat) can produce more collectively than if both attempted self-sufficiency.
2nd Chain of reasoning (economies of scale and productivity gains):
Specialisation allows firms to produce larger quantities of fewer goods, reducing average costs via economies of scale.
This increases competitiveness and can stimulate investment and innovation.
Example: Japanese car industry specialises in exports, achieving lower unit costs and higher productivity.
Diagram (appropriate):
→ PPF diagram: show production beyond PPF via specialisation and trade.
Evaluation:
Gains from specialisation depend on favourable terms of trade. If global prices are unfavourable, a country may gain very little or even lose relative to domestic production.
Assumes factor mobility: if labour or capital cannot move efficiently, some sectors may experience unemployment or underutilisation.
Paragraph 2 — Circumstances where specialisation may not benefit countries
1st Chain of reasoning (vulnerability to external shocks):
Specialisation may increase dependency on a narrow range of exports.
Price volatility in global markets (e.g., oil, commodities) can cause economic instability.
Example: Nigeria’s reliance on oil exports means fluctuations in oil prices significantly affect GDP and government revenue.
2nd Chain of reasoning (dynamic comparative advantage and structural change):
Comparative advantage may change over time as technology and global demand evolve.
Locking into low-value, primary-product specialisation can trap countries in low-income positions (dependency theory).
Example: Bangladesh’s garment industry provides employment but limits opportunities to move up the value chain.
Evaluation:
Specialisation can increase inequality, as urban export sectors gain while rural or informal sectors may stagnate.
Environmental costs may arise if countries focus on resource-intensive or polluting industries, reducing sustainable welfare.
Paragraph 3 — Mitigating factors and policy considerations
Governments can moderate risks through industrial policy, diversification, and education, ensuring that specialisation is dynamic rather than static.
Specialisation need not be total; partial specialisation allows countries to benefit from comparative advantage while reducing vulnerability.
Example: South Korea gradually shifted from textiles to electronics, evolving its comparative advantage.
Judgement / Conclusion
Countries often benefit from specialising according to comparative advantage, as it allows for efficient resource allocation, higher output, and trade gains. However, specialisation does not automatically guarantee net benefits. Gains depend on terms of trade, factor mobility, market volatility, and the ability to adapt to changing conditions. Therefore, while comparative advantage provides a strong theoretical rationale for trade, countries benefit conditionally — specialisation is advantageous when paired with diversification strategies, investment in human capital, and effective economic policies.
Application (AO2 examples)
Brazil and US — traditional example of comparative advantage in coffee and wheat
Japan — automotive export specialisation, economies of scale
Nigeria — dependence on oil exposes vulnerability to external shocks
Bangladesh — garment exports, low-value specialisation
South Korea — dynamic specialisation moving up the value chain
Discuss the impact of changing terms of trade on a country’s economy.
Introduction
Terms of trade (TOT) measures the ratio of export prices to import prices. A rise in TOT (export prices increase relative to import prices) allows a country to buy more imports for a given quantity of exports, while a fall in TOT reduces purchasing power. Changes in TOT can have significant effects on a country’s national income, economic growth, inflation, and balance of payments. This essay will analyse how improvements or deterioration in TOT impact an economy, using diagrams, examples, and evaluation to assess overall effects.
(AO1 definition, AO2 context, AO3 argument outline)
Paragraph 1 — Positive impacts of improving terms of trade
1st Chain of reasoning (higher real income and consumption):
An improvement in TOT means a country can purchase more imports for the same quantity of exports, increasing real national income.
This allows higher consumption and investment, potentially raising GDP and living standards.
Example: OPEC countries in the 1970s experienced rising oil prices (TOT improvement), boosting national income and government spending.
2nd Chain of reasoning (improved current account and fiscal position):
Higher export prices relative to imports improve the trade balance, leading to a surplus in the current account.
Governments may collect higher tax revenues from export industries, funding public services and infrastructure.
Example: Australia’s mining boom in the 2000s improved TOT through high commodity prices, benefiting exports and government budgets.
Diagram:
→ Terms of trade diagram / PPF / AD-AS: improved TOT shifts AD right, raising output and income.
Evaluation:
The extent of the benefit depends on export concentration — countries reliant on a few commodities gain more, but diversification reduces vulnerability.
TOT gains may be temporary if global prices fluctuate.
Paragraph 2 — Negative impacts of deteriorating terms of trade
1st Chain of reasoning (reduced real income and welfare loss):
A fall in TOT means a country must export more goods to purchase the same quantity of imports, reducing real income.
This lowers consumption, investment, and government revenue, potentially slowing economic growth.
Example: Sub-Saharan African countries reliant on primary commodities suffered during commodity price declines in the 1980s and 2010s.
2nd Chain of reasoning (inflationary pressures and balance of payments problems):
Deteriorating TOT can increase import costs, contributing to imported inflation.
A fall in TOT may worsen the current account, causing depreciation pressure on the currency, raising import costs further.
Example: Nigeria experienced deteriorating TOT with falling oil prices in 2014–2015, leading to inflation and currency pressure.
Diagram (optional):
→ Terms of trade deterioration: real income loss can be illustrated by a downward shift of the consumption possibilities frontier.
Evaluation:
Some countries may hedge against TOT fluctuations via diversification, stabilisation funds, or flexible exchange rates.
Short-term TOT shocks may be offset if long-term growth depends on technological progress or FDI inflows.
Paragraph 3 — Distributional and structural considerations
Changes in TOT affect different sectors differently: export industries gain while import-competing sectors may face higher costs.
Commodity-dependent developing countries are more vulnerable, whereas diversified economies can absorb fluctuations.
Policy responses, such as stabilisation funds, hedging, or trade diversification, influence the net impact.
Judgement / Conclusion
In conclusion, changing terms of trade have significant implications for a country’s economy, affecting real income, consumption, investment, inflation, and the balance of payments. An improvement in TOT generally raises welfare and national income, while a deterioration reduces purchasing power and may cause inflation or current account deficits. The overall impact depends on factors such as export composition, policy responses, diversification, and global market conditions. Therefore, while TOT changes can be powerful economic forces, their net effect is conditional on country-specific structures and policies.
Application (AO2 examples)
OPEC oil price rises (1970s) — TOT improvement, higher income
Australia mining boom (2000s) — TOT improvement through commodity exports
Nigeria oil price fall (2014–2015) — TOT deterioration, inflation, currency pressure
Sub-Saharan Africa commodity dependency — TOT deterioration impacts
Policy examples — sovereign wealth funds, export diversification, hedging strategies
Evaluate the economic effects of trade liberalisation.
Introduction
Trade liberalisation refers to the removal or reduction of barriers to trade, such as tariffs, quotas, and subsidies, allowing goods, services, and capital to flow more freely between countries. It aims to increase economic efficiency, expand markets, and stimulate growth. While it can benefit consumers and producers, it also has distributional and structural impacts that may disadvantage certain sectors or countries. This essay will analyse both the positive and negative economic effects of trade liberalisation and evaluate the overall impact.
(AO1 = definition, AO2 = context, AO3 = outline of argument)
Paragraph 1 — Positive economic effects
1st Chain of reasoning (allocative and productive efficiency):
Trade liberalisation promotes specialisation according to comparative advantage, improving resource allocation.
Countries produce goods at lower opportunity costs, increasing world output.
Example: EU single market — member states specialise in sectors where they are most efficient, boosting GDP and efficiency.
2nd Chain of reasoning (consumer benefits and market expansion):
Removal of tariffs and quotas reduces prices and increases variety for consumers.
Larger markets allow firms to achieve economies of scale, lowering average costs and improving competitiveness.
Example: UK imports of electronics and clothing from Asia provide cheaper goods and greater choice.
Diagram:
→ Supply and demand diagram: shift in supply curve right due to removal of tariffs → lower price and higher quantity, illustrating consumer surplus gains.
Evaluation:
Gains are usually spread across the economy, but some domestic industries may struggle to compete with imports.
Short-term adjustment costs may reduce net gains initially.
Paragraph 2 — Negative economic effects
1st Chain of reasoning (industry disruption and structural unemployment):
Trade liberalisation can harm domestic producers unable to compete with low-cost imports.
Short-term unemployment arises in protected industries, reducing welfare and increasing government support costs.
Example: UK steel and manufacturing sectors faced challenges when exposed to cheaper foreign imports.
2nd Chain of reasoning (terms of trade and dependency risks):
Developing countries may become over-dependent on a narrow range of exports, vulnerable to global price fluctuations.
Gains from liberalisation can be offset if export prices fall relative to import prices (deteriorating terms of trade).
Example: Sub-Saharan African countries liberalised trade in the 1980s–1990s but faced volatile commodity prices.
Diagram (optional):
→ Market diagram: domestic supply affected by removal of protection → producer surplus falls while consumer surplus rises.
Evaluation:
Negative effects can be mitigated with transition assistance, diversification, and education.
The long-term benefits of efficiency and growth often outweigh short-term adjustment costs if policies are well-designed.
Paragraph 3 — Dynamic and long-term effects
Trade liberalisation encourages innovation, technology transfer, and investment through exposure to international competition.
Over time, liberalisation can increase productivity, wages, and economic growth, benefiting the economy as a whole.
Example: East Asian economies liberalised trade and integrated into global markets, experiencing rapid growth and industrial upgrading.
Evaluation:
Benefits are not automatic; institutional quality, infrastructure, and education determine whether countries can fully exploit liberalisation opportunities.
Judgement / Conclusion
In conclusion, trade liberalisation has clear economic benefits: increased efficiency, lower prices for consumers, expanded markets, economies of scale, and long-term growth. However, it also has short-term costs: unemployment, sectoral decline, and exposure to global volatility. The net effect is positive in the long run, provided that countries adopt policies to support affected industries, retrain workers, and diversify exports. Therefore, trade liberalisation is generally beneficial, but its effectiveness depends on complementary economic policies.
Application (AO2 examples)
EU single market — specialisation, efficiency gains
UK imports of electronics and clothing — consumer benefits
UK steel and manufacturing — short-term adjustment costs
Sub-Saharan Africa — vulnerability to volatile commodity prices
East Asian economies — long-term growth and technology transfer
Assess the benefits and costs of free trade.
Introduction
Free trade refers to the unrestricted exchange of goods and services between countries, without tariffs, quotas, or other barriers. It is often promoted as a means to increase efficiency, consumer choice, and global welfare, based on the theory of comparative advantage. However, free trade can also have negative economic, social, and environmental effects, particularly for domestic industries exposed to international competition. This essay will assess the benefits and costs of free trade, using diagrams, examples, and evaluation to determine the overall impact.
(AO1 = definition, AO2 = context, AO3 = outline of assessment)
Paragraph 1 — Benefits of free trade
1st Chain of reasoning (comparative advantage and efficiency):
Free trade allows countries to specialise in goods where they have comparative advantage, leading to more efficient resource allocation.
Total world output rises, and countries can consume beyond their PPF, achieving gains from trade.
Example: Brazil (coffee) and the US (wheat) specialise and trade, increasing global production.
2nd Chain of reasoning (consumer benefits and economies of scale):
Lower trade barriers reduce prices, increase variety, and improve quality for consumers.
Firms can produce for larger international markets, achieving economies of scale, lowering average costs, and fostering innovation.
Example: UK imports of electronics and clothing from Asia provide cheaper goods and wider choice.
Diagram:
→ PPF diagram / supply and demand diagram: show consumption beyond PPF, or supply curve shifts right reducing prices, increasing consumer surplus.
Evaluation:
Benefits depend on market access, competitiveness, and infrastructure.
Some gains are diffuse, spread thinly across consumers, while concentrated losses occur in uncompetitive domestic industries.
Paragraph 2 — Costs of free trade
1st Chain of reasoning (industry disruption and unemployment):
Domestic firms may struggle to compete with low-cost imports, leading to job losses and structural unemployment.
Example: UK steel and manufacturing sectors faced job losses when exposed to international competition.
2nd Chain of reasoning (terms of trade and dependency risks):
Developing countries specialising in primary products may be vulnerable to volatile global prices, reducing welfare.
Over-dependence on a narrow range of exports can cause economic instability.
Example: Sub-Saharan African countries liberalised trade in the 1980s–1990s but faced fluctuating commodity prices.
Diagram (optional):
→ Domestic supply with free trade: producer surplus falls, consumer surplus rises; net welfare may increase but losses concentrated in producers.
Evaluation:
Short-term costs can be mitigated with government support, retraining, and diversification.
Environmental and social costs may arise if trade promotes resource-intensive or polluting industries.
Paragraph 3 — Dynamic and long-term effects
Free trade encourages technology transfer, foreign investment, and competition, fostering innovation and productivity growth.
Over time, countries may upgrade industries, improve standards of living, and grow economically.
Example: East Asian economies used open trade policies to stimulate industrialisation and long-term growth.
Evaluation:
Benefits are not automatic; institutional quality, education, and policy frameworks determine the extent of gains.
Free trade may exacerbate inequality within countries unless complemented by redistributive measures.
Judgement / Conclusion
Free trade has significant benefits, including efficiency gains, higher output, consumer welfare, and long-term economic growth. However, it also imposes costs, particularly for uncompetitive industries, vulnerable workers, and resource-dependent economies. Overall, free trade is beneficial for countries in the long run, but net gains depend on complementary policies: government support for affected sectors, diversification, education, and environmental regulation. Properly managed, free trade can maximise welfare while minimising adverse effects.
Application (AO2 examples)
Brazil and US — comparative advantage in coffee and wheat
UK imports from Asia — cheaper electronics and clothing
UK steel/manufacturing — industry disruption
Sub-Saharan Africa — dependency on volatile commodity exports
East Asian economies — long-term growth via open trade policies
Evaluate the likely effects of protectionist policies on different stakeholders.
Introduction
Protectionist policies are government measures designed to restrict imports and protect domestic industries, such as tariffs, import quotas, and subsidies. They aim to shield domestic producers, preserve jobs, and improve the trade balance, but they also have wider economic effects, affecting consumers, producers, workers, governments, and foreign countries. This essay will analyse these effects, using diagrams and real-world examples, and evaluate the overall economic consequences for different stakeholders.
(AO1 = definition, AO2 = context, AO3 = outline of stakeholders affected)
Paragraph 1 — Effects on domestic producers and workers
1st Chain of reasoning (protection from foreign competition):
Tariffs, quotas, and subsidies raise the price of imports, making domestic goods more competitive.
Domestic producers increase output and revenue, potentially expanding and hiring more workers.
Example: US steel tariffs (2018) protected domestic steel producers, leading to higher domestic output.
2nd Chain of reasoning (investment and long-term growth for industries):
Protection can allow infant industries to develop without facing immediate international competition.
This can encourage capital investment and productivity growth in the long term.
Example: South Korea initially protected its steel and automotive sectors, which later became globally competitive.
Diagram:
→ Tariff diagram: import supply curve shifts, domestic price rises → domestic producers gain (producer surplus increases), higher output.
Evaluation:
Protection may reduce the incentive to innovate, leading to inefficiency.
Workers benefit in protected industries, but gains are concentrated and may not extend to the wider economy.
Paragraph 2 — Effects on consumers
1st Chain of reasoning (higher prices and reduced choice):
Tariffs and quotas increase the price of imported goods, raising costs for consumers.
Consumers face less choice and lower real income, reducing welfare.
Example: Higher tariffs on imported electronics in India increased domestic prices, reducing affordability.
2nd Chain of reasoning (potential retaliation and import costs):
Protection can lead to retaliation from other countries, reducing exports and increasing prices of imported goods.
This can exacerbate inflationary pressures and reduce consumption.
Example: US-China trade war (2018–2019) led to higher prices for US consumers on imported goods.
Diagram (optional):
→ Supply and demand for imports: tariff shifts supply curve → higher price, lower quantity consumed → loss of consumer surplus.
Evaluation:
Consumers in the short term lose out, but if protection allows domestic industry to grow efficiently, long-term benefits may emerge.
Inflationary effects are usually concentrated on price-sensitive goods.
Paragraph 3 — Effects on government and foreign countries
1st Chain of reasoning (government revenue and trade balance):
Tariffs generate tax revenue, which can be spent on public services or subsidies.
Protection can improve the trade balance if imports fall significantly.
2nd Chain of reasoning (impact on foreign producers and global trade):
Foreign exporters lose market access, reducing revenue and employment abroad.
Protectionist policies can disrupt global supply chains, affecting multinational companies.
Example: EU tariffs on Chinese solar panels limited imports and reduced Chinese exports to the EU.
Evaluation:
Retaliatory measures may negate any initial government gains from tariffs.
Global inefficiency arises, reducing total world welfare.
Paragraph 4 — Overall evaluation of stakeholder effects
Domestic producers and workers benefit in the short term through higher prices and job security, but efficiency and innovation may be reduced.
Consumers generally lose due to higher prices and reduced choice.
Government may gain revenue, but these gains are offset if retaliation occurs.
Foreign producers are negatively affected, and global trade efficiency declines.
The net effect depends on policy design, magnitude of protection, and the country’s long-term industrial strategy.
Judgement / Conclusion
In conclusion, protectionist policies benefit domestic producers and workers in protected industries and can generate government revenue, but they impose costs on consumers, foreign producers, and global efficiency. Retaliation and long-term inefficiencies may reduce net gains. Therefore, protection is beneficial in the short term or for infant industries, but long-term reliance is likely harmful to the overall economy and welfare. Careful targeting and complementary policies (e.g., subsidies for R&D, export promotion) are necessary to maximise net benefits.
Application (AO2 examples)
US steel tariffs (2018) — domestic producer and worker protection
India electronics tariffs — consumer price increases
US-China trade war (2018–2019) — retaliation and impact on consumers/producers
EU tariffs on Chinese solar panels — foreign producer impact
To what extent does protectionism hinder global economic growth?
Introduction
Protectionism refers to government measures designed to restrict imports and shield domestic industries, such as tariffs, import quotas, and subsidies. Protectionism can influence global economic growth by affecting trade flows, investment, and efficiency. While intended to protect domestic economies, it may reduce efficiency, increase prices, and provoke retaliatory measures, potentially slowing global growth. However, under certain circumstances, protectionism may support infant industries or strategic sectors, which could have long-term growth benefits. This essay will analyse the economic effects of protectionism and assess the extent to which it hinders global growth.
(AO1 = definition, AO2 = context, AO3 = outline of evaluation)
Paragraph 1 — How protectionism can hinder global economic growth
1st Chain of reasoning (loss of efficiency and comparative advantage):
Protectionism prevents countries from specialising according to comparative advantage, leading to allocative inefficiency.
Resources are used in less productive industries, reducing total global output.
Example: Tariffs on steel and aluminium by the US (2018) encouraged domestic production at higher costs than imports, reducing global efficiency.
2nd Chain of reasoning (higher prices, reduced consumption, and trade volume):
Import restrictions raise the price of goods, reducing consumption and trade volumes.
Lower global demand reduces investment and cross-border supply chain activity, slowing growth.
Example: US-China trade war (2018–2019) led to reduced global trade flows, affecting growth in both economies and their trading partners.
Diagram:
→ Tariff diagram / PPF: protection shifts domestic supply → higher domestic price, lower imported quantity → deadweight loss, illustrating inefficiency.
Evaluation:
The negative impact is greater when large economies impose protection, as they affect global trade networks and smaller trading partners.
Some small, targeted tariffs may have minimal impact on global growth.
Paragraph 2 — How protectionism can have positive effects on growth (conditional)
1st Chain of reasoning (infant industry protection):
Protection can allow emerging sectors to develop, eventually becoming globally competitive.
Example: South Korea protected steel and automotive industries in the 1960s–1980s, later exporting competitively.
Long-term growth benefits may eventually contribute to global trade and economic development.
2nd Chain of reasoning (strategic or national security sectors):
Protection may secure critical industries, supporting stability and preventing dependence on foreign suppliers.
Example: Some countries protect agriculture or defence sectors to ensure self-sufficiency, which may indirectly support economic stability and investment.
Evaluation:
These positive effects are conditional: protection must be temporary, targeted, and combined with investment and innovation policies.
If permanent, protection often reduces incentives for efficiency, limiting global growth.
Paragraph 3 — Wider consequences for stakeholders and global economy
Protectionism can provoke retaliation, leading to trade wars that reduce exports, employment, and investment globally.
Consumers worldwide face higher prices, lowering global consumption and demand.
Multinational firms may reduce cross-border production, slowing technology diffusion and productivity growth.
Evaluation:
Some argue protection can temporarily shield vulnerable economies, but in the long term, widespread protectionism reduces the efficiency of the global system and slows growth.
Judgement / Conclusion
In conclusion, protectionism generally hinders global economic growth by reducing efficiency, raising prices, lowering trade volumes, and creating uncertainty that deters investment. However, under certain conditional circumstances—such as protecting infant industries or strategic sectors—temporary protection may support long-term economic development and, indirectly, global growth. Overall, while protectionism can have short-term domestic benefits, its widespread and prolonged application tends to slow global economic growth, making it a force that primarily hinders the global economy.
Application (AO2 examples)
US steel and aluminium tariffs (2018) — efficiency loss and higher prices
US-China trade war (2018–2019) — reduced trade volumes, slowing global growth
South Korea 1960s–1980s — infant industry protection leading to later export growth
Agriculture or defence protection — strategic sector stability
Evaluate the impact of trade blocs on member and non-member countries.
Introduction
Trade blocs are agreements between countries to reduce or remove barriers to trade among members, such as tariffs and quotas. They aim to increase trade, investment, and economic growth for members. However, trade blocs can have mixed effects on non-member countries, who may face trade diversion or exclusion from benefits. This essay will analyse the economic impacts of trade blocs on both members and non-members, evaluating their short-term and long-term consequences.
(AO1 = definition, AO2 = context, AO3 = outline of assessment)
Paragraph 1 — Positive impacts on member countries
1st Chain of reasoning (increased trade and efficiency):
Members benefit from reduced tariffs and quotas, allowing goods and services to move freely.
This encourages specialisation according to comparative advantage, increasing efficiency and total output.
Example: EU single market allows member states to trade freely, increasing intra-EU trade and GDP growth.
2nd Chain of reasoning (economies of scale and investment):
Firms access larger markets, achieving economies of scale, lowering costs, and increasing competitiveness.
Trade blocs often attract foreign direct investment (FDI) due to stable, integrated markets.
Example: NAFTA attracted US and Japanese investment to Mexico’s manufacturing sector.
Diagram:
→ AD-AS diagram: trade bloc integration shifts AD out due to higher exports and investment → higher output and income.
Evaluation:
Gains may be uneven; larger or more developed members benefit more than smaller or poorer members.
Short-term adjustment costs may affect less competitive domestic industries.
Paragraph 2 — Negative impacts on member countries
1st Chain of reasoning (trade diversion and protection of inefficient industries):
Trade blocs may cause trade diversion, where members buy from less efficient member countries instead of more efficient non-members.
Domestic consumers may face higher prices than under global free trade.
2nd Chain of reasoning (dependency and policy constraints):
Member countries may become dependent on bloc partners, reducing flexibility in trade policy.
Common external tariffs may limit the ability to respond to global market shocks.
Example: Some EU countries face constraints on negotiating trade deals outside the bloc.
Evaluation:
While short-term inefficiencies exist, long-term gains from market integration, competition, and FDI often outweigh costs.
Paragraph 3 — Effects on non-member countries
1st Chain of reasoning (trade diversion and reduced market access):
Non-members may lose export markets or face higher external tariffs, reducing competitiveness.
Example: Non-EU countries exporting to the EU may pay higher tariffs compared to intra-EU trade.
2nd Chain of reasoning (potential incentives for non-members):
Some non-members may negotiate trade agreements with blocs or specialise in goods outside the bloc’s comparative advantage.
Example: Switzerland and Norway maintain agreements with the EU to access markets.
Evaluation:
Non-members may lose some short-term trade opportunities, but can still benefit indirectly if investment and growth in member countries create demand for imports.
Judgement / Conclusion
In conclusion, trade blocs generally benefit member countries through increased trade, efficiency, investment, and economic growth, but may involve short-term adjustment costs, trade diversion, and policy constraints. Non-member countries may face loss of market access and competitiveness, yet they can also gain indirectly through global supply chains and negotiated agreements. Overall, trade blocs tend to enhance welfare for members while creating mixed impacts for non-members, making them a conditional force for global economic integration.
Application (AO2 examples)
EU single market — free trade among members, investment inflows
NAFTA / USMCA — Mexico’s manufacturing sector growth, FDI
Non-EU countries (Norway, Switzerland) — access via agreements
Trade diversion examples — non-member exporters facing higher tariffs
EU external trade negotiations — constraints on individual member policy
Evaluate the effects of trade blocs on economic welfare.
Introduction
A trade bloc is an agreement between countries to reduce or remove trade barriers (tariffs, quotas) among members. Economic welfare refers to the overall well-being of an economy, usually measured by consumer and producer surplus, real income, and resource allocation efficiency. Trade blocs can increase welfare by promoting efficiency and trade, but can also cause trade diversion, inequality, and inefficiency. This essay will analyse the effects of trade blocs on economic welfare, using diagrams, examples, and evaluation.
(AO1 = definition, AO2 = context, AO3 = outline of assessment)
Paragraph 1 — Positive effects on economic welfare
1st Chain of reasoning (increased trade and consumer surplus):
Removing tariffs and quotas allows free flow of goods and services, lowering prices for consumers.
Consumer surplus rises, increasing overall welfare.
Example: EU single market — consumers access cheaper, higher-quality products from member states.
2nd Chain of reasoning (producer gains and efficiency):
Firms can specialise according to comparative advantage and access larger markets, achieving economies of scale.
Producer surplus rises, contributing to higher national income and investment.
Example: NAFTA / USMCA — Mexican manufacturing firms gained from access to US and Canadian markets.
Diagram:
→ Tariff removal diagram: supply curve shifts, price falls, quantity rises → increase in consumer surplus and producer efficiency.
Evaluation:
Gains are often concentrated in certain sectors, while others may face competition and decline.
Short-term adjustment costs can reduce net welfare in the transition period.
Paragraph 2 — Negative effects and welfare losses
1st Chain of reasoning (trade diversion and inefficiency):
Trade blocs can cause trade diversion, where members import from less efficient member countries rather than cheaper non-members.
This leads to allocative inefficiency, reducing total global welfare.
Example: Non-EU exporters paying higher tariffs to access EU markets due to preferential internal tariffs.
2nd Chain of reasoning (government and external costs):
Governments may subsidise protected industries to maintain bloc integration, raising taxes or public debt, which can reduce welfare.
Retaliation from non-members may increase tariffs, raising import prices for consumers.
Example: EU agricultural subsidies (CAP) create inefficiencies and raise tax burden.
Diagram (optional):
→ Trade diversion diagram: shows welfare loss (deadweight loss) due to inefficiency from importing from a higher-cost member.
Evaluation:
Negative effects are more pronounced for smaller or less competitive members.
Some inefficiencies are temporary and can be offset by long-term dynamic gains.
Paragraph 3 — Dynamic and long-term effects
Trade blocs encourage foreign investment, technology transfer, and competition, which improve long-term productivity and welfare.
They can stimulate structural transformation, allowing economies to move up the value chain.
Example: South Korea and Taiwan — benefited indirectly from regional trade integration and investment.
Evaluation:
Dynamic gains are conditional on good infrastructure, institutions, and investment policies.
Short-term welfare losses can be mitigated with retraining programs and industrial policy.
Judgement / Conclusion
Trade blocs generally increase economic welfare by lowering prices, expanding markets, and improving efficiency. Consumers gain from lower prices and more choice, while producers benefit from economies of scale and investment. However, trade diversion, inefficiency in certain sectors, and government costs may reduce net welfare, particularly in the short term. Overall, the impact on welfare is positive but conditional, depending on the structure of the bloc, policy design, and the ability of member states to adapt to competition.
Application (AO2 examples)
EU single market — consumer and producer benefits, lower prices
NAFTA / USMCA — Mexican manufacturing sector, FDI inflows
Non-EU exporters — welfare loss due to trade diversion
EU CAP subsidies — inefficiency and welfare costs
South Korea and Taiwan — dynamic gains via regional integration
Examine whether the gains from trade are evenly distributed among countries.
Introduction
Gains from trade arise when countries specialise according to comparative advantage, producing goods more efficiently and trading to consume beyond their production possibility frontier (PPF). In theory, trade should increase overall global welfare, allowing countries to enjoy higher output, income, and consumption. However, the distribution of gains is uneven in practice, influenced by levels of development, export composition, bargaining power, and access to markets. This essay will analyse how trade benefits countries differently, using diagrams, examples, and evaluation.
(AO1 = definition, AO2 = context, AO3 = outline of assessment)
Paragraph 1 — Why trade can increase global welfare
1st Chain of reasoning (comparative advantage and efficiency):
Trade allows countries to specialise in goods with lower opportunity costs, increasing global output and efficiency.
Consumers gain access to cheaper and more diverse goods, improving welfare.
Example: Brazil (coffee) and the US (wheat) — both benefit from specialisation and trade.
2nd Chain of reasoning (economies of scale and investment):
Access to larger markets enables firms to expand production, achieve economies of scale, and attract FDI.
Higher productivity raises GDP and real incomes.
Example: East Asian economies integrated into global trade networks, growing rapidly.
Diagram:
→ PPF diagram: specialisation and trade allow consumption beyond PPF → global gain.
Evaluation:
Theoretically, all countries gain, but the size of the gain varies depending on terms of trade, export prices, and competitiveness.
Paragraph 2 — Factors causing uneven distribution of gains
1st Chain of reasoning (developed vs developing countries):
Developed countries often gain more because they export high-value manufactured goods, while developing countries may export low-value primary commodities.
Example: Sub-Saharan Africa exports raw materials with volatile prices, while developed countries export technology-intensive products.
2nd Chain of reasoning (terms of trade and market power):
Countries with strong bargaining power in international markets capture larger gains.
Developing countries may face deteriorating terms of trade, receiving less income for exports relative to the cost of imports.
Example: Oil-exporting countries like Nigeria are vulnerable to commodity price shocks.
Evaluation:
Gains are uneven because market structures, product quality, and global value chains favour wealthier, more industrialised nations.
Paragraph 3 — Policy, trade blocs, and dynamic gains
Trade blocs and free trade agreements can enhance gains for some countries, but may exclude or disadvantage others.
Countries that invest in infrastructure, education, and industrial policy are better able to exploit trade opportunities.
Example: South Korea and Taiwan used strategic trade policies to gain disproportionately from global trade.
Evaluation:
Even if trade theoretically benefits all, government policy, institutional quality, and access to technology determine who benefits most.
Non-member or poorly governed countries may lag behind, widening global inequality.
Judgement / Conclusion
In conclusion, while trade increases overall global welfare, the gains are unevenly distributed among countries. Developed, industrialised nations with diversified exports and strong bargaining power often gain disproportionately, while developing countries reliant on primary commodities or excluded from trade blocs gain less and are more vulnerable to price volatility. Policy interventions, investment in infrastructure, and participation in global value chains can mitigate disparities, but inherent structural inequalities mean gains are rarely evenly distributed.
Application (AO2 examples)
Brazil and US — comparative advantage in coffee and wheat
East Asian economies — industrialisation and dynamic gains from trade
Sub-Saharan Africa — primary commodity dependency and volatile TOT
Nigeria oil exports — terms of trade vulnerability
South Korea / Taiwan — policy-driven exploitation of trade
Analyse the causes of a persistent current account deficit.
Introduction
A current account deficit (CAD) occurs when a country’s imports of goods, services, and income payments exceed exports over a period of time. A persistent CAD exists when this imbalance continues for years, reflecting structural or cyclical weaknesses in the economy. Persistent CADs can result from low competitiveness, high domestic demand, exchange rate factors, or macroeconomic policies. This essay will analyse the causes of a persistent CAD, using diagrams, examples, and evaluation of relative importance.
(AO1 = definition, AO2 = context, AO3 = outline of analytical framework)
Paragraph 1 — Structural causes
1st Chain of reasoning (low international competitiveness):
If domestic firms are less productive or higher-cost than foreign competitors, exports remain weak while imports are strong.
This causes structural trade deficits, contributing to a persistent CAD.
Example: The UK has historically experienced CAD due to low manufacturing exports and reliance on services, while importing manufactured goods.
2nd Chain of reasoning (export and import composition):
Economies dependent on primary commodities may have volatile TOT, reducing export revenue.
Countries importing capital-intensive goods may consistently spend more abroad than they earn from exports.
Example: Sub-Saharan African economies often run CADs due to reliance on commodity exports and import of manufactured goods.
Diagram:
→ Balance of payments / supply-demand for foreign currency: persistent excess of imports over exports → downward pressure on currency.
Evaluation:
Structural factors are difficult to address quickly; competitiveness improvements require investment in education, technology, and infrastructure.
Some CADs are sustainable if financed by capital inflows.
Paragraph 2 — Cyclical and macroeconomic causes
1st Chain of reasoning (high domestic demand and consumption):
Strong economic growth can increase import demand, especially for consumer goods and energy, worsening the CAD.
Example: During the UK 2000s growth period, higher consumption led to rising CAD.
2nd Chain of reasoning (exchange rate and inflation):
A strong domestic currency makes imports cheaper and exports less competitive, increasing the CAD.
Conversely, domestic inflation above global levels raises production costs, reducing export competitiveness.
Example: The US dollar appreciation in the 2010s contributed to a CAD by making imports cheaper and exports less competitive.
Diagram:
→ AD-AS or supply-demand for currency: appreciation → imports rise, exports fall → worsening CAD.
Evaluation:
Cyclical factors are short-term, unlike structural causes, and may self-correct with slower growth or depreciation.
Paragraph 3 — Policy and financial causes
1st Chain of reasoning (fiscal and monetary policy):
Expansionary policies (high government spending or low interest rates) can stimulate consumption and imports, worsening the CAD.
Example: UK government fiscal stimulus in early 2010s increased import demand.
2nd Chain of reasoning (capital inflows and borrowing):
A CAD may persist if a country can finance it through FDI, portfolio investment, or foreign borrowing, reducing pressure to correct the imbalance.
Example: US CAD persists partly due to strong capital inflows financing deficits.
Evaluation:
While capital inflows can sustain a CAD, reliance on foreign financing is risky, exposing the country to sudden stops or exchange rate crises.
Judgement / Conclusion
In conclusion, a persistent current account deficit arises from a combination of structural, cyclical, and policy factors. Structural issues such as low competitiveness and export composition are key long-term causes, while cyclical factors like high domestic demand and exchange rate movements exacerbate deficits temporarily. Policy choices and reliance on capital inflows also contribute. The overall persistence of a CAD depends on the interaction of these factors and the country’s ability to attract foreign financing, making some deficits sustainable while others pose economic risks.
Application (AO2 examples)
UK — long-term CAD due to manufacturing decline, strong domestic consumption, and financial sector dominance
US — CAD financed by foreign investment and capital inflows
Sub-Saharan Africa — commodity dependence and imports of manufactured goods
Currency effects — USD appreciation, UK pound fluctuations
Evaluate the likely effects of a current account deficit on the domestic economy.
Introduction
A current account deficit (CAD) occurs when a country’s imports of goods, services, and income payments exceed exports over a period of time. Persistent CADs can affect the domestic economy by influencing economic growth, exchange rates, inflation, and employment. While a CAD can be financed through foreign investment or borrowing, it can also indicate underlying structural weaknesses. This essay will evaluate the likely effects of a CAD on the domestic economy, considering both positive and negative impacts.
(AO1 = definition, AO2 = context, AO3 = outline of evaluation)
Paragraph 1 — Negative effects on domestic economy
1st Chain of reasoning (exchange rate depreciation and inflation):
A CAD can create downward pressure on the domestic currency, as more foreign currency is demanded for imports than supplied by exports.
Depreciation raises import prices, increasing cost-push inflation and reducing real incomes.
Example: UK CAD pressures in the 2000s contributed to a weaker pound and higher import costs.
2nd Chain of reasoning (financing risks and debt sustainability):
If a CAD is financed through borrowing, it increases external debt, creating future repayment obligations.
Rising interest payments may crowd out domestic investment and reduce public sector spending.
Example: US CAD is largely financed through portfolio investment, exposing the economy to sudden stops if capital inflows decline.
Diagram:
→ Balance of payments diagram / currency market: excess supply of domestic currency → depreciation → higher import prices → inflation.
Evaluation:
The negative effects are more severe if the CAD is structural, not financed by long-term FDI, and if the country cannot attract foreign capital.
Paragraph 2 — Effects on growth and employment
1st Chain of reasoning (reduced domestic production in tradable sector):
Persistent CADs can indicate weak export performance, limiting growth in tradable sectors.
This may lead to job losses in manufacturing or export-oriented industries, reducing domestic income.
Example: Decline in UK manufacturing trade contributed to regional unemployment.
2nd Chain of reasoning (impact on aggregate demand):
A CAD represents net leakage from the circular flow, reducing AD.
Lower AD can slow economic growth unless offset by capital inflows or domestic consumption.
Evaluation:
Short-term effects may be manageable if consumption and investment remain strong, but long-term imbalances can weaken economic resilience.
Paragraph 3 — Potential positive or neutral effects
1st Chain of reasoning (financing through investment):
CADs can be financed by foreign direct investment (FDI) or portfolio inflows, which may increase capital formation and productivity domestically.
Example: US CAD is partly financed by foreign investment in Treasury bonds and equities, supporting domestic AD and growth.
2nd Chain of reasoning (consumption and living standards):
A CAD allows a country to consume more than it produces, temporarily increasing living standards.
Example: UK consumers imported goods from Asia at lower prices, raising real income despite CAD.
Evaluation:
While beneficial short-term, reliance on external finance may create vulnerability to capital flow reversals, potentially triggering a balance of payments crisis.
Judgement / Conclusion
In conclusion, the effects of a CAD on the domestic economy are mixed. Negative impacts include currency depreciation, inflation, reduced domestic production, and external debt risks, particularly if the deficit is structural. Positive effects arise if the CAD is financed by stable FDI or investment, allowing higher consumption and capital formation. Overall, the likelihood of harm depends on the size, persistence, and financing of the CAD, with structural or unfinanced deficits being more damaging, while well-financed, temporary CADs may have minimal adverse effects.
Application (AO2 examples)
UK CAD in 2000s — weaker pound, higher import prices, regional unemployment
US CAD — financed by foreign investment, minimal short-term disruption
Asian economies (e.g., India) — CADs financed by capital inflows supporting investment
Evaluate the impact of exchange rate volatility on international trade and investment.
Introduction
Exchange rate volatility occurs when the value of a country’s currency fluctuates unpredictably against foreign currencies. Volatility can influence international trade and foreign investment by creating uncertainty over the cost of imports, exports, and returns on investment. While stable exchange rates encourage trade and FDI, volatility may discourage trade, disrupt contracts, and increase risk premiums, but it can also create opportunities for speculation and hedging. This essay will evaluate the impact of exchange rate volatility, using diagrams, examples, and economic theory.
(AO1 = definition, AO2 = context, AO3 = outline of evaluation)
Paragraph 1 — Negative impacts on trade
1st Chain of reasoning (importers and exporters face uncertainty):
Volatile exchange rates make it difficult for firms to predict costs and revenues, discouraging trade.
Exporters may face lower profit margins if the domestic currency appreciates unexpectedly; importers may pay more if the currency depreciates.
Example: UK exporters post-Brexit (2016) faced uncertainty over the pound, slowing export growth.
2nd Chain of reasoning (price risk and contracts):
Volatility increases transaction costs, as firms may need to hedge using financial instruments.
Small and medium enterprises (SMEs) often cannot afford hedging, reducing trade volume.
Diagram: Supply and demand for exports/imports: uncertainty shifts supply curve inward → lower quantity traded → reduced trade volume.
Evaluation:
While large firms can hedge risk, SMEs and developing countries are disproportionately affected.
Paragraph 2 — Negative impacts on investment
1st Chain of reasoning (foreign direct investment uncertainty):
Volatility increases uncertainty over returns in foreign currency, reducing FDI inflows.
Investors demand higher risk premiums, raising the cost of capital.
Example: Emerging markets often see lower FDI during periods of currency volatility, e.g., Argentina during peso instability.
2nd Chain of reasoning (portfolio investment and financial flows):
Short-term investors may withdraw funds during volatility, creating capital flight and further destabilising the currency.
Example: Turkey and South Africa experienced capital outflows during periods of exchange rate volatility.
Evaluation:
Long-term investors may see volatility as manageable risk, particularly if returns are high, so impact varies with investor type.
Paragraph 3 — Potential benefits or mitigated effects
1st Chain of reasoning (hedging and speculative opportunities):
Exchange rate volatility allows firms to hedge or speculate, potentially profiting from currency movements.
Example: Multinational corporations often use forward contracts and options to mitigate risks.
2nd Chain of reasoning (currency depreciation can stimulate exports):
Depreciation phases within volatility can make exports cheaper temporarily, boosting trade.
Example: UK exports sometimes benefit from a weaker pound during volatile periods.
Evaluation:
Benefits are uncertain and unevenly distributed, often favouring large firms and financial institutions.
Judgement / Conclusion
In conclusion, exchange rate volatility generally discourages international trade and investment by creating uncertainty over costs, revenues, and returns, raising transaction costs, and deterring FDI. However, effects are conditional: large multinational firms can hedge risks, some countries may benefit from temporary depreciation, and volatility allows speculative opportunities. Overall, volatility is more likely to have negative impacts on small firms, developing economies, and long-term investment, while effects on large, diversified corporations are mitigated through hedging strategies.
Application (AO2 examples)
UK exporters post-Brexit (2016) — export uncertainty due to pound volatility
Argentina peso instability — reduced FDI inflows
Turkey and South Africa — capital flight during volatility
Multinational firms hedging — forwards and options reduce trade and investment risks
UK exports — occasional benefits from depreciation episodes
Evaluate whether a depreciation of the exchange rate will always improve the current account balance.
Introduction
A depreciation of the exchange rate occurs when the value of a country’s currency falls relative to foreign currencies. In theory, a depreciation should improve the current account balance (CAD) by making exports cheaper and imports more expensive, stimulating demand for domestic goods. However, the actual effect depends on price elasticity of demand for exports and imports, the structure of trade, and time lags. This essay will evaluate whether depreciation always improves the current account, considering diagrams, examples, and economic theory.
(AO1 = definition, AO2 = context, AO3 = outline of evaluation)
Paragraph 1 — How depreciation can improve the current account
1st Chain of reasoning (price effect on exports and imports):
Depreciation lowers the foreign currency price of exports, increasing foreign demand.
Imports become more expensive in domestic currency, reducing import demand.
Result: improvement in the trade balance, a major component of the current account.
Example: UK pound depreciation post-Brexit (2016) boosted demand for UK exports temporarily.
2nd Chain of reasoning (Marshall-Lerner condition):
For a depreciation to improve the CA, the sum of the absolute price elasticities of exports and imports must exceed 1.
If elasticities are sufficiently high, quantity changes outweigh price changes, improving CA.
Diagram:
→ J-curve effect: initial deterioration due to higher import costs → long-term improvement as quantities adjust.
Evaluation:
Positive effect depends on elasticities, trade composition, and time for contracts and production to adjust.
Paragraph 2 — Why depreciation may not improve the current account
1st Chain of reasoning (inelastic demand for exports/imports):
If demand for exports and imports is inelastic, a depreciation may not significantly increase export volumes or reduce imports.
Short-term effect: CA may worsen, as import prices rise faster than export revenues.
Example: UK energy imports are price inelastic → higher import costs after pound depreciation.
2nd Chain of reasoning (J-curve effect / time lag):
Immediately after depreciation, the CA may deteriorate because import costs rise before export volumes respond.
Example: J-curve observed in Japan in the 1990s, where depreciation initially worsened the CA.
Evaluation:
Initial CA deterioration means depreciation does not always improve the current account in the short term, particularly for countries reliant on inelastic imports or global supply chains.
Paragraph 3 — Other factors influencing effectiveness
Inflation and competitiveness: Depreciation can lead to higher domestic prices for imported raw materials → cost-push inflation → eroded competitiveness.
Structural issues: Countries with high import dependence or primary commodity exports may not see CA improvement.
Global economic conditions: Weak foreign demand limits export growth even if prices fall.
Evaluation:
Depreciation is not a guaranteed solution. Its success depends on elasticities, trade composition, time lags, inflation, and global demand.
Judgement / Conclusion
In conclusion, a depreciation of the exchange rate does not always improve the current account balance. While it can theoretically increase exports and reduce imports, the short-term effect may be negative due to the J-curve, inelastic demand, or import dependence. Over the medium to long term, if the Marshall-Lerner condition holds and domestic firms can respond, the CA may improve. Therefore, the effect is conditional, not automatic, and must be considered alongside structural factors and global economic conditions.
Application (AO2 examples)
UK pound post-Brexit (2016) — temporary boost in exports, higher import costs
Japan in the 1990s — J-curve effect, initial CA deterioration
Emerging markets — energy-importing countries often see worsened CA after depreciation
Oil-exporting countries — CA response depends on export commodity prices
Discuss the policies a government could use to reduce a current account deficit.
Introduction
A current account deficit (CAD) occurs when a country’s imports of goods, services, and income payments exceed exports. Persistent CADs may indicate underlying economic imbalances and can lead to exchange rate depreciation or debt accumulation. Governments can use policy measures to reduce a CAD, either by reducing imports, increasing exports, or improving competitiveness. This essay will discuss monetary, fiscal, exchange rate, and supply-side policies, evaluating their likely effectiveness.
(AO1 = definition, AO2 = context, AO3 = outline of evaluation)
Paragraph 1 — Expenditure-switching policies
1st Chain of reasoning (depreciation / devaluation):
A depreciation of the currency makes exports cheaper and imports more expensive.
This should increase export demand and reduce import demand, improving the trade balance.
Example: UK pound depreciation post-Brexit (2016) temporarily boosted exports.
2nd Chain of reasoning (tariffs and import restrictions):
Governments can impose tariffs, quotas, or import bans to reduce import expenditure.
Example: US steel tariffs (2018) aimed to protect domestic production and reduce imports.
Diagram:
→ AD-AS or supply-demand for foreign currency: depreciation increases export demand and reduces import demand → CA improvement.
Evaluation:
Exchange rate policy is more effective in countries with elastic demand for exports and imports (Marshall-Lerner condition).
Tariffs can provoke retaliation, reduce international competitiveness, and violate WTO rules.
Paragraph 2 — Expenditure-reducing policies
1st Chain of reasoning (contractionary fiscal policy):
Reducing government spending or increasing taxes lowers domestic consumption, particularly of imports, improving the CAD.
2nd Chain of reasoning (monetary policy):
Higher interest rates reduce domestic demand and inflation, making imports less attractive.
Example: Tight monetary policy in Brazil helped reduce import-driven CAD in certain periods.
Evaluation:
Reduces overall AD and economic growth, may increase unemployment.
Politically unpopular and may slow domestic economy more than it corrects CA.
Paragraph 3 — Supply-side policies
1st Chain of reasoning (improving competitiveness):
Policies to increase productivity and reduce costs make exports more competitive.
Examples: investment in infrastructure, technology, and education improves export performance.
Example: South Korea invested in industrial policy to grow export industries.
2nd Chain of reasoning (diversifying exports and reducing import dependency):
Encouraging innovation and domestic production reduces reliance on imports.
Example: Germany’s focus on advanced manufacturing reduces import dependency.
Evaluation:
Long-term benefits, but slow to implement. Immediate effects on the CAD are limited.
Paragraph 4 — Other policies and considerations
Trade agreements / export promotion: Bilateral deals can increase market access for exports.
Currency intervention: Central banks can smooth excessive volatility, indirectly supporting exports.
Policies must be coordinated to avoid inflation, trade wars, or capital flight.
Judgement / Conclusion
In conclusion, governments have multiple options to reduce a current account deficit. Expenditure-switching policies (depreciation, tariffs) can have a direct effect but may cause retaliation or inflation. Expenditure-reducing policies reduce imports but slow growth. Supply-side policies improve competitiveness and have long-term benefits, though they take time to work. The most effective approach is usually a combination of policies, targeting both short-term correction and long-term structural improvements.
Application (AO2 examples)
UK pound depreciation post-Brexit (2016) — increased exports, higher import costs
US steel tariffs (2018) — limited CA improvement, risk of retaliation
Brazil fiscal tightening — reduced import-driven CAD
South Korea industrial policy — long-term export growth
Discuss the advantages and disadvantages of fixed versus floating exchange rates.
Introduction
An exchange rate is the price of a country’s currency in terms of another. A fixed exchange rate is pegged to another currency or a basket of currencies, while a floating exchange rate is determined by market forces of supply and demand. Each system has benefits and drawbacks for macroeconomic stability, trade, and investment. This essay will discuss the advantages and disadvantages of fixed versus floating exchange rates, using diagrams, examples, and evaluation.
(AO1 = definitions, AO2 = context, AO3 = outline of analysis)
Paragraph 1 — Advantages of fixed exchange rates
1st Chain of reasoning (stability for trade and investment):
Fixed rates reduce exchange rate uncertainty, encouraging international trade and FDI.
Firms can plan costs and revenues with certainty.
Example: Hong Kong dollar pegged to the US dollar — stable environment for trade and investment.
2nd Chain of reasoning (inflation control):
Pegging to a low-inflation currency can help maintain domestic price stability.
Example: Argentina’s peso-dollar peg (1991–2002) initially reduced hyperinflation.
Diagram:
→ Fixed exchange rate diagram: central bank intervention keeps exchange rate constant despite demand/supply shifts.
Evaluation:
Maintaining a fixed rate requires large foreign reserves and can lead to speculative attacks if the peg is unsustainable.
Paragraph 2 — Disadvantages of fixed exchange rates
1st Chain of reasoning (loss of monetary policy independence):
Central banks must align interest rates with the anchor currency, limiting domestic macroeconomic control.
Example: Countries in the Eurozone cannot set individual interest rates, affecting local economies.
2nd Chain of reasoning (vulnerability to crises):
Pegs can break under speculative attacks if markets perceive overvaluation.
Example: UK Black Wednesday (1992) — forced exit from ERM due to unsustainable fixed rate.
Evaluation:
Fixed rates can stabilize inflation and trade but are risky if economic fundamentals diverge from the anchor currency.
Paragraph 3 — Advantages of floating exchange rates
1st Chain of reasoning (automatic adjustment of balance of payments):
Floating rates adjust to supply and demand, correcting trade imbalances automatically.
Example: US dollar and Japanese yen — depreciation boosts exports and improves current account.
2nd Chain of reasoning (monetary policy independence):
Governments can set interest rates and control inflation without worrying about maintaining a peg.
Example: New Zealand uses floating rate to pursue independent monetary policy.
Diagram:
→ Floating exchange rate: equilibrium set by supply and demand, automatic adjustment to shocks.
Evaluation:
Floating rates can be volatile, creating uncertainty for trade and investment.
Small or open economies may face excessive fluctuations.
Paragraph 4 — Disadvantages of floating exchange rates
1st Chain of reasoning (exchange rate volatility):
Uncertainty increases transaction and hedging costs, reducing trade and FDI.
Example: Emerging markets like Turkey face high volatility, deterring investment.
2nd Chain of reasoning (inflation and speculation):
Currency depreciation can import inflation via higher import prices.
Floating rates are vulnerable to speculative attacks, amplifying volatility.
Evaluation:
Volatility can be mitigated by hedging instruments and central bank interventions, but some risk remains.
Judgement / Conclusion
In conclusion, fixed exchange rates provide stability, predictability, and inflation control, but limit monetary policy and risk crises if misaligned. Floating exchange rates offer automatic balance of payments adjustment and policy independence, but increase volatility and uncertainty, especially for small or open economies. The choice depends on country size, openness, financial markets, and institutional capacity. Large, developed economies may tolerate floating rates, while small, trade-dependent nations may prefer a fixed or managed peg for stability.
Application (AO2 examples)
Hong Kong — fixed peg to US dollar, trade stability
Argentina (1991–2002) — peso-dollar peg, initial inflation control but collapse
UK Black Wednesday (1992) — fixed rate vulnerability
New Zealand — floating rate, independent monetary policy
Turkey — floating rate volatility affecting investment
Introduction
Exchange rate stability occurs when the value of a country’s currency remains relatively constant against other currencies. Macroeconomic stability refers to low and predictable inflation, sustainable growth, low unemployment, and a stable balance of payments. Stable exchange rates can influence macroeconomic outcomes by reducing uncertainty for trade and investment, controlling inflation, and supporting policy credibility. However, stability may require sacrifices in monetary or fiscal policy flexibility, and does not guarantee full macroeconomic stability. This essay will evaluate the extent to which exchange rate stability promotes macroeconomic stability, using diagrams and examples.
(AO1 = definitions, AO2 = context, AO3 = outline of evaluation)
Paragraph 1 — Positive effects on inflation and trade
1st Chain of reasoning (import price stability and inflation control):
Stable exchange rates prevent large fluctuations in import prices, reducing imported inflation.
This contributes to overall price stability and predictable inflation expectations.
Example: Hong Kong dollar peg to US dollar helps maintain low inflation.
2nd Chain of reasoning (trade stability and investment confidence):
Predictable exchange rates reduce risk in international trade and investment, encouraging long-term contracts and FDI.
This supports economic growth and employment, contributing to macroeconomic stability.
Example: EU countries pre-Euro adoption stabilized trade with fixed exchange rates.
Diagram:
→ Fixed exchange rate diagram: central bank interventions keep rate stable → low import price volatility → stable AD.
Evaluation:
Benefits are more significant for small, open economies with high trade exposure.
Paragraph 2 — Potential costs and limitations
1st Chain of reasoning (loss of monetary policy independence):
To maintain a fixed exchange rate, central banks must adjust interest rates to defend the peg, even if domestic conditions differ.
Example: UK in ERM (1990–1992) — high interest rates to defend peg worsened domestic recession.
2nd Chain of reasoning (vulnerability to speculative attacks):
Fixed or stable rates can attract speculative capital flows, leading to crises if fundamentals are misaligned.
Example: Asian financial crisis (1997) — fixed pegs became unsustainable, causing macroeconomic instability.
Evaluation:
Stability does not guarantee stability in output or employment, particularly if the peg is inconsistent with economic fundamentals.
Paragraph 3 — Alternative mechanisms and partial stability
1st Chain of reasoning (managed or adjustable pegs):
Managed exchange rates allow partial stability while retaining some policy flexibility, reducing risk of macroeconomic shocks.
Example: China’s managed float maintains competitiveness and controls volatility.
2nd Chain of reasoning (floating rates and macroeconomic policy):
Floating rates provide automatic adjustment of the balance of payments and allow independent monetary policy.
Stability is not always necessary for macroeconomic stability; strong institutions, fiscal discipline, and inflation targeting can also promote stability.
Example: New Zealand floating rate with inflation targeting — macro stability achieved without a fixed exchange rate.
Evaluation:
Exchange rate stability is beneficial but not sufficient; structural factors and domestic policies are also critical.
Judgement / Conclusion
In conclusion, exchange rate stability can promote macroeconomic stability by controlling inflation, reducing uncertainty for trade and investment, and supporting predictable economic conditions. However, it may limit monetary policy flexibility, increase vulnerability to speculative attacks, and cannot guarantee stable growth or employment on its own. The extent of the benefit depends on economic structure, openness, and policy framework. For small, open economies, stability is more important, whereas large, diversified economies can maintain macroeconomic stability even with floating rates. Overall, exchange rate stability contributes to but does not ensure macroeconomic stability.
Application (AO2 examples)
Hong Kong — peg to US dollar, low inflation and trade stability
UK ERM (1990–1992) — interest rate adjustments worsened recession
Asian financial crisis (1997) — fixed pegs collapsed, causing instability
China managed float — partial stability supports trade competitiveness
New Zealand floating rate — inflation targeting achieves stability without fixed rate
Assess whether a current account surplus is always desirable.
Introduction
A current account surplus (CAS) occurs when a country’s exports of goods, services, and income receipts exceed imports over a period of time. While a surplus indicates a net inflow of foreign currency and can signal competitiveness, it is not always unambiguously beneficial. The effects depend on whether the surplus is cyclical or structural, how it impacts domestic growth, inflation, and global relations, and how it is financed or invested. This essay will assess the desirability of a CAS, using diagrams, examples, and evaluation.
(AO1 = definitions, AO2 = context, AO3 = outline of evaluation)
Paragraph 1 — Advantages of a current account surplus
1st Chain of reasoning (economic strength and competitiveness):
A CAS indicates strong export performance and competitiveness of domestic firms, which can support GDP growth and employment.
Example: Germany maintains a persistent surplus through high-value manufactured exports.
2nd Chain of reasoning (foreign currency accumulation and financial stability):
Surpluses generate foreign reserves, improving a country’s ability to finance imports, repay debt, or intervene in currency markets.
Example: China used its CAS to accumulate large foreign reserves, maintaining currency stability and financing infrastructure.
Diagram:
→ Balance of payments diagram: CAS → net inflow of foreign currency → increased reserves → financial security.
Evaluation:
Surplus countries may gain economic power and stability, particularly in international markets.
Paragraph 2 — Disadvantages and potential risks
1st Chain of reasoning (reduced domestic consumption and investment):
CAS often results from low domestic consumption or weak imports, which may indicate underlying economic weakness or excessive saving.
Example: Germany’s high saving and export focus has been criticized for limiting domestic demand in Europe.
2nd Chain of reasoning (global imbalances and political tension):
Persistent surpluses can create trade imbalances, leading to global tensions and retaliation, especially if deficit countries face slow growth.
Example: US criticism of China and Germany over large surpluses.
Evaluation:
While a surplus may appear strong, it may mask structural issues, such as under-consumption, reliance on exports, or external imbalances.
Paragraph 3 — Contextual and policy considerations
1st Chain of reasoning (cyclical vs structural surplus):
A temporary, cyclical surplus during a recovery phase may be desirable, reflecting improved export competitiveness.
Structural surpluses, however, may indicate persistent domestic under-consumption and dependence on foreign demand.
2nd Chain of reasoning (exchange rate effects and inflation):
Large surpluses can appreciate the domestic currency, making exports more expensive in future periods and potentially reducing growth.
Example: Japan’s surplus in 1980s contributed to yen appreciation, affecting long-term export competitiveness.
Evaluation:
Desirability depends on domestic economic context, sustainability of surplus, and policy responses.
Judgement / Conclusion
In conclusion, a current account surplus is not always desirable. It can indicate economic strength, competitiveness, and financial security, but may also reflect weak domestic consumption, reliance on foreign demand, or global imbalances. The impact depends on whether the surplus is structural or cyclical, how it affects the domestic economy, and international relations. Balanced trade, with moderate surpluses or deficits and sustainable domestic demand, is generally more desirable than a persistent, unbalanced surplus.
Application (AO2 examples)
Germany — persistent surplus, strong exports, criticized for low domestic consumption
China — large surplus, foreign reserves, global trade tensions
Japan 1980s — surplus led to yen appreciation and long-term competitiveness issues
US — contrasts: deficit country criticizing surplus countries
Evaluate the extent to which exchange rate stability promotes macroeconomic stability.
Introduction
An exchange rate is the price of a country’s currency in terms of another. A fixed exchange rate is pegged to another currency or a basket of currencies, while a floating exchange rate is determined by market forces of supply and demand. Each system has benefits and drawbacks for macroeconomic stability, trade, and investment. This essay will discuss the advantages and disadvantages of fixed versus floating exchange rates, using diagrams, examples, and evaluation.
(AO1 = definitions, AO2 = context, AO3 = outline of analysis)
Paragraph 1 — Advantages of fixed exchange rates
1st Chain of reasoning (stability for trade and investment):
Fixed rates reduce exchange rate uncertainty, encouraging international trade and FDI.
Firms can plan costs and revenues with certainty.
Example: Hong Kong dollar pegged to the US dollar — stable environment for trade and investment.
2nd Chain of reasoning (inflation control):
Pegging to a low-inflation currency can help maintain domestic price stability.
Example: Argentina’s peso-dollar peg (1991–2002) initially reduced hyperinflation.
Diagram:
→ Fixed exchange rate diagram: central bank intervention keeps exchange rate constant despite demand/supply shifts.
Evaluation:
Maintaining a fixed rate requires large foreign reserves and can lead to speculative attacks if the peg is unsustainable.
Paragraph 2 — Disadvantages of fixed exchange rates
1st Chain of reasoning (loss of monetary policy independence):
Central banks must align interest rates with the anchor currency, limiting domestic macroeconomic control.
Example: Countries in the Eurozone cannot set individual interest rates, affecting local economies.
2nd Chain of reasoning (vulnerability to crises):
Pegs can break under speculative attacks if markets perceive overvaluation.
Example: UK Black Wednesday (1992) — forced exit from ERM due to unsustainable fixed rate.
Evaluation:
Fixed rates can stabilize inflation and trade but are risky if economic fundamentals diverge from the anchor currency.
Paragraph 3 — Advantages of floating exchange rates
1st Chain of reasoning (automatic adjustment of balance of payments):
Floating rates adjust to supply and demand, correcting trade imbalances automatically.
Example: US dollar and Japanese yen — depreciation boosts exports and improves current account.
2nd Chain of reasoning (monetary policy independence):
Governments can set interest rates and control inflation without worrying about maintaining a peg.
Example: New Zealand uses floating rate to pursue independent monetary policy.
Diagram:
→ Floating exchange rate: equilibrium set by supply and demand, automatic adjustment to shocks.
Evaluation:
Floating rates can be volatile, creating uncertainty for trade and investment.
Small or open economies may face excessive fluctuations.
Paragraph 4 — Disadvantages of floating exchange rates
1st Chain of reasoning (exchange rate volatility):
Uncertainty increases transaction and hedging costs, reducing trade and FDI.
Example: Emerging markets like Turkey face high volatility, deterring investment.
2nd Chain of reasoning (inflation and speculation):
Currency depreciation can import inflation via higher import prices.
Floating rates are vulnerable to speculative attacks, amplifying volatility.
Evaluation:
Volatility can be mitigated by hedging instruments and central bank interventions, but some risk remains.
Judgement / Conclusion
In conclusion, fixed exchange rates provide stability, predictability, and inflation control, but limit monetary policy and risk crises if misaligned. Floating exchange rates offer automatic balance of payments adjustment and policy independence, but increase volatility and uncertainty, especially for small or open economies. The choice depends on country size, openness, financial markets, and institutional capacity. Large, developed economies may tolerate floating rates, while small, trade-dependent nations may prefer a fixed or managed peg for stability.
Application (AO2 examples)
Hong Kong — fixed peg to US dollar, trade stability
Argentina (1991–2002) — peso-dollar peg, initial inflation control but collapse
UK Black Wednesday (1992) — fixed rate vulnerability
New Zealand — floating rate, independent monetary policy
Turkey — floating rate volatility affecting investment
Evaluate the effectiveness of the IMF and World Bank in promoting financial stability and supporting developing economies.
Introduction
The International Monetary Fund (IMF) and World Bank are two key global financial institutions aimed at supporting economic stability and development. The IMF primarily focuses on financial stability, balance of payments crises, and short-term macroeconomic support, while the World Bank provides long-term development finance, infrastructure investment, and poverty reduction programs. Their effectiveness is debated: while they have assisted many countries in crisis or development, criticisms include conditionality, debt sustainability issues, and limited impact on structural challenges. This essay will evaluate their effectiveness using examples, economic reasoning, and evaluation.
(AO1 = definitions, AO2 = context, AO3 = analytical framework)
Paragraph 1 — IMF effectiveness in promoting financial stability
1st Chain of reasoning (financial assistance and crisis resolution):
The IMF provides short-term loans to countries facing balance of payments problems, stabilizing currencies and restoring confidence.
Example: Greece (2010–2015) — IMF loans were part of the bailout to prevent sovereign default and stabilize financial markets.
2nd Chain of reasoning (policy advice and conditionality):
IMF programs include conditionality measures (fiscal austerity, monetary tightening, structural reforms) to promote macroeconomic stability and prevent recurrence.
Example: Argentina 2001–2002 — IMF-supported policies aimed to correct fiscal imbalances.
Diagram (optional):
→ AD-AS showing stabilization: IMF loan restores AD and prevents recession following financial shock.
Evaluation:
Conditionality can stabilize macroeconomy, but may cause social unrest or recession due to austerity.
Effectiveness is mixed: crisis resolved financially, but domestic growth may be hampered.
Paragraph 2 — IMF limitations and criticisms
1st Chain of reasoning (short-term focus and moral hazard):
IMF focuses on short-term balance of payments, not long-term development, leaving structural issues unresolved.
Example: Recurrent crises in Latin America suggest limited long-term effectiveness.
2nd Chain of reasoning (conditionality criticism):
Conditionality can reduce sovereignty, impose harsh austerity, and lead to political and social backlash.
Example: Greece protests 2010–2015 — social costs of IMF-imposed measures were severe.
Evaluation:
IMF stabilizes finance but may not promote sustainable economic growth; benefits are often temporary.
Paragraph 3 — World Bank effectiveness in supporting developing economies
1st Chain of reasoning (long-term development projects):
The World Bank provides loans and grants for infrastructure, education, and health, supporting human capital and growth.
Example: India World Bank projects — rural infrastructure and sanitation improvements boosting long-term productivity.
2nd Chain of reasoning (technical expertise and capacity building):
Offers policy advice, project management, and capacity building, helping governments implement effective development strategies.
Example: Sub-Saharan Africa development projects — improving governance and institutional capacity.
Evaluation:
Effective for long-term structural development, particularly when projects are well-targeted and monitored.
Paragraph 4 — World Bank limitations
1st Chain of reasoning (debt and dependency):
Loans increase debt burden, potentially limiting future fiscal space for development.
Example: Some African countries struggle with repaying World Bank loans, leading to dependence.
2nd Chain of reasoning (effectiveness and corruption):
Projects may fail due to poor governance, corruption, or mismanagement, reducing effectiveness.
Example: Some infrastructure projects in developing countries have underperformed or failed to deliver expected outcomes.
Evaluation:
World Bank is effective under good governance, but structural and institutional weaknesses can limit impact.
Judgement / Conclusion
In conclusion, the IMF and World Bank play crucial roles in promoting financial stability and supporting developing economies. The IMF is effective in short-term crisis stabilization, but conditionality and short-term focus may hinder growth. The World Bank supports long-term development through infrastructure, human capital, and capacity building, but effectiveness depends on governance, debt sustainability, and project implementation. Overall, both institutions are partially effective: they are essential tools for global financial stability and development, but their impact is conditional on domestic and global factors.
Application (AO2 examples)
IMF: Greece (2010–2015), Argentina (2001–2002), Latin American recurring crises
World Bank: India rural infrastructure, Sub-Saharan Africa capacity-building projects
Debt and social costs: Greek austerity, African debt sustainability issues
Evaluate the role of financial markets and FDI in promoting economic growth and development, and whether globalisation increases financial instability.
Introduction
Financial markets facilitate the allocation of capital, allowing savings to be channelled into productive investment, which can promote economic growth and development. Foreign Direct Investment (FDI) provides capital, technology transfer, managerial expertise, and access to global markets for developing economies. Globalisation, by integrating financial markets and increasing cross-border capital flows, can enhance growth but also increase financial volatility. This essay evaluates the role of financial markets and FDI in development, and examines whether globalisation increases financial instability.
(AO1 = definitions, AO2 = context, AO3 = outline of evaluation)
Paragraph 1 — Role of financial markets in growth and development
1st Chain of reasoning (mobilisation of savings and investment):
Well-functioning financial markets channel savings into productive investment, supporting capital accumulation and economic growth.
Example: US capital markets facilitate investment in technology and infrastructure, contributing to GDP growth.
2nd Chain of reasoning (risk management and efficient resource allocation):
Financial markets allow risk-sharing, price discovery, and allocation of funds to the most productive sectors.
Example: Stock exchanges enable companies to raise capital efficiently, supporting innovation.
Diagram (optional):
→ Financial markets channel savings → investment → AD and LRAS → economic growth.
Evaluation:
Effectiveness depends on regulation, transparency, and accessibility; poorly regulated markets can misallocate resources.
Paragraph 2 — Role of FDI in promoting growth and development
1st Chain of reasoning (capital, technology transfer, and employment):
FDI provides capital inflows, technology, and managerial expertise, increasing productivity and human capital.
Example: China and Vietnam — FDI in manufacturing boosted growth, exports, and employment.
2nd Chain of reasoning (access to global markets):
FDI allows developing countries to integrate into global value chains, improving export competitiveness.
Example: India’s IT sector growth driven by FDI in outsourcing and tech services.
Evaluation:
Benefits depend on host country policies, absorptive capacity, and local linkages; without these, FDI may generate limited development gains.
Paragraph 3 — Potential downsides and globalisation risks
1st Chain of reasoning (financial market volatility and crises):
Globalised financial markets can transmit shocks rapidly, increasing financial instability.
Example: Asian Financial Crisis (1997) — cross-border capital flows led to rapid currency and banking crises.
2nd Chain of reasoning (capital flight and short-term FDI):
Volatile short-term capital flows can destabilise exchange rates and undermine development.
Example: Emerging markets like Turkey and Argentina suffered from sudden withdrawal of capital inflows.
Evaluation:
While long-term FDI supports development, speculative flows associated with globalisation can increase instability.
Paragraph 4 — Mitigation and conditional benefits
1st Chain of reasoning (regulation and institutions):
Strong financial regulation, capital controls, and institutions reduce instability and maximise FDI benefits.
Example: Singapore maintains stable financial markets and attracts long-term FDI.
2nd Chain of reasoning (diversified growth strategies):
Combining domestic investment, FDI, and financial market development can reduce vulnerability to global shocks.
Example: China’s managed capital account ensures stability while encouraging FDI.
Evaluation:
Globalisation is not inherently destabilising; effects depend on policy frameworks, governance, and financial maturity.
Judgement / Conclusion
In conclusion, financial markets and FDI play a critical role in promoting economic growth and development by mobilising capital, transferring technology, and integrating economies into global markets. However, globalisation can increase financial instability, particularly through volatile short-term capital flows, speculative attacks, and weak institutions. The net effect depends on regulation, institutional capacity, and economic policy. When appropriately managed, financial markets and FDI can enhance development while minimising instability, but unmanaged globalisation carries significant risks for emerging and developing economies.
Application (AO2 examples)
China and Vietnam — FDI in manufacturing driving growth
India IT sector — FDI supporting human capital and global integration
Asian Financial Crisis (1997) — financial instability from global capital flows
Turkey and Argentina — sudden capital flight affecting growth
Singapore — strong regulation attracting stable FDI
China — managed capital account ensures stability
Assess the most effective ways to promote sustainable economic development and reduce global inequality.
Introduction
Sustainable economic development is economic growth that meets present needs without compromising the ability of future generations to meet their own needs. Global inequality refers to disparities in income, wealth, and standards of living between countries. Promoting development while reducing inequality requires a combination of domestic policies, international aid, trade, and institutional improvements. This essay will assess the most effective strategies, considering economic, social, and environmental dimensions, using examples, diagrams, and evaluation.
(AO1 = definitions, AO2 = context, AO3 = outline of analysis)
Paragraph 1 — Domestic policies and human capital development
1st Chain of reasoning (investment in education and healthcare):
Investing in human capital increases productivity, innovation, and employment, supporting sustainable development.
Example: South Korea and Singapore used education and skills development to transform into high-income economies.
2nd Chain of reasoning (infrastructure and technology):
Investment in transport, energy, and digital infrastructure promotes long-term productivity and access to markets, reducing regional inequality.
Example: China’s Belt and Road initiative invests in infrastructure in developing countries to boost growth.
Evaluation:
Effective in long-term development, but requires good governance, funding, and maintenance. Poor implementation may limit impact.
Paragraph 2 — Trade and economic liberalisation
1st Chain of reasoning (export-led growth):
Participation in global trade allows developing countries to access markets, technology, and foreign capital.
Example: Vietnam and Bangladesh have reduced poverty through export-oriented manufacturing.
2nd Chain of reasoning (FDI and capital flows):
Attracting FDI brings investment, skills, and technology, supporting development and reducing inequality.
Example: China and India’s IT and manufacturing sectors benefited from FDI inflows.
Diagram (optional):
→ AD/AS or growth model: trade expansion → higher output and employment → poverty reduction.
Evaluation:
Globalisation can increase inequality if benefits are unevenly distributed or domestic markets are uncompetitive. Complementary policies are needed.
Paragraph 3 — International aid and debt relief
1st Chain of reasoning (targeted aid for development):
Official development assistance (ODA) funds health, education, and infrastructure, promoting growth in low-income countries.
Example: Millennium Development Goals (MDGs) funded projects to reduce poverty and disease.
2nd Chain of reasoning (debt relief and financial support):
Reducing debt burdens allows countries to invest in development instead of interest payments.
Example: Heavily Indebted Poor Countries (HIPC) Initiative helped countries like Zambia free resources for social programs.
Evaluation:
Aid effectiveness depends on governance, targeting, and avoiding dependency. Poorly managed aid may have limited impact.
Paragraph 4 — Environmental sustainability and inclusive policies
1st Chain of reasoning (green growth and renewable energy):
Investing in sustainable energy and resource-efficient technologies ensures long-term development while protecting the environment.
Example: Costa Rica invests in renewable energy, promoting eco-tourism and sustainable growth.
2nd Chain of reasoning (inclusive institutions and policies):
Policies promoting land reform, fair taxation, and social protection reduce inequality while supporting economic development.
Example: Nordic countries achieve high standards of living and low inequality through progressive taxation and social policies.
Evaluation:
Sustainable development requires balancing economic, social, and environmental objectives; short-term growth may conflict with long-term goals.
Judgement / Conclusion
In conclusion, the most effective ways to promote sustainable economic development and reduce global inequality involve a multi-faceted approach:
Domestic investment in human capital and infrastructure for long-term productivity.
Trade liberalisation and FDI to integrate countries into global markets.
Targeted aid and debt relief to relieve financial constraints in developing countries.
Environmental sustainability and inclusive policies to ensure growth is equitable and long-lasting.
No single strategy is sufficient; policy complementarities, good governance, and international cooperation are essential for achieving sustainable, inclusive development and reducing inequality globally.
Application (AO2 examples)
South Korea and Singapore — education and human capital for development
Vietnam, Bangladesh — export-led growth reducing poverty
China Belt and Road — infrastructure supporting growth
HIPC Initiative (Zambia) — debt relief freeing resources for development
Costa Rica — renewable energy promoting sustainable growth
Nordic countries — inclusive institutions reducing inequality
Analyse the causes of financial crises and the constraints on economic development, and evaluate policies to address them.
Introduction
A financial crisis occurs when financial institutions or markets experience severe instability, often leading to sharp declines in asset prices, currency devaluations, or bank failures. Constraints on economic development include factors that limit growth and poverty reduction, such as poor infrastructure, low human capital, weak institutions, and debt. Financial crises can exacerbate these constraints by reducing investment, increasing unemployment, and undermining confidence. This essay analyses the causes of financial crises, identifies constraints on economic development, and evaluates policies to mitigate their effects, using examples, diagrams, and evaluation.
(AO1 = definitions, AO2 = context, AO3 = outline of evaluation)
Paragraph 1 — Causes of financial crises
1st Chain of reasoning (excessive credit and banking sector vulnerabilities):
Over-lending, low lending standards, and high leverage can create asset bubbles.
Example: Global Financial Crisis (2007–2008) — US subprime mortgage crisis caused bank failures worldwide.
2nd Chain of reasoning (macro-economic imbalances and currency crises):
Large current account deficits, unsustainable debt, and fixed exchange rates can trigger speculative attacks and currency crises.
Example: Asian Financial Crisis (1997) — fixed pegs and high short-term foreign debt led to currency collapses in Thailand, Indonesia, and South Korea.
Evaluation:
Crises often involve interactions between domestic vulnerabilities and global financial integration.
Paragraph 2 — Constraints on economic development
1st Chain of reasoning (low human capital and infrastructure):
Poor education, skills, and infrastructure reduce productivity and limit growth potential.
Example: Sub-Saharan Africa — low literacy rates and inadequate transport networks hinder economic development.
2nd Chain of reasoning (institutional weaknesses and governance):
Weak institutions, corruption, and political instability discourage investment and efficient resource allocation.
Example: Zimbabwe — hyperinflation and poor governance constrained growth despite natural resources.
Diagram (optional):
→ Solow growth model: low capital and human capital → lower steady-state output → slower growth.
Evaluation:
Constraints are structural and long-term, requiring coordinated domestic and international policy interventions.
Paragraph 3 — Policies to address financial crises
1st Chain of reasoning (monetary and fiscal stabilisation policies):
Central banks can cut interest rates and provide liquidity to banks; governments can implement stimulus packages.
Example: US and UK quantitative easing post-2008 — restored confidence and prevented deeper recessions.
2nd Chain of reasoning (regulation and supervision):
Strong banking regulations, capital requirements, and deposit insurance prevent excessive risk-taking.
Example: Basel III reforms introduced higher capital and liquidity standards.
Evaluation:
Short-term stabilisation can mitigate crises, but long-term effectiveness depends on preventing recurrence and addressing structural vulnerabilities.
Paragraph 4 — Policies to address constraints on development
1st Chain of reasoning (domestic development policies):
Investment in education, healthcare, and infrastructure enhances human and physical capital.
Example: South Korea and Singapore — domestic policies transformed their economies.
2nd Chain of reasoning (international support):
FDI, aid, and debt relief provide capital for development and reduce financial vulnerability.
Example: HIPC Initiative — freed resources for social investment in Africa.
Evaluation:
Policies require good governance, institutional capacity, and effective implementation; without these, benefits are limited.
Paragraph 5 — Globalisation and financial integration
1st Chain of reasoning (benefits):
Access to global capital markets can finance development and smooth shocks.
Example: China and India’s growth leveraged foreign capital inflows and FDI.
2nd Chain of reasoning (risks):
High integration can transmit shocks rapidly, creating global financial instability.
Example: Asian Financial Crisis, 2008 Global Financial Crisis.
Evaluation:
Globalisation increases both opportunities and vulnerabilities; policies must balance growth and risk management.
Judgement / Conclusion
In conclusion, financial crises arise from credit excesses, macroeconomic imbalances, and weak institutions, while economic development is constrained by low human capital, infrastructure, and governance issues. Policies such as monetary/fiscal stabilisation, banking regulation, human capital investment, FDI, and aid can mitigate these problems. The effectiveness of these policies depends on good governance, institutional quality, and coordinated domestic and international strategies. Overall, addressing structural constraints while managing financial risks is essential for sustainable economic development.
Application (AO2 examples)
Global Financial Crisis (2007–2008) — credit boom, bank failures
Asian Financial Crisis (1997) — currency and debt crises
Sub-Saharan Africa — infrastructure and human capital constraints
Zimbabwe — poor governance, hyperinflation
US/UK QE post-2008 — financial stabilisation
Basel III reforms — regulation of banking sector
South Korea, Singapore — domestic development policies
HIPC Initiative — debt relief
China, India — FDI and global integration
Since the global financial crisis of 2008 there have been over 5 700 increases in tariffs, quotas and administrative controls on international trade.
Evaluate the likely effects of an increase in protectionism on the economy of a developing country of your choice. (25mks)
Introduction:
In an increasingly interconnected global economy, the rise of protectionism—the use of policies such as tariffs, quotas, and subsidies to restrict imports—has become a significant trend, with over 5,700 new trade controls implemented since the 2008 financial crisis. This trend has particular implications for developing countries, defined by characteristics such as low per capita income, high poverty rates, and a reliance on primary sector exports. Using a country like Vietnam as a case study, this essay will evaluate the likely effects of increased protectionism on its economy. While protectionism can offer potential short-term benefits, such as protecting infant industries, its ultimate impact is contingent on various factors, including the specific type of policy used, the country's economic structure, and whether the effects are considered in the short or long run.
First paragraph
First chain of reasoning:
Protectionism can protect infant domestic industries
"5700 increases in tariffs, quotas and administrative controls on international trade"
Imposing tariffs on imported goods increases their price. This makes imported goods less price competitive and therefore reduces demand. In turn this makes domestically produced goods more price competitive. This can lead to increased demand for domestic goods, allowing new domestic firms to grow and benefit from economies of scale.
For example for a developing country like Vietnam with many new manufacturing sectors, it allows them to compete against established foreign companies.
Import tariff diagram
Evaluation for first chain of reasoning:
When domestic firms are shielded from international competition, they have less incentive to be productively efficient. This leads to higher prices and lower quality goods for domestic consumers. At a macro level, it causes a misallocation of resources, as a country's resources are not being used in sectors where they have a comparative advantage.
The duration is crucial if the protection is not temporary, it may lead to permanent dependence on subsidies and a lack of international competitiveness, especially if the market is small.
Second chain of reasoning:
Protectionism can improve a country's balance of payments
By making imports more expensive or limiting their volume (quotas) protectionist measures can reduce the value of imports. The decrease in imports can lead to a reduction in the current account deficit or an increase in the surplus, thereby strengthening the country's currency.
Evaluation
Depends on the nature of the imports if they are inelastic, the volume of imports will not increase and will further damage the current account balance
Demand curve (inelastic)
If imports are raw materials or capital goods for domestic production, tariffs would raise the cost of production for domestic firms, potentially leading to lower output, inflation and decline in export competitiveness.
Depends on the likelihood of retaliation, if the countries retaliate their exports will also decrease negating any gains made to the balance of payments
PARAGRAPH 2
First chain of reasoning :
Protectionism leads to reduced choice of goods
By restricting imports, protectionist measures like quotas or high tariffs prevent foreign companies from selling their goods in the domestic market. This means consumers are limited to a smaller selection of brands and product types, as they can only choose from domestically produced goods. For example, a quota on imported cars would limit the number of foreign models available, forcing consumers to choose from a smaller pool of domestic options.
Evaluation:
The effect is more significant for goods that require substantial research, development, and innovation, like electronics or specialized machinery, where foreign firms often have a technological advantage. For simpler, more commoditized goods, the impact on quality may be less pronounced, but choice would still be limited.
Second chain of reasoning:
Protectionism can increase poverty and inequality. (regressive higher prices for consumers)
The higher prices resulting from tariffs disproportionately affect low-income households, who spend a larger portion of their income on essential goods. This reduces their real income and can push more people into poverty. Moreover, if protectionism leads to retaliatory tariffs on the country's key exports (e.g., agricultural goods), it can harm the incomes of farmers and rural workers.
Tariffs on imported food staples in a country like Nigeria, where a significant portion of the population is poor, would raise the cost of living and worsen poverty levels.
Evaluation:
Effect could be mitigated if the government uses tariff revenue to provide a social safety net or subsidies to the poor (benefits) increased government spending since higher tax revenue.
Judgement:
In the long-run the negative effects like inefficiency and risk of retaliation outweight the short term gains like an increased current account. However protectionism can be successful if accompanies with a plan to remove when the industry matures (for infant industries) in a way that the companies are efficient enough to be internationally competitive.
Evaluate the Reasons for Protectionist Policies
Essay Plan: Evaluate the Reasons for Protectionist Policies
Introduction
Hook: Define protectionism as the use of government policies to restrict international trade to protect domestic industries from foreign competition.
Context: Acknowledge the long-standing debate between free trade and protectionism, highlighting the different motivations behind protectionist measures (e.g., tariffs, quotas, subsidies).
Thesis Statement: While protectionism can be justified for specific reasons like protecting infant industries or national security, its effectiveness is highly debatable and often leads to negative consequences such as retaliation, higher prices, and reduced efficiency. The evaluation of its success depends on the specific policy, the industry, and the macroeconomic context.
Paragraph 1 (KAA - Supporting a Case for Protectionism)
Point 1: Protection of Infant Industries.
Chain of Reasoning: Developing industries may not be able to compete with established foreign firms that benefit from economies of scale. Protectionist measures like tariffs allow these "infant" industries to grow, achieve scale, and eventually become competitive on a global level.
Example: The US government's protection of its nascent steel industry in the 19th century helped it grow into a global powerhouse.
Point 2: Preventing Dumping and Unfair Competition.
Chain of Reasoning: Foreign firms may engage in dumping, which is selling goods below their cost of production. This practice can destroy a domestic industry, leading to job losses. Tariffs or anti-dumping duties can be imposed to offset the unfair price advantage, ensuring a level playing field.
Example: The EU has imposed anti-dumping duties on steel products from countries like China to protect its domestic steel manufacturers from what it considers unfair competition.
Paragraph 2 (KAA - Supporting a Case for Protectionism)
Point 1: National Security and Strategic Industries.
Chain of Reasoning: A nation may need to protect industries vital for national security (e.g., defense, essential food, energy production). Relying on foreign suppliers could make a country vulnerable during a conflict or crisis, so protectionist policies ensure domestic self-sufficiency.
Example: Many countries subsidize and protect their agricultural sectors to ensure food security, as was seen during the early stages of the Covid-19 pandemic when supply chains were disrupted.
Point 2: Protection of Domestic Employment.
Chain of Reasoning: The removal of trade barriers can lead to an increase in imports, which may displace domestic production and lead to job losses in import-competing sectors. Tariffs can raise the cost of imports, shifting demand back to domestic goods and thus safeguarding jobs.
Example: The US imposed tariffs on imported washing machines to protect domestic producers and jobs at companies like Whirlpool.
Paragraph 3 (Evaluation)
Evaluation Point 1: Retaliation and Trade Wars.
Chain of Reasoning: Tariffs and other protectionist measures are often met with retaliatory tariffs from other countries. This can escalate into a trade war, where all countries involved suffer a decrease in trade, higher prices for consumers, and a decline in overall economic welfare.
Counter-Point: A single country may be large enough to implement protectionist policies without facing immediate retaliation if its trading partners are less economically powerful or more dependent on its market.
Evaluation Point 2: Inefficiency and Lack of Innovation.
Chain of Reasoning: Protecting domestic industries from competition removes the incentive for them to innovate, improve efficiency, or cut costs. This leads to a misallocation of resources, higher prices for consumers, and a decline in international competitiveness in the long run.
Counter-Point: Infant industry protection, if temporary and well-targeted, can be effective. However, the challenge is that these industries may become dependent on protection and resist its removal, creating a long-term burden on the economy.
Paragraph 4 (Evaluation)
Evaluation Point 1: High Costs for Consumers and Businesses.
Chain of Reasoning: Protectionism increases the price of imported goods, which also allows domestic producers to raise their prices. This reduces consumer surplus and purchasing power. Furthermore, if the protected goods are raw materials or components, this raises the costs for other domestic industries, making them less competitive.
Counter-Point: The long-term benefits of protecting a strategically important or infant industry might outweigh the short-term costs to consumers if it leads to greater economic stability and job security.
Evaluation Point 2: Difficulties in Implementation and Identifying Genuine Need.
Chain of Reasoning: It is difficult for governments to identify which industries genuinely need protection and which are simply inefficient. Protection can be a result of lobbying from powerful interest groups rather than a sound economic decision, leading to corruption and inefficient resource allocation.
Counter-Point: Anti-dumping duties, when justified by a formal investigation, can be a legitimate and necessary tool to ensure fair trade and prevent foreign firms from predatory behavior.
Conclusion
Summary: Reiterate the main arguments, acknowledging that while there are some seemingly valid reasons for protectionism, such as safeguarding infant industries or national security, there are significant drawbacks.
Final Judgement: The success of protectionist policies is highly questionable. They often lead to unintended negative consequences like retaliation, inefficiency, and higher prices for consumers. The most economically sound approach is generally to promote free trade, using targeted and temporary protectionist measures only in exceptional, well-justified circumstances, with strict criteria for their removal.