Introduction to Clinical Chemistry and Quality Assessment/Quality Control
1/45
Earn XP
Description and Tags
Name | Mastery | Learn | Test | Matching | Spaced |
|---|
No study sessions yet.
46 Terms
Screening
Detection of subclinical disease with regular periodic testing and no symptom presentation
Diagnosis
Confirmation or ruling out of a disease with symptom presentation
Monitoring
Checking for treatment or disease progression
Prognosis
Long-term outcome of disease state (recovery or relapse)
Specimen factors
Age, sex, ethnicity, pregnancy, posture, exercise, stress, nutrition, time of day, drugs
needs to be in appropriate containers, labels, and transport conditions
Issues with specimen collection
hemolysis (pink serum/plasma)
delayed centrifugation (false low blood sugar because of glycolysis)
incorrect anticoagulant
temperature requirement deviation
Organic biochemical markers
carbohydrates
lipids
proteins
nucleic acids
Inorganic chemical markers
ions (Na+ and K+)
minerals
dissolved gases (arterial blood gas)
Exogenous chemical markers
Taken in:
therapeutic drugs (chemotherapy)
harmful substances (poisons/toxins)
Quality assessment/assurance
System of creating and following procedures and policies providing most reliable patient laboratory results (includes QC)
Quality control
System designed to ensure individual patient sample measurements are within clinically acceptable limits
monitors quality of lab testing and accuracy and precision of results
routine collection and analysis of data
allows for immediate corrective action
Qualitative testing
Determines presence or absence of substance or analyte, requires + and = control in each run of patient samples
Quantitative testing
measures amount of substance present
at least two levels of controls should be included in each day of patient testing
normal and abnormal ranges determine likelihood of error
Pre-analytical errors (QC)
Problems with specimen (collection, handling, anticoagulant, contamination) and patient identification
Analytical (QC)
implementation of QC processes
selection and managing of control materials
analysis and monitoring QC data
staff training, documentation, review
How to choose QC program
choose high quality QC materials with known analyte concentrations
2-3 levels of control
values cover medical decision levels
similar to test specimen
available in large amounts
Assayed control material
Mean is calculated by manufacturer and is commercially produced, needs to be verified by lab
Unassayed control materials
Less expensive than assayed (made “in house” with pooled sera or specimen)
data analysis is performed
mean is determined by lab
How to establish control ranges
20 data points over 2 weeks or 10 working days
not over 4 weeks or 20 working days
represent procedural variation (different operators and time of day)
determine amount of allowable error
Median
Value at center (midpoint) of observation points
Mean
Calculated average of valuesM
Mode
Value that occurs with the greatest frequency
Precision
Degree of fluctuation in measurements indicates precision
Accuracy
Closeness of measurements to true value is accuracy
Between run precision
Reproducibility - closeness of individual results with same method and test material but different conditions, operator, and instruments
Within run precision
Repeatability - closeness of individual results with same method, test material, conditions, operator, instrument, and time intervals
Measures of dispersion of variability
Range, variance, standard deviation, coefficient of variation
Standard deviation
Gaussian distribution with +/= 1, 2, 3 SD
result in values falling within range 68.2, 95.4, and 99.7% of the time, respectively
Standard deviation criteria for reference ranges
usually +/= 2 SD are used to set criteria for acceptable limit (95.4% confidence)
values fall outside of criteria 4.5% of time most likely due to error
Coefficient of variation (CV)
SD expressed as percentage of mean (index of precision), ideally less than 5%
CV% = SD/mean x 100
Levey-Jennings Chart
Graphical method of displaying control results and evaluating if a procedure is in or out of control
plotted vs. time
Random error
Error that occurs unpredictably due to poor precision
Systemic error
Error that occurs predictably once a pattern of recognition is established
Shift
Sudden and sustained change in quality control results above or below mean
Trend
Gradual and steady change in QC results moving up or down away from mean
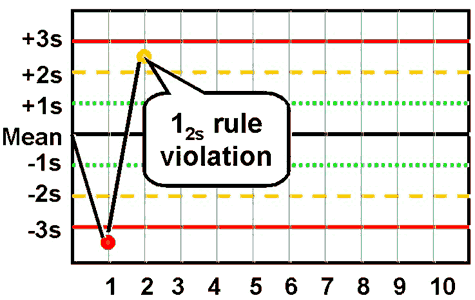
westgard rule 12S
one control point of two fall outside of ±2 SD
warning rule - alert to potential problems
do NOT reject run
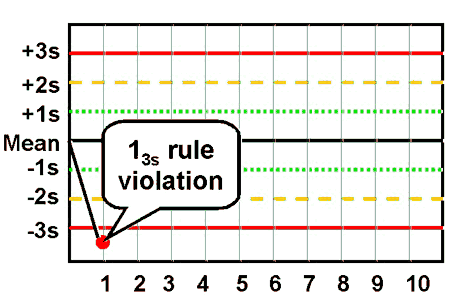
westgard rule 13S
one control point of two fall outside of ±3 SD
detects random error
reject run
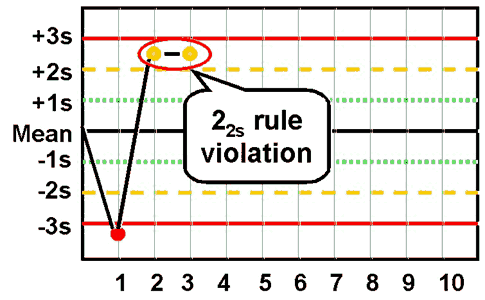
westgard rule 22S
two consecutive control points for the same control level falls outside of ±2 SD in the same direction
the same control point in both control levels in the same run exceeds ± 2 SD
detects systematic error and requires corrective action
reject run
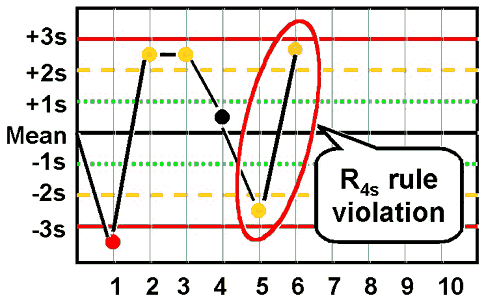
westgard rule R4S
one control exceeds the mean by -2 SD and the other control exceeds the mean by +2 SD
the range between the two results exceed 4 SD
random error has occured
reject run
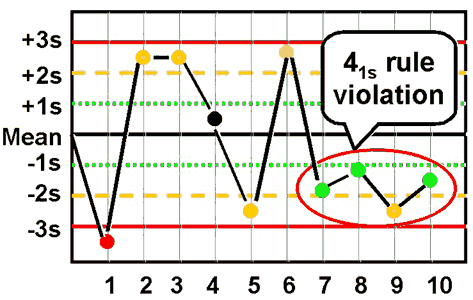
westgard rule 41S
four consecutive control points for one or more levels of controls are outside ±1 SD on the same side of the mean
this is a shift that indicates systematic error
reject run
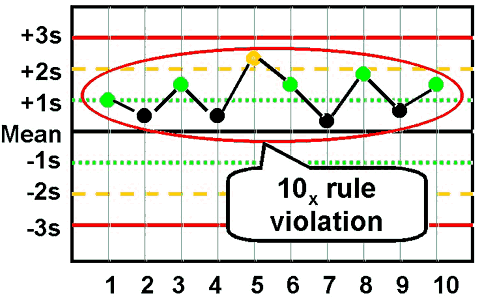
westgard rule 10x
ten consecutive control points for one level of control is on one side of the mean
shift indicating systematic error
reagent or calibration problem
reject run
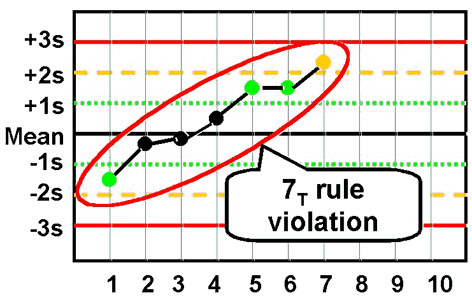
westgard 7T
seven control points (not including first point in graph) trend in the same direction
can cross mean
reject run
imprecision
large amount of scatter around the mean
usually caused by errors in technique
inaccuracy
may be seen as a trend or shift
usually caused by change in testing process or deterioration of reagents
random error
no pattern
caused by poor technique or malfunctioning equipment
post analytical factors
reference ranges
medical decision values
critical values