7. pH Curves and Titration
1/20
There's no tags or description
Looks like no tags are added yet.
Name | Mastery | Learn | Test | Matching | Spaced |
|---|
No study sessions yet.
21 Terms
Titrant/Standard Solution
reactant (acid or base) solution that the concentration is known
Analyte
solution with unknown concentration
Equivalence Point
titrant is added to an unknown concentration sample until all the reactant is consumed (equal moles)
Visible by using an indicator
Halfway point on ‘jump’ on pH curve
Titration
process of analyzing characteristics of a solution (ie. concentration and pH) by the reaction of a solution with a standard solution of acid or base
Steps of a Titration
sample place in flask
drops of titrant are slowly added
continues until equivalence
How is titration progress measured?
pH meter
data logger
records pH changes
pH data is plotted against…
volume of standard solution, producing a pH curve
What must be known about both substances?
both volumes
only one concentration
What do pH Curves depend on?
strengths and concentrations of the acid/base
addition order
Buffer Region
when both components of weak conjugate acid-base pair are present
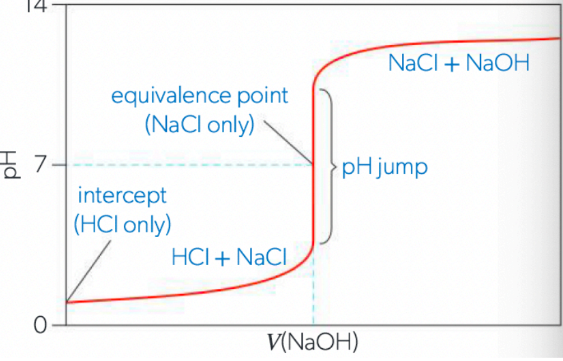
Scenario 1: Strong Acid titrated with Strong Base
strong acid (HCl) will have a low pH (y-intercept at approx. 1)
strong base will raise the pH slowly at first (excess acid at first)
pH rises sharply at equivalence point to pH of 7 (no hydrolysis)
continues to rise quickly after pH 7 (unneutralized NaOH makes solution basic)

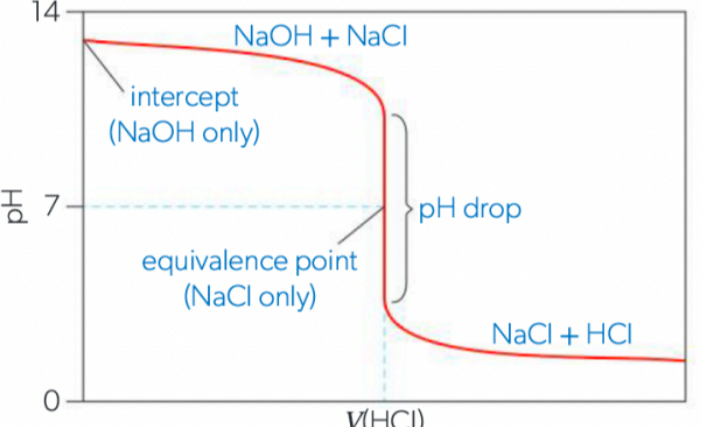
Scenario 2: Strong Base titrated with Strong Acid
strong base (NaOH) will have a high pH (y-intercept at approx. 14)
strong acid will drop the pH slowly at first (excess base at first)
pH drops sharply at equivalence point to pH of 7 (no hydrolysis)
continues to drop quickly after pH 7 (unneutralized HCL makes the solution acidic)

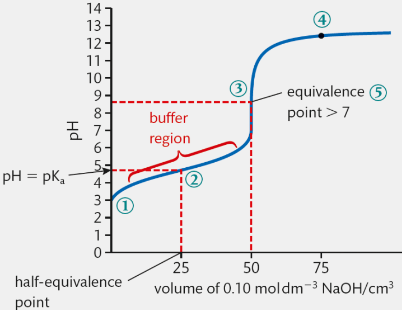
Scenario 3: Weak Acid and Strong Base (pH > 7 equivalence)
weak acid will have a higher pH at y-intercept (compared to strong acid)
pH rises slowly until equivalence (“buffer region”- both components of weak conjugate acid-base pair present)
pH rises sharply at equivalence (not as dramatic as scenario 1)
continues to rise (pH>7)

Scenario 4: Strong Acid and Weak Base (pH < 7 equivalence)
strong acid will have a lower pH
pH rises slowly until equivalence (“buffer region”)
pH rises sharply at equivalence (not as dramatic)
continues to rise but flattens at a fairly low pH
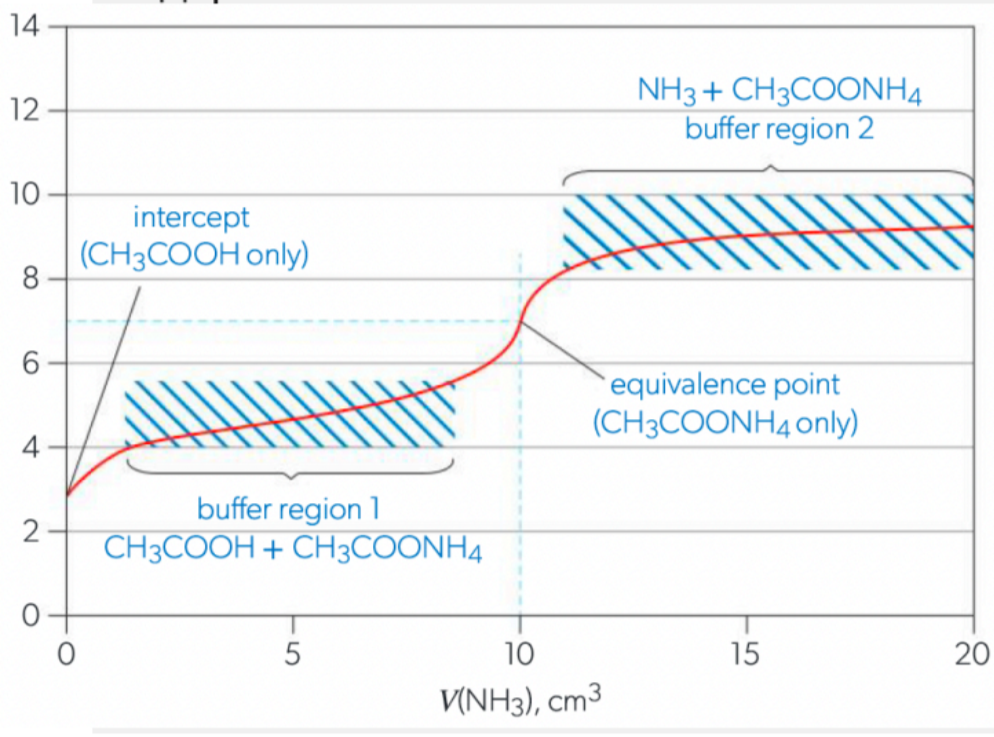
Scenario 5: Weak Acid and Weak Base (pH undefined)
initial pH fairly high (if acid)
pH rises slowly until equivalence (“buffer region”)
change in pH at equivalence is not sharp
continues to rise but plateaus at low pH

Acid-Base Indicators
weak acids that show one colour as an acid and another colour as their conjugate base form.
We can make the equivalence or endpoint visible by adding an indicator (change colour when pH= +/- 1 of the indicator’s pKa value)
better if endpoint & equivalence point coincide with each other so must pick appropriate one
What are the Steps to Choose an Indicator?
Determine what combination of weak and strong acid are reacting together
Deduce the pH of salt solution at equivalence from the nature of the parent acid and base
Choose an indicator with an endpoint in the range of the equivalence point

What indicators should be used for a Strong Acid and a Strong Base?
Substance Type | Indicator | pKa | End-point range |
Acid | Phenolphtalein | 9.50 | 8.2-10.0 |
Base | Methyl Orange | 3.46 | 3.2-4.4 |
What indicators should be used for a Weak Acid and a Strong Base?
Substance Type | Indicator | pKa | End-point range |
Base | Phenolphtalein | 9.50 | 8.2-10.0; colourless to pink |
Base | Phenol Red | 8.00 | 6.6-8.0; yellow → red |
What indicators should be used for a Strong Acid and a Weak Base?
Substance Type | Indicator | pKa | End-point range |
Base | Methyl Orange | 3.46 | 8.2-10.0; red → yellow |
Base | Bromophenol blue | 4.10 | 3.0-4.6: yellow → blue |
What indicators should be used for a Weak Acid and Base?
remember indicators indicate when pH = -/+ 1 of the indicator’s pKa value
since weak acids and bases barely change pH, indicators would not pick up the changes