Paper 3: Physical Fieldwork
1/36
Earn XP
Description and Tags
Name | Mastery | Learn | Test | Matching | Spaced | Call with Kai |
|---|
No study sessions yet.
37 Terms
Write the title of your physical geography fieldwork enquiry
How has longshore drift affected the morphology of Solvent Beach
What was your 2 hypothesis’ about the beach and pebbles?
1) The beach will get wider from west to east along Solvent Beach
2) The pebble size will get smaller and more rounded from west to eat along Solvent beach
Explain why this topic is suitable for a geographical enquiry
The process of LSD is accessible in theory and easy to understand
You can easily collect primary data
There are many places along the coastline in the UK where you can study this topic
Outline the theory underpinning the field work
Longshore drift theory
Explain the longshore drift theory
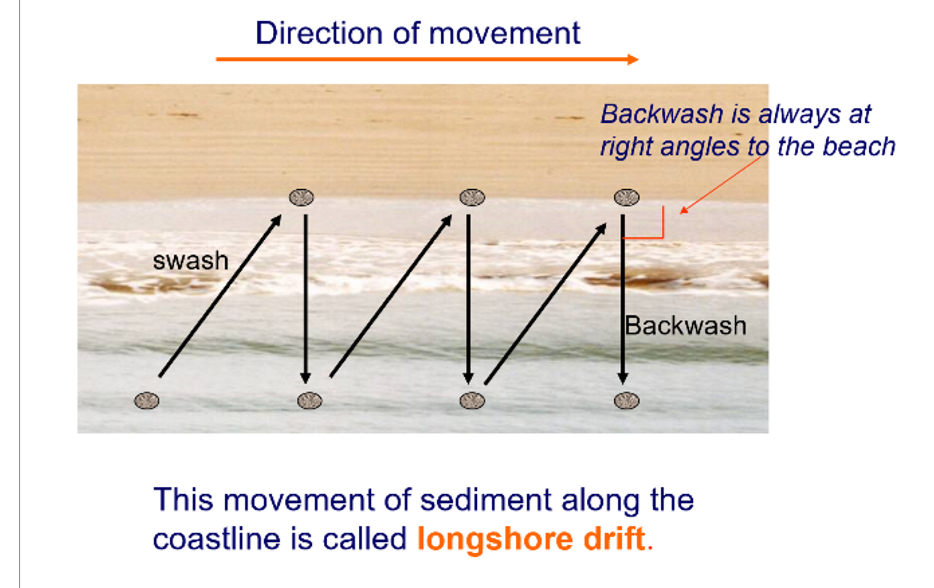
As the prevailing wind direction approaches the shore at an angle so do the waves.
The incoming swash of the waves comes into the beach at an angle, however the subsequent backwash is dragged backout perpendicular to the shore
Sediment carried by the waves is brought in at an angle and transported out perpendicular to the shore. This process repeats so that sediment is carried in a zig zag motion along the beach.
The waves have the most energy at beginning of the process and less at the end, meaning that the waves are able to carry larger sediment at the beginning (west) and only smaller sediment at the end (east). So they deposit larger sediment first and gradually smaller as they lose energy.
This means that the beach sediment size is likely to be graded form one end to the other with the largest sediment at the south and small at the north.

Describe the location of the fieldwork
Solent Beach in Hengistbury Head. This is located on the South Coast in Dorset near to the town of Christchurch
Justify why this was a suitable location (advantages of the area)
1) A stretch of coast which has evidence of longshore drift (transportation), erosion and deposition
2) It is easily accessible due to safe parking facilities and access into the beach. There are also clear walking footpaths that get you from visitors centre to the beach
3)Has great natural beauty
4) There is a visitors centre near the beach offering infrastructure
What were some risks you faced and how did you overcome them?
Drowning (risk level 9): Do not go in the water and stay clear from the edge
Trips, slips and falls (level 5): Wear appropriate footwear. Do not run. Look where you are going
Injury from animals, pet dogs, wild animals, stings from the sea: Do not go off the path
Danger from strangers : Be polite and respectful of others and be aware of your surroundings and belongings
Dehydration, sunburn and heat stroke if hot. Hypothermia if cold: Check weather forecast and wear appropriate clothing/ equipment
Identify your method to collect primary data of the beach profile and state whether it is quantitative or qualitive
Beach profile: Quantitative:
To measure the width of the beach from site 1-6 and the angle of the beach from the foreshore to backshore.
If the beach gets bigger going North this will suggest LSD as sediment will have been transported from the South at Start point and deposited a the North end of the beach
Identify your method to collect primary data of the beach profile and state whether it is quantitative or qualitive
Sediment size: Quantitative
Select random pebbles using a quadrat choosing 5 samples from the corners and the centre
If the sediment size gets smaller going North this will suggest LSD as the sediment will have been sorted and graded.
This is because the waves will be able to transport finer sediment further as it has less energy.
As the waves travel north their energy reduces and so they drop their load
Explain in detail the method for beach profile
Follow a straight transect line form the edge of the sea to the end of the active beach. Split the line into segments where the slope angle changes. Each reading is taken from break of slope to break of slope.
Person A stands at a safe distance from the edge of the sea holding a ranging pole
Person B stands holding a second ranging pole further up the beach where there is a break of slope
The distance between the two ranging poles is measured using a tape measure
The angle between matching markers on each ranging poles is measured using a clinometer
Repeat this process at each break slope until the top of the beach is reached
From this data the beach profiles can be drawn and the cross sectional area calculated from each site.
What are the advantages of the method used to test the beach profile?
-can find averages for trends
-simple way of collecting enough data to present in a graph
-Easy to use equipment
-Quick and easy to in the day we had
What are the disadvantages of the methos used to test the beach profile?
-Chance of human inaccuracies as different groups collecting different data for different profiles
-Equipment can be used inaccurately
Explain in detail the method for measuring Sediment size.
Using quadrants select 5 pebbles taking one form each corner and one from the middle at the first transect site closest to the sea
For each pebble measure the longest axis using callipers
Find the average pebble size by adding up all the sizes and dividing by 5.
Record your results in ArcDIS survey programme on phone.
Repeat at the start of each transect
What are the advantages of the method you used to test the sediment size?
-It is a simple and quick way to select the rocks to measure in order to find an average
-The quadrat is easy equipment to access or could be made with string and a frame
-Helps geographers help understand sediment sizes from across a beach
-Lightweight equipment to carry along the beach.
-consistent measuring with the longest axis being measured each time
-randomised selection using quadrant reduces bias
What are the disadvantages of the method you used to test the sediment size?
-there could be bias, people tend to choose the pebbles that appear to be the “prettiest”
-If the person is blindfolded to try and eliminate bias they are likely to pick the biggest pebbles
-measuring can be difficult/ inaccurate with a round object
-doesn’t cover a large span of the testing site
-helps show the effect of LSD on sediment that make up the morphology of the beach
Explain in detail the method for measuring Sediment size.
Using quadrants select 5 pebbles taking one form each corner and one from the middle at the first transect site closest to the sea
For each pebble look at against the Powers Pebble Roundness Index
Find the average pebble roundness by adding up all the sizes and dividing by 5.
Record your results in ArcDIS survey programme on phone.
Repeat at the start of each transect
What are the advantages of using photographs to support you in your fieldwork?
-can helps provide a visual representation to better understand the physical geography of an area when descriptions cannot be fully useful
-Maps are vital to find your way around the beach that you are studying , and without them fieldwork would be much more difficult. Maps help you plan where the sites will be and give you landmarks to measure out your 200m gaps
What are the advantages of using photographs to support you in your fieldwork?
Only a snapshot of one area and at one point in time so they do not show full representation of the area
Person taking the photos selects what to focus on, so can be biased to show a particular vision/make appoint
What is the process of making a field sketch?
Decide of a frame you want to draw and the purpose of your field sketch. Sketch the background and foreground of the area.
draw features/ objects as seen
label relevant features and add notes/ annotations
include title and information e.g date, time, place
What are the advantages of a field sketch?
-develops ability to record and observe important information by taking time to view and understand the landscape wile sketching.
-allows you to add notes directly onto the sketch
-easier to label important information
What are the disadvantages of using field sketches?
-requires more time than taking a photograph
a sketch doesn’t show changes over time
What do you expect to conclude after looking at your result concerning the beach profile?
If the beach gets wider and steeper with distance then it suggests LSD is active along the beach
What do you expect to conclude after looking at your result concerning the sediment size and roundness?
If sediments gets smaller and more round with distance it suggests LSD and attrition are active along the beach
Explain how your method to sample the beach profile was systematic
The sampling method along the beach was systematic as we wanted to measure the profile along the beach 6 times approximately spaced 200 m apart. This enabled us to collect enough sites to cover 1200m of beach which was judged to accurately show a change within the time available.
At each sit the angle was measured from the shoreline to wherever the gradient changed, using a clinometer. This was repeated until we reached the top of the bar because it was quick and easy and enabled us to locate key angle changes on the beach profile.
We were able to use the same method at each site to ensure accuracy across a range of different groups conducting the method. This data showed us the width and depth and profile of the beach at each site
Explain how your method to sample the sediment size and roundness was systematic
It was systematic as we wanted to measure sediment size at regular at each of the 6 sites along the beach.
Sediment was collected along the beach 6 times at approximately 200m apart along Solent beach. 5 samples were collected from the first gradient change up the beach and an average taken. This was an accurate and objective sampling method in the time available
State any secondary research that was taken to support your inquiry
Using maps to locate the data - this helped us to be able to accurately find the area and check that it is suitable area to study and sample with accuracy
What type of graph could you use to represent your data for the beach profile results?
line graph

Describe the advantages of how you represented your data for the beach profile
-Continuous data in a line graph - clear way to show the change in gradient across the length of the beach
-allows easy comparison between each of the sites as you move across the beach
-allows you to see the gradient change therefore you can easily see the change in shape of the beach.
Describe the disadvantages of how you represented your data for the beach profile
-doesn’t provide an exact and clear comparison as scale has to be different for different measurements so can be hard to compare graphs
-if the scale is the sae for each then he gradient becomes hard to see so therefore hard to compare between sites
What type of graph could you use to represent your data for the sediment size results?
Geo located proportion symbol

Describe the advantages of how you represented your data for the sediment size
-visually easy to read - easy to see where the data was collected
-exact to measure - easy to compare and see where hey are when located on the map
-good to show the range of sediment size
Describe the disadvantages of how you represented your data for the sediment size
-symbols/circle often overlap so can be hard to red
-hard to show an exact location because of the changing sizes and therefore difficult to make a direct comparison
What was your hypothesis for the trend in sediment size and roundness?
Sediment size gets smaller and the sediment gets rouder
What was your hypothesis for the trends in beach profile?
Beach gets wider from west to east
Analyse your results for Beach Profile. (Include stats)
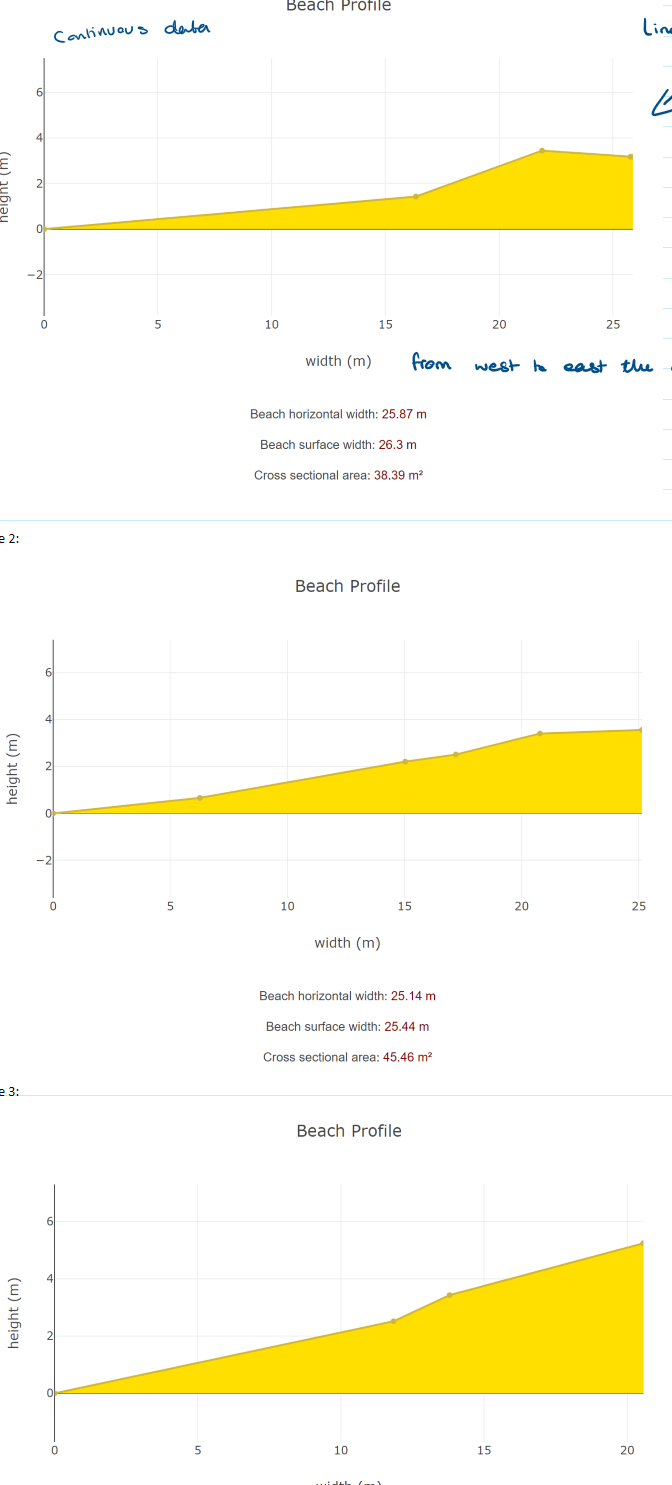
The results show that the general trend is that the beach width increases from west to east (and therefore the cross-sectional area similarly increases), aligning with the hypothesis.
At sites 1-4 the cross-sectional areas increases form 38m² to 130m². There are a few anomalies, in site 2 and 3, because it was too dangerous to measure up to the edge of the sand dunes due to a steep cliff.
Beyond site 4 the cross-sectional area lowers because of the long groyne. After the long groyne, the trend in the beach profile shows that it gets narrower, as the sediment from longshore drift has been trapped on the other side of the long groyne.
Additionally as the tide came in throughout the day our results were altered. However, the overall trend shows that our hypothesis was correct and the beach profile does indeed get wider from west to east in line with the direction of LSD.
Analyse your results for Beach Profile. (Include stats)
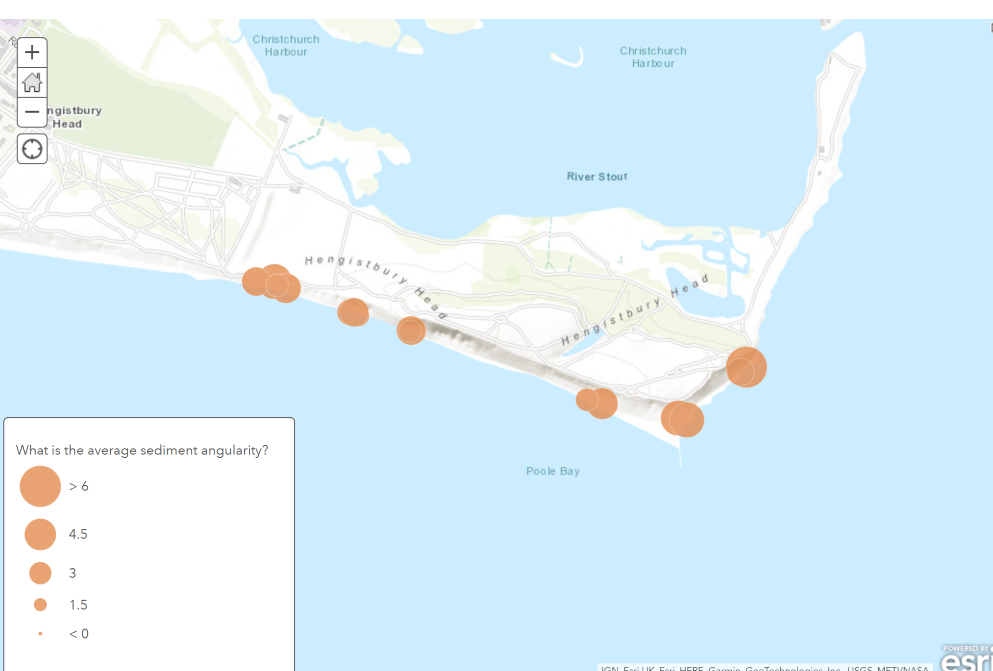
From west to eat before the groyne the general trend is that the sediment gets more round moving down the beach from west to east, aligning with our hypothesis and (taking human error into account). The average roundness at the last 2 sites is bigger than those at the first 4 sites.
On the western part of the beach at site 1 the average sediment angularity is 3.5 whereas on the eastern part of the beach by site 5 it was 4.25.
Anomalies site 6 was 3.2 so hypothesis can not fully be accepted but this could be because of sediment falling from the cliffs that hasn’t had as much time to get smoothed by the sea, or even human activities which interfere with the sediment on the beach.
Picking up sediment could also be biased, with humans being drawn to bigger/ rougher pieces and using Power Index is very subjective as a person is judging pebble roundness.