Person-Time rate, Mortality Rates & Screening
Characteristics of Mortality Rates
Use item intervals of 1 month
Numerator —> Deaths
Denomination —> Total Pop.
What’s the Crude Death Rate formula? & what it means?
(deaths occurring during a given time period) / (size of pop. of which deaths occurred in)
general risk/rate of dying for specific pop
What’s Cause Specific death rate formula? & what it means?
(# of deaths assigning a specific cause during a time interval) / (size of the pop. from which deaths occurred)
risk of dying for that specific condition for the specific population
crude death rate is used to compare?
age adjusted rate
What’s Case-fatality rate formula? & what it means?
(# of deaths of a specific disease during a specified period) / (# of individuals with that disease)
the risk of a person dying if the person develops the condition
What’s Proportionate Mortality rate formula? & what it means?
(# of death due to a particular cause) / (# of deaths from all causes)
the proportion of deaths in a specified population over a period of time attributable to different causes
What’s Infant Mortality rate formula? & what it means?
(# of death under 1 year of age during a given time interval) / (# of live birth reported during the same time inveval)
rate of infant deaths that aren’t surviving after live births
What’s Maternal Mortality rate formula? & What does it mean?
(# of deaths assigned to pregnancy related to causes during a given time interval) / (# of live births reported during the same time interval)
the rate of deaths from pregnancy complications in relation to the amount of successful live births at the same time.
What’s incidence rate?
number of new cases/total population you’re looking at that’s at risk
What’s Primary attack rate?
number of new cases / population at risk in the beginning of that time frame
What’s secondary attack rate?
number of new cases among contacts of the original cases/ total # of contacts
What’s Point Prevalence?
number of new & old existing cases at a specific point in time/ total study population at the same specific point
What’s Period Prevalence?
number of new & old cases during a period of time/ total study population at that period of time
What’s Person-Time/ Incident density rate?
new cases / number of people & the total amount of time each person was at risk for the the duration you’re looking at.
What’s Neonatal death rate?
number of deaths under 28 days of life @ a given time period/ number of live births reported during the same time period
What’s postnatal rate?
number of deaths between 28 days and 1 year of life @ a given time period/ number of live births reported during the same time duration
How to solve for potential life lost?
Pick a reference age
Subtract the reference age from the ages of the other deaths
total those numbers to see how many years were lost in the group you’re looking at
What does Years of Poetical life Mean (YPLL)
estimated number of years(life) loss to premature deaths
What does Adjusted rate tell us?
the adjusted data for some of the potential biases to compare groups with different distributions
What is the Direct Age-Adjusted Rate?
Expected deaths during the standard population in a given time period/ standard population.
How are you using the Standard group in the Direct Age-Adjusted Rate?
you’re applying the populations of the standard groups to the crude death rates of the non-standard.
What’s the algorithm to solve for the Direct Age-Adjusted Death rate?
Identify the standard population
Apply non-standard rates to each distribution of the standard population
total to find the expected death of the standard population
Apply the formula…which is?
What is the Indirect Age-Adjusted Rate (Standardized Mortality ratio/SMR)?
Actual(or observed) deaths / expected deaths
How are you using the Standard group in the indirect Age-Adjusted Rate (Standardized Mortality ratio/SMR) method?
you’re applying the crude death rates of standard population to the non-standard population distributions
What’s the algorithm to solve for the Indirect Age-Adjusted Death rate SMR?
figure out standard group
take the rate of the standard group and apply to each distribution of the non-standard group
total these up to give you expected deaths
apply to formula..which is?
If the SMR = 1 then?
it means the health related states/events observed in the non-standard population were the same as expected from the standard population trends.
if the SMR > 1 (greater than 1) then?
it means the health related states/events observed in the non-standard population were more than what was expected based on the standard population trends.
if the SMR < 1 (less than 1) then?
it means the health related states/events observed in the non-standard population were less that what would be expected based on standard population trends.
When is indirect age adjustment (SMR) often used?
when numbers of death for each age-specific stratum aren’t available but the total count of deaths are.
What rate are you looking at when you’re trying to see the proportion of death that occupies each death (or part of pie in all the deaths?)
Proportionate mortality
What is screening?
examination of a group of usually asymptomatic individuals to detect those with high probability of a given disease
What is the Validity of screen testing? & how do we check for validity?
ability to distinguish between who truly has a disease & who doesn’t
check with Sensitivity & Specificity
What does Sensitivity tell us?
is the proportion of disease people who are correctly identity as positive by the test
What does Specificity tell us?
is the proportion of non-disease people who are correctly identified as negative by the test
What’s sensitivity’s formula?
True Positives / True positives + False Negatives
What’s specificity formula?
True negatives / True Negatives + False positives
When do we use Age-Adjusted rate?
to compare crude mortality rates of 2 different populations (that have different age distributions)
When do we use crude mortality rate?
to establish the risk of death in a community/populaiton
What do we assume for Direct (Age-Adjusted) rate?
How do we do this assumption?
assume population we’re interested in has the same age distribution (same people in each age category) as the standard population
In each age category —>( Standard pop. #s) X (rate(rise of dying: crude rare) of pop. we’re interested in looking at)
What do we assume for Indirect (SMR) rate?
How do we do this assumption?
Assume population we’re interested in has the same risk of dying (rates) as the standard population.
In each age category —> (Standard rate (risk of dying: crude rate)) X (Pop. #s of interest)
Person-time rate is a type of?
Incidence rate (incidency rate)
How to Solve for person time rate?
Count # of new cases for period of time you’re evaluating = n
for each person —> (1 person x unit of time they were at risk/not sick if repeatable disease) = the time the person was at risk for
total all people’s time at risk = d
plug into formula… which is?
What is going to be more specific that incidence rate & give us more accurate rates? & why?
Person-time rate
is able to display in calculations the exact time each person was at risk for in relation to the amount of new cases.
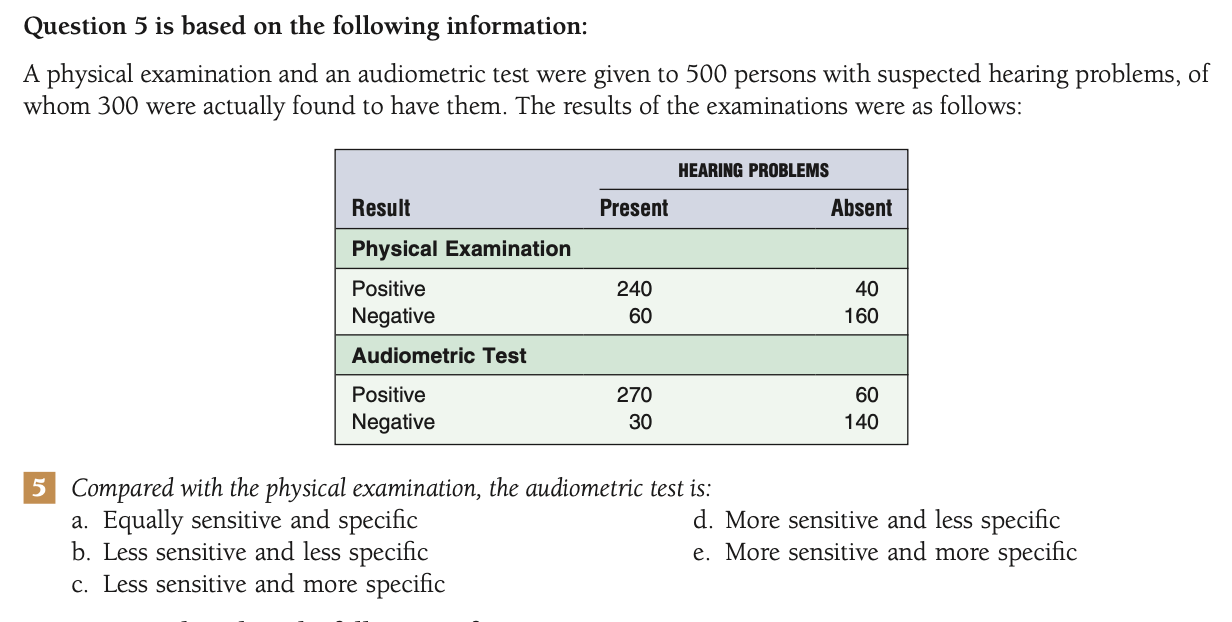
How do you set up the table for solving Screen Validity problems in relation to Sensitivity & Specificity?
How would you plug in the data to solve for Sensitivity?
How would you plug in the data to solve for Specificity?
What are these formulas solving for?
Sensitivity → TP/ TP + FN (denominator gives you the actual amount of positives)
Specificity → TN/ TN + FP (denominator gives you the actual amount of negatives)
How accurate your test is (how validate → test validity)
In an Asian country with a population of 6 million people, 60,000 deaths occurred during the year ending December 31, 2010. These included 30,000 deaths from cholera in 100,000 people who were sick with cholera.
What was the cause-specific mortality rate from cholera in 2010? _____
30,000/6,000,000
because it’s # of deaths from a cause/total population
In an Asian country with a population of 6 million people, 60,000 deaths occurred during the year ending December 31, 2010. These included 30,000 deaths from cholera in 100,000 people who were sick with cholera.
What was the case-fatality from cholera in 2010? _____
30,000/100,000
because # of death from a cause/total people with the cause who have it. It’s because it’s your risk or how fatal that disease could be if you got it based on the population data.
Age-adjusted death rates are used to:
a. Eliminate the effects of differences in the age distributions of populations in comparing death rates
b. Correct death rates for errors in the statement of age
c. Determine the actual number of deaths that occurred in specific age groups in a population
d. Correct death rates for missing age information
e. Compare deaths in persons of the same age group
a. because in age-adjusted you’re assuming the age differences are the same as in the standard population. This allows you to eliminates those differences and properly compare the death rates with a standard pop.
The mortality rate from disease X in city A is 75/100,000 in persons 65 to 69 years old. The mortality rate from the same disease in city B is 150/100,000 in persons 65 to 69 years old. The inference that disease X is two times more prevalent in persons 65 to 69 years old in city B than it is in persons 65 to 69 years old in city A is:
a. Incorrect, because a proportion is used when a rate is required to support the inference
b.Incorrect, because of failure to distinguish between period and point prevalence
c. Incorrect, because of failure to adjust for differences in age distributions
d. Incorrect, because of failure to distinguish between prevalence and mortality
e.Correct
d. because, mortality rate is just the risk of dying for a population and hasn’t been standardized. Also, prevalence is used to to see how prevalent a disease is. Mortality rates can’t directly tell us how prevalent a disease is in a population.
The incidence rate of a disease is five times greater in women than in men, but the prevalence rates show no sex difference. The best explanation is that:
a. The crude all-cause mortality rate is greater in women
b. The case-fatality from this disease is greater in women
c. The case-fatality from this disease is lower in women
d. The duration of this disease is shorter in men e. Risk factors for the disease are more common in women
b. because of what incidence rate & prevalence rate calculates for, it’s likely because the duration of the disease is shorter in women making their case-fatality higher for women. Since more women will die from the disease/ over the amount of people who have it.
For a disease such as pancreatic cancer, which is highly fatal and of short duration:
a. Incidence rates and mortality rates will be similar
b. Mortality rates will be much higher than incidence rates
c. Incidence rates will be much higher than mortality rates
d. Incidence rates will be unrelated to mortality rates
e. None of the above
a. because the disease has high fatality & a short duration, the people who do get it will also die from it making the rates similar.
In 1990, there were 4,500 deaths due to lung diseases in miners aged 20 to 64 years. The expected number of deaths in this occupational group, based on age-specific death rates from lung diseases in all males aged 20 to 64 years, was 1,800 during 1990. What was the standardized mortality ratio (SMR) for lung diseases in miners? ______
2.5 —> more than what’s expected!
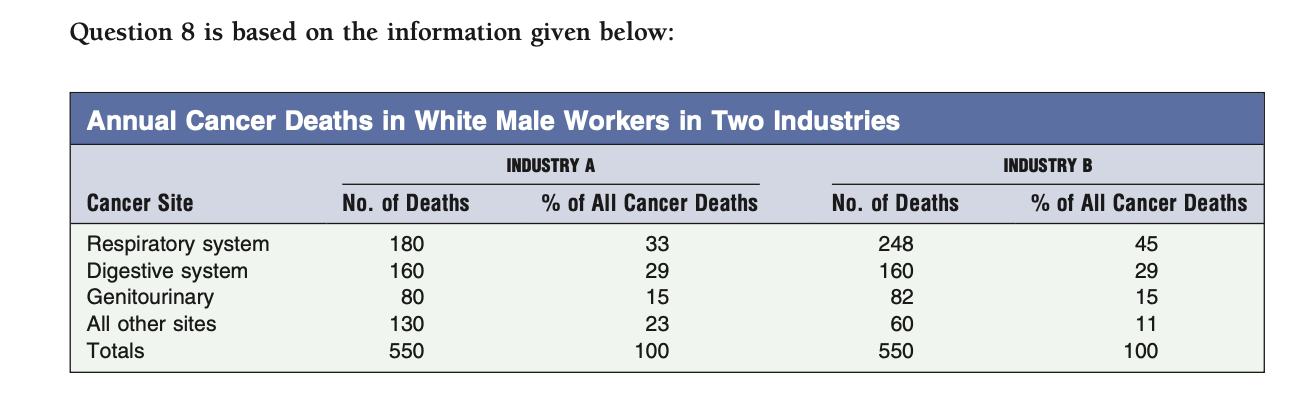
Based on the preceding information, it was concluded that workers in industry B are at higher risk of death from respiratory system cancer than workers in industry A. (Assume that the age distributions of the workers in the two industries are nearly identical.)
Which of the following statements is true?
a. The conclusion reached is correct
b. The conclusion reached may be incorrect because proportionate mortality rates were used when age-specific mortality rates were needed
c. The conclusion reached may be incorrect because there was no comparison group
d. The conclusion reached may be incorrect because proportionate mortality was used when cause-specific mortality rates were needed
e. None of the above
d. because they are using proportionate mortality rate which only tells us the % of deaths in a population that are from a specific cause (slice of pie it takes up), while cause-specific mortality rates tell us the risk of dying from a specific cause in that population. In general proportionate mortality rate can’t give us any clues to risk.
A program manager from an international health funding agency needs to identify regions that would benefit from an intervention aimed at reducing premature disability. The program manager asks a health care consultant to de- velop a proposal using an index that would help her make this decision. Which of the following would best serve this purpose?
a. Case-fatality
b. crude mortality rate
c. disability adjusted life years
d. standardized mortality ratio
c. because they are trying to reduce premature disability, so they will need a standard population to adjust the years to for each region to figure it out.
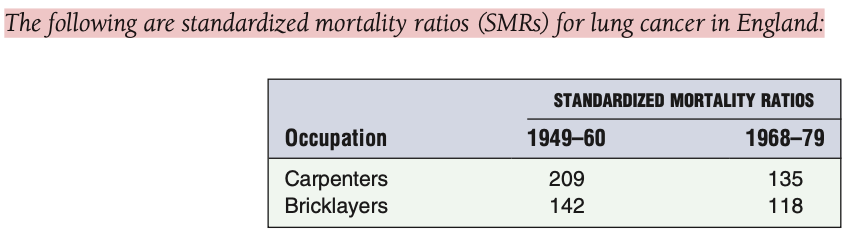
Based on these SMRs alone, it is possible to conclude that:
a. The rate of death from lung cancer in carpenters in 1968–79 was greater than would have been expected for a group of men of similar ages in all occupations
b. The age-adjusted rate of death from lung cancer in bricklayers was greater in 1949–60 than it was in 1968–79
c. The number of deaths from lung cancer in
carpenters in 1949–60 was greater than the number of deaths from lung cancer in bricklayers during the same period
d. The proportionate mortality from lung cancer in bricklayers in 1949–60 was greater than the proportionate mortality from lung cancer in the same occupational group in 1968–79
e. The proportionate mortality rate from lung cancer in carpenters in 1968–79 was 1.35 times greater than would have been expected for a group of men of similar ages in all occupations
a. because SMR assumes that the crude rates will be the same as the standard group. It compares the rates of the standard group (group of men in similar ages in all occupations) to figure our what is expected for the population of interest (the carpenters in this response). SMR will tell us if the group of interest has deaths great, equal to or less than what is expected to the standard population.
Which of the following statements regarding direct adjustment is TRUE?
a. Age-adjusted mortality rates for community X should be used to make decisions regarding allocation of funding for hospital care of the dying in community X
b. For direct age-adjustment, the weight for a given age category is the percentage of deaths for that age group
c. The difference in the adjusted mortality rates between community X and community Y is always attributable to differences in age composition between the two populations
d. For direct age-adjustment, the weight for a given age category is the number of individuals in the standard population for that age group
e. The age-adjusted mortality rate of community X is still higher than the mortality rate of community Y, as compared to the crude mortality rate
d. this is because you’re assuming the standard population Is the same in each age group in the population of interest & applying their crude rate to the standard. It is also seen through calculations that this is true.
Surveillance data indicate that the prevalence of chronic liver disease in the United States increased 104% between the years 1990 and 2008. While chronic liver disease occurs in persons of all ages, the highest mortality rate occurs in people 65 years old or older. The United States has proportionately more people 65 years or older than Country X. What would happen if crude mortality rates in the United States were age standardized to the population of Country X in order to compare the risk of dying of chronic liver disease in the two populations?
a. The age-standardized mortality rate for the United States would be less than the crude mortality rate for the United States
b. The age-standardized mortality rate for the United States would be greater than the crude mortality rate for the United States
c.The age-standardized mortality rate for the United States would be the same as the crude mortality rate for the United States
d. The age-standardized mortality rate for the United States cannot be used for this comparison
e. The age-standardized mortality rate for the United States would be the same as the proportionate mortality rate
a. Country X is smaller in direct comparison to the US. If you standardized the US to country X (treating country X as the standard) the Age-Standardized rate would be less the the actual crude rate of the US since the US also has way more 65 year olds.
Among workers in a fish processing plant, 30% of all deaths were due to myocardial infarction. Among workers in a brewery, 10% of all deaths were due to myocardial infarction. Investigators concluded that workers in the fish pro- cessing plant had a greater risk of death due to myocardial infarction than workers in the brewery. This conclusion:
a. Is correct
b. May be incorrect because it is based on proportionate mortality
c. May be incorrect because it assumes the same case fatality for myocardial infarction in both work sites
d. May be incorrect because consumed fish oil is protective against death due to myocardial infarction
e. May be incorrect because the prevalence of myocardial infarction in the two groups is not known
b. because proportionate morality rate doesn’t tell you the risk of death in a certain population, it tells you how much of all death were of a certain cause in that population.
d.