ECON 101 - Microeconomics Chapters 4, 6, 9, & 10
1/208
There's no tags or description
Looks like no tags are added yet.
Name | Mastery | Learn | Test | Matching | Spaced | Call with Kai |
|---|
No analytics yet
Send a link to your students to track their progress
209 Terms
Elasticity
A measure of how much one economic variable response to changes in another’s percentage-changes in the variables.
Price Elasticity of Demand
The responsiveness of the quantity demanded to a change in price.
Formula for Price Elasticity of Demand
= (Percentage change in Quantity Demanded) / (Percentage change in Price)
Outcome of Formula for Price Elasticity of Demand
Since both price and quality change in opposite directions on the demand curve, the price elasticity of demand is negative. But the more negative the elasticity is assumed as ‘higher’ elasticity, taking the absolute value.
Ex: |-3| = 3
“Large” Value of Price Elasticity of Demand
Means the quantity demanded changes a lot in response to price change. (If the price changes at all, the quantity demanded will dramatically increase/decrease in comparison.)
“Small” Values of Price Elasticity of Demand
Means the quantity demanded changes very little in response to price change. (If the price changes at all, the quantity demanded will barely increase/decrease in comparison.)
“Elastic” Price Elasticity of Demand
If the PED > 1
This is what occurs with “large” values of PED.
“Inelastic” Price Elasticity of Demand
If the PED < 1
This is what occurs with “small” values of PED.
“Equal” values of Price Elasticity of Demand
Means the quantity demanded changes in the exact same proportion in response to any price change. (If the price changes at all, the quantity demanded will increase/decrease at the same rate in comparison.)
“Unit-Elastic” Price Elasticity of Demand
If the PED = 1
This is what occurs with “equal” values of PED
Percentage Change
The relative change in the quantity over the price, expressed as a percentage.
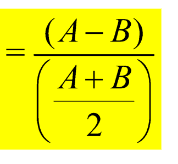
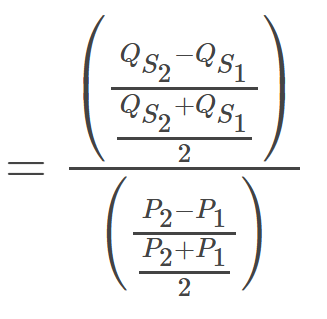
Midpoint Percentage Change Formula
= (Unit of Product A - Unit of Product B) / ((Unit of Product A + Unit of Product B) / 2)
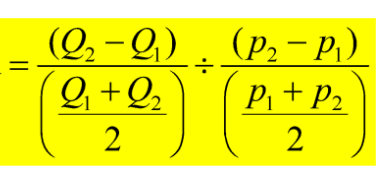
Midpoint Formula for Price Elasticity of Demand
= Quantity Midpoint Percentage Change / Price Midpoint Percentage Change
Perfectly Inelastic Demand
If the PED = 0
The demand curve is completely Vertical.
Means the quantity demanded doesn’t change at all in response to price change. (If the price changes at all, the quantity demanded will remain exactly the same in comparison.)
Perfectly Elastic Demand
If the PED = Infinity
The demand curve is completely Horizontal.
Means the quantity demanded changes infinitely in response to price. (If the price changes at all, the quantity demanded will become zero.)
The Availability of Close Substitutes’s effect on PED
A determinant of the price elasticity of demand.
If a product has more other similar products available, then it will have more elastic demand.
The Passage of Time’s effect on PED
A determinant of the price elasticity of demand.
Overtime, people can adjust their buying habits more easily. Elasticity is higher in the long run than the short run
Whether the good is a luxury of a necessity’s effect on PED
A determinant of the price elasticity of demand.
People are more flexible with more luxury goods than needed goods, so price elasticity of demand is higher for luxuries.
The Definition of the Market’s effect on PED
A determinant of the price elasticity of demand.
The more narrowly defined the market, the more substitutes are available, and hence the more elastic the demand.
The share of a good in a consumer’s budget effect on PED
A determinant of the price elasticity of demand.
If a good is a small portion of a consumer’s budget, then the consumer will not be as sensitive to the price and thus it becomes elastic.
Total Revenue
The total amount of funds a seller receives from selling a
good or service, calculated by multiplying price per unit by the number of units sold
Total Revenue = Price x Quantity
Effect of Cutting Price for Inelastically changing Products
Customers are not very sensitive to the price of your product.
As you decrease the price, you expect to gain few additional customers.
The few additional customers do not compensate for the lost revenue, so overall revenue goes down.
Effect of Cutting Price with Elastically changing Products
Customers are very sensitive to the price of your product.
As you decrease the price, you expect to gain many additional customers.
The many additional customers more than compensate for the lost revenue, so overall revenue goes up.
If demand is elastic, what happens to revenue when price increases?
Revenue decreases, because the decrease in the quantity demanded is proportionally greater than the increase in price.
If demand is elastic, what happens to revenue when price decreases?
Revenue increases, because the increase in the quantity demanded is proportionally greater than the decrease in price.
If demand is inelastic, what happens to revenue when price increases?
Revenue increases, because the decrease in the quantity demanded is proportionally smaller than the increase in price.
If demand is inelastic, what happens to revenue when price decreases?
Revenue decreases, because the increase in the quantity demanded is proportionally smaller than the increase in price.
If demand is unit elastic, what happens to revenue when price increases?
Revenue does not change, because the decrease in quantity demanded is proportionally the same as the increase in price.
If the demand is unit elastic, what happens when the price decreases?
Revenue does not change, because the increase in quantity demanded is proportionally the same as the increase in price.
Relation between Elasticity and Total Revenue
Because Total Revenue = Price * Quantity;
Price Elasticity of Demand = % Change Quantity / % Change Price
If PED>1 then quantity demanded percentage increases faster than price demanded, raising the revenue.
If PED<1 then quantity demanded percentage increases slower than price demanded, decreasing the revenue.
If PED = 1, then quantity demanded percentage changes proportionally than the price, unchanging the revenue.
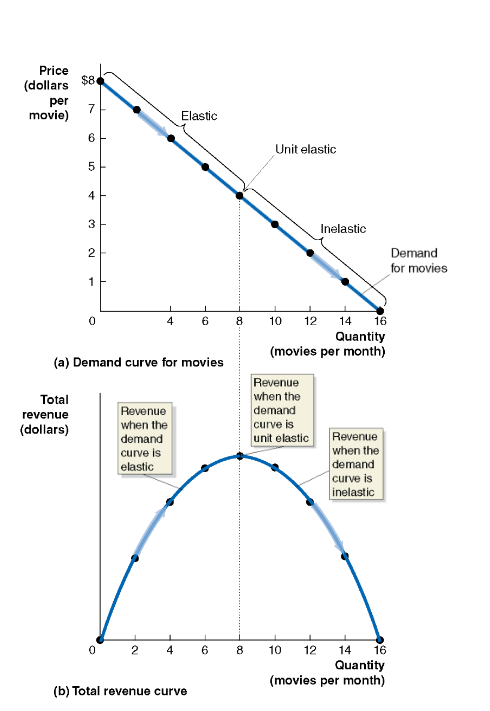
Change of Price of Elasticity along a Demand Curve
Even if the demand curve is linear, the PED can change from being inelastic to elastic. It just depends on where you are along the curve.
Linear Demand Curve vs Total Revenue Curve
One curve represents the quantity demanded in regard to the price, the other curve represents the revenue earned when multiplying the price by the quantity demanded.
Cross-Price Elasticity of Demand
The percentage change in the quantity demanded of one good divided by the percentage change in the price of another good. It measures the strength of a substitute or complement relationship between goods.
Can be negative or positive.
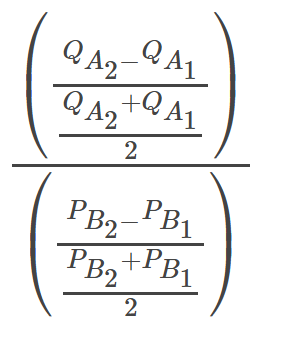
Cross-Price Elasticity of Demand Formula
(Percentage Change in Quantity Demanded of Good A) / (Percentage Change in Price Demanded of Good B)
If Cross-Price Elasticity is positive…
Then the products are substitutes. (Ex: Two brands of smartphones.)
If Cross-Price Elasticity is negative…
Then the products are complements. (Ex: A brand of phones and the apps you can download on them.)
If Cross-Price Elasticity is zero…
Then the products are unrelated. (Ex: A brand of phones and a bag of popcorn.)
Income Elasticity of Demand
A measure of the responsiveness of the quantity demanded to change in income, measured by the percentage change in the quantity demanded divided by the percentage change in income.
Can be positive or negative.
Normal Goods
Goods and services for which the quantity demanded increases as income increases.
Inferior goods
Goods and services for which the quantity demanded falls as income increases.
If the Income Elasticity of Demand is positive but less than 1, then…
The product is normal and a necessity good.
Example: Bread, milk, etc.
If the Income Elasticity of Demand is positive and greater than 1, then…
The product is normal and a luxury good.
Example: Caviar & Wagyu Beef.
If the Income Elasticity of Demand is negative, then…
The product is an inferior good.
Example: Low-quality Ramen.
Price Elasticity of Supply
The responsiveness of the quantity supplied to a
change in price, measured by dividing the percentage change in the quantity supplied of a product by the percentage change in the product’s price.
Midpoint Price Elasticity of Supply Formula
= (Percentage change in Quantity Supplied) / (Percentage change in Price)
The Time Period’s effect on PES
A determinant of the price elasticity of supply.
A firm's ability to respond to a price change depends on how much time they have to alter their production
“Short Period” Time Period effect on PES
It is difficult to change production supply becomes inelastic, and PES < 1.
Example: You can't grow more crops overnight.
“Long Period” Time Period effect on PES
Firms can adjust production, supply becomes more elastic, and PES > 1
Example: You can anticipate planting new fields or build new factories.
Perfectly Inelastic Supply
If the PES = 0
The supply curve is completely vertical.
Means the quantity supplied doesn’t change at all in response to price change. (If the price changes at all, the quantity demanded will remain exactly the same in comparison.)
Example: Fixed number of spaces in a parking lot.
Perfectly Elastic Supply
If the PES = Infinity
The supply curve is completely horizontal.
Means the quantity supplied changes infinitely in response to price. This represents a single producer in a perfectly competitive market (like a single wheat farmer) who must accept the market price.
If the Supply Curve is Inelastic…
Then the PES < 1
Then the quantity supplied cannot change much in response to the demand change, so price will rise a lot.
If the Supply Curve is Elastic…
Then the PES > 1
Then the quantity supplied does change much in response to the demand change, so the price will rise much less in comparison.
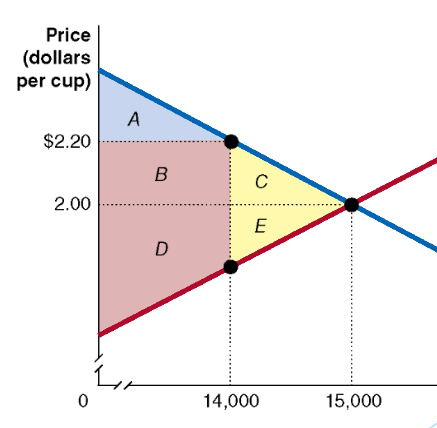
Consumer Surplus
The difference between the highest price a one is willing to pay for a good or service vs the actual price that is paid.
Producer Surplus
The difference between the lowest price a firm would be willing to accept for a good or service vs the price it actually receives.
Marginal Benefit
An item in the marginal analysis of the demand curve. The additional gain/benefit to a consumer from consuming one more unit of a good or service.
Calculating Consumer Surplus
Calculated through the area below the demand curve, above the market price.
In a market it is also equal to the total benefit received by consumers minus the total amount they must pay to buy the good or
service
Marginal Cost
An item calculated in marginal analysis of the supply curve. The additional cost to a firm of producing one more unit of a good or service.
Calculating Producer Surplus
Calculated by the total area above the supply curve, below the market price.
In a market it is equal to the total amount firms receive from consumers minus the cost of providing the good or service.
What does Consumer Surplus Measure?
Measures the net benefit to consumers from participating in a
market.
What does Producer Surplus Measure?
Measures the net benefit received by producers from participating in a market.
Two ways to view efficiency in a market:
This market condition is true if all trades take place where the marginal benefit equals (or exceeds) the marginal cost, and no other trades take place.
This market condition is true if it maximizes the sum of consumer and producer surplus (i.e. the total net benefit to consumers and firms), known as the economic surplus.
What is the problem if the quantity produced is "too low” (underproduction)?
It is inefficient because: Marginal Benefit > Marginal Cost
(MB > MC)
The value consumers place on the next unit is higher than the cost to make it. Society should be producing more.
What is the problem if the quantity produced is "too high" (overproduction)?
It is inefficient because: Marginal Cost > Marginal Benefit
(MC > MB)
The cost to produce the last unit is higher than the value consumers place on it. Society is wasting resources and should produce less.
Economic Surplus
The total net benefit to society from the market, summing the surplus for buyers and sellers.
= Consumer Surplus + Producer Surplus
How does “Economic Surplus” define Economic Efficiency?
An outcome is economically efficient when the Economic Surplus (CS + PS) is maximized.
This only happens at the competitive equilibrium (where supply = demand), which is the same point where Marginal Benefit = Marginal Cost.
Economic Efficiency
A market outcome in which the marginal benefit to consumers of the last unit produced is equal to its marginal cost of production and in which the sum of consumer surplus and producer surplus is at a maximum.
There is no waste in the economy.
Deadweight Loss
The reduction in economic surplus resulting from a market not being in competitive equilibrium. It can be thought of as an inefficiency in the market. In competitive equilibrium, the value of this is 0.
Taxes
A government intervention in the market by which they take a small portion of the money from goods, services, income, and others.
Tax Incidence
The division of the burden of a tax between buyers and sellers. Either the buyer has the full burden of the tax, the seller has the full burden of the tax, or both share the burden of the taxation.
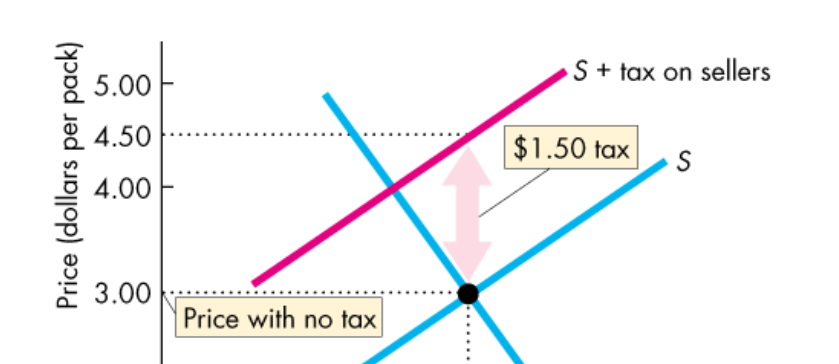
Who has to pay the tax when prices rise by the full amount?
The buyer pays the tax.
Who has to pay the tax when prices rise by a lesser amount than the tax?
Both the buyer and seller share the burden of the tax.
Who has to pay the tax when the prices don’t rise at all?
The seller pays the tax.
Perfectly Inelastic Demand’s effect on Tax Incidence
At this elasticity of demand, buyers must pay the full tax.
Perfectly Elastic Demand’s effect on Tax Incidence
At this elasticity of demand, sellers must pay the full tax.
Overall Elasticity of Demand’s effect on Tax Incidence
The more elastic the demand, the larger is the supplier’ share of the tax.
The more inelastic the demand, the larger is the buyers’ share of the tax.
Perfectly Inelastic Supply’s effect on Tax Incidence
At this elasticity of supply, sellers must pay the full tax.
Perfectly Elastic Supply’s effect on Tax Incidence
At this elasticity of supply, buyers must pay the full tax.
Overall Elastic Supply’s effect on Tax Incidence
The more elastic the supply, the larger is the buyers’ share of the tax.
The more inelastic the supply, the larger is the supplier’ share of the tax
Price Control
Attempts by the government to control the price of an activity.
Price Ceiling
A form of price control, a regulation that makes it illegal to charge a price higher than a specified level.
Price Ceiling effects on above/below the equilibrium
Above equilibrium? Price control has no effect. The market works as if there is no price control.
Below equilibrium? Causes a shortage in the market, with the quantity supplied decreased while the quantity demanded increases. In addition, it can lead to increased search activity for more of the product and black markets being formed.
Search Activity
In times of a shortage, this type increases. This is the time spent looking for someone to do business with for a specific product that is highly demanded. This is highly costly.
The cost of the good or service equals not only to the value, but also the opportunity cost of the search activity.
Black Market
Occurs in a shortage and is an illegal market that operates alongside a legal market in which a price ceiling or other restrictions have been imposed. In this market, these regulations are ignored, and prices are set to whatever they would be in an unregulated market.
Why are Price Ceilings inefficient?
When this regulation is set below the equilibrium cost, it leads to an inefficient underproduction to meet the demand. The marginal social benefit from the good or service exceeds its marginal social cost and a deadweight loss arises.
Price Floor
A form of price control, a regulation that makes it illegal to trade at a price lower than a specified level.
Price Floors effects on above/below the equilibrium
Below equilibrium? Price control has no effect. The market works as if there is no price control.
Above equilibrium? Causes a surplus in the market of a supply that exceeds the quantity demanded. This can lead to goods going unused completely. In addition, it can lead to increased search activity for cheaper products and black markets being formed.
Why are Price Floors inefficient?
When this regulation is set above the equilibrium cost, it leads to an overproduction with underconsumption. The marginal social benefit from the good or service exceeds its marginal social cost and a deadweight loss arises.
International Trade
The trade between countries using imports and exports, involving everything from shipping, transportation, and communication.
Tariff
A tax imposed by a government on imports. Traditionally, countries imposed these high taxes on imports, believing that such measures would make their own firms and consumers better off, but generally it meant that the exports were similarly taxed.
Improts
Goods & services bought domestically, but produced in other countries.
Exports
Goods & Services produced domestically, but sold in other countries
Comparative Advantage
Arises from having a lower opportunity cost than the competitors, with opportunity costs being highest-valued alternatives that must be given to engage in an activity
Absolute Advantage
The ability of an individual, a firm, or a country to produce MORE of a good or service than competitors, using the same amount of resources.
Comparative Advantage and International Trade
In regard to international trade, comparative advantage allows trade to be advantageous for both countries, regardless of if a country has absolute advantage in multiple products.
Autarky
A situation in which a country does not trade with other countries.
How can Countries gain from International Trade?
If countries do not trade, they consume whatever they produce. But at different opportunity costs, each country might be willing to trade some of what they have a comparative advantage at produce for what the other country has a comparative advantage of producing. Both countries might be better off due to this trade.
Specialization In Comparative Advantage
A situation in which a country solely produces a product that they have comparative advantage in compared to other countries.
Ex.) China overall produces less smartphones than the US, with 1000 smartphones in comparison to the United States’ 1500 smartphones.
But they also produce a smart phone for every 0.5 bushels of wheat in comparison to the USA’s smart phone for every 2 bushels of wheat, so they specialize solely in making the cell phones.
Terms of Trade
The ratio by which a country can trade its exports for imports from other countries. A country would not accept if this trade is worse than the opportunity cost, in which it would be better off producing the goods it was importing.
Gains from International Trade
Calculated from the difference between the Total Surplus of a specific good of a country under autarky and the Total Surplus of a specific good of a country with trade.
Total Surplus w/ trade - Total Surplus w/o trade
Why don’t we see complete specialization of a product for any country?
In the real world, products are generally not produced by only one nation.
- Not all goods can be traded internationally.
- Production of many goods involved increases
- Tastes for products differ (cars, for example)
- Countries might have comparative advantages in different sub-types of products