Estimating Uncertainty
1/22
There's no tags or description
Looks like no tags are added yet.
Name | Mastery | Learn | Test | Matching | Spaced | Call with Kai |
|---|
No analytics yet
Send a link to your students to track their progress
23 Terms
Descriptive sample measured on a sample purpose
Used to estimate population parameters
-random sample allows for estimation
-equal chance of being selected
-individuals sampled independently
Purpose of sample mean ( M or x̅ )
estimate the true population mean ( μ )
Purpose of sample portion ( p̂ )
used to estimate population proportion (p)
Precision of the population estimation
Allows to quantify how useful the estimation is (how far the estimate is likely to be from the target parameter being estimated)
High percision
Low uncertainty (reasonable confidence that the estimated is close to the target parameter)
Low percision
High uncertainty (estimate is not close to target parameter)
-need more data to reduce uncertainty
-sampling error
Estimation
inferring a population parameter from sample data
-sampling is influenced by chance making the estimated value never exactly the same as the value of the population parameter
Sampling distribution of the estimate
the probability distribution of all the values for an estimate that we might have obtained when we sampled the population
Frequency distribution of random sample is an exact replica of the pop distribution?
The frequency distribution of the random sample is not exact replica because of chance
-sampling process is influenced by chance/randomness
-causes the sample estimates of the mean or standard deviation to be different
Sampling Distribution
The distribution of sample means. When you randomly select from a population, each new sample will generate a different estimate of the population
-represents the population of values for an estimate but it is not a real population
Central Limit Theorem
For any population with mean μ and standard deviation σ, the distribution of sample means for sample size n will have a mean of μ and a standard deviation of σ/√n and will approach a normal distribution as n approaches infinity
-the sampling distribution of the mean will always be normally distributed, as long as the sample size is large enough
Mean of sampling distribution
The population mean ( μ ) is constant but the estimate ( x̅ ) is a variable
-Means that ( x̅ ) is an unbiased estimate of ( μ )
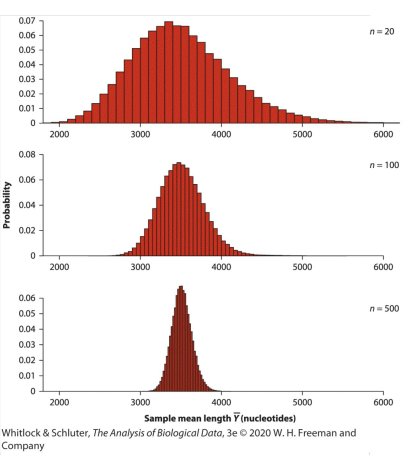
Variability of the Distribution of Sample Means
Spread of sampling distribution of an estimate depends on the sample size
-Large sample size = narrower sampling distribution = more precise estimate
What is the standard deviation of sampling distribution called?
Standard error ( SE ), or standard error of the mean ( SEM )
-shows the differences between an estimate and the target parameter = reflects estimate precision
-Smaller SE = high precision = low uncertainty about the target parameter
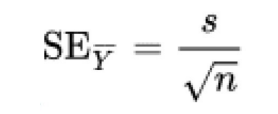
How to calculate standard error of the mean ( σx̅ )
( σ / √n )
-Sample size increases = standard error σx̅ decreases
Because we almost never know the value of the population standard deviation (σ), we can use standard deviation (s) instead as an estimate for a new formula
( s / √n )
Confidence Intervals (CI)
Way to quantify uncertainty about the value of a parameter
-range of numbers, from the data, that is likely to contain the unknown value of the target parameter
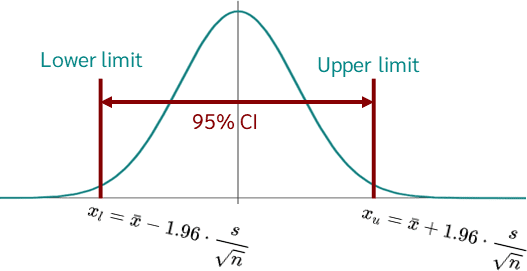
95% Confidence Interval (CI)
A range likely to contain the value of the true population mean ( μ )
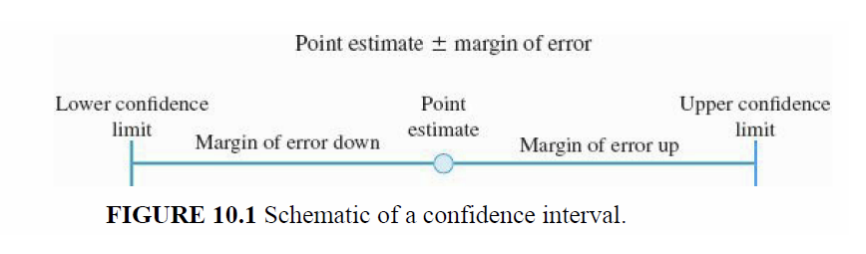
Point Estimate
A single estimate of the parameter provided by the sample mean
-Standard error of the mean is a margin of error
-Confidence interval we compute is called the interval estimate
Most plausible values for the parameter are found?
The upper and lower bounds of the CI
-the width of the 95% CI is a good measure for our uncertainty about the true value of the parameter
-values outside the CI are less plausible with high uncertainty
2Se rule of thumb
approximation of the 95% CI for the population mean
-obtained by adding & subtracting 2 standard errors ( σx̅ ) from the sample mean
Error Bars
Illustrates standard errors ( σx̅ ) or confidence intervals for the mean, or even the standard deviation
-Don't always show the same measure of precision
Reporting Variability Standard Deviation ( X) Descriptive Statistic
Use the Standard Deviation (SD) when you want to describe the variability within your sample
-Large SD means data points are spread out
-Smaller SD means data points are closer to the mean
-Standard deviation tells how far the scores typically deviated from the mean
Reporting Variability of the Standard Error (M) Inferential Statistic
Use the standard error when you want to estimate how well your sample mean approximates the true population mean
-smaller SE means more precise estimate of the population mean
-large se means less precision
-A SE of __ means the sample mean would vary about __ points on average from the true pop mean