EC330 AT W3: Climate change damages
1/30
There's no tags or description
Looks like no tags are added yet.
Name | Mastery | Learn | Test | Matching | Spaced |
|---|
No study sessions yet.
31 Terms
Challenges in measuring climate change damages
Projected changes are historically unprecedented (not known before)
require new approaches for assessment, as existing models may not accurately capture the complex interactions and long-term impacts.
Non-linear responses
Interactions of sectoral impacts
different range of outcomes
Spatial spillovers
effects of climate change in one location may propagate to another
Measurement issues
Non-linear responses
Economic activities like labor productivity, crop yields, and labor supply react non-linearly to temperature.
This means small temperature increases can lead to disproportionately large impacts once certain thresholds (e.g., 20–30°C) are crossed.
To "really capture the effect," it's essential to use temperature distributions rather than just averages. Otherwise, we risk underestimating the real economic impacts of climate change.
average temperature data hides extreme heat days, which are the ones that really cause damage.
What are the approaches to capturing non-linear effects?
Outcome specific approaches
When to use: If we have good knowledge of how a certain process (e.g. crop growth) reacts to temperature.
Thresholds: Use known temperature thresholds where performance switches from beneficial to harmful (e.g., crops grow well below 29°C but yields drop sharply above that).
Non-parametric methods
more flexible as it avoids restrictive functional forms (e.g., assuming the effect of temperature is always linear or quadratic).
How it works: Instead of modeling a single threshold, it groups temperature data into bins (ranges, like 25–27°C, 27–29°C) and looks at outcomes in each.
What are the different range of outcomes of temperature extremes?
GDP growth
Health and mortality
Labour supply and productivity
etc..
Why might the range of outcomes pose challenges for estimating climate change damages?
Hard to aggregate across outcomes
Different outcomes have different units and impacts
crop yield loss vs increased mortality
Interaction of effects
lower crop yields can worsen health through malnutrition
may cause double counting
Not specific
damages are hard to define precisely
Not evenly distributed
impacts vary by region, sector and socioeconomic group
some groups may be far more vulnerable than others
Non-linear damages
small change in temperature can cause big, unpredictable effects
making it hard to predict with simple averages
What may cause spatial spillovers?
Ecosystem interactions
deforestation leads to soil erosion, loss of biodiversity etc
Human activity
our interconnected world means that changes in one location can ripple through economic, social and physical systems
ie: migration, trade and production networks can connect human activity and amplify the effects
Types of data
Weather station data
raw data from ground stations
Gridded data
statistical interpolation of station data
Satellite data
Reanalysis data
station/satellite data run through a climate model
Advantages of weather station data
locally accurate
can generate a long time series, provides detailed observations of climatic conditions and trends over time.
Disadvantage of weather station data
limited or changing coverage
non-random station locations
tends to be clustered in populated areas or richer countries, causing bias
Advantages of gridded data
more complete spatial coverage than weather stations
useful for creating a balanced panel
Challenges of gridded data
Interpolation techniques vary, leading to uncertainty
Sparse inputs lead to inaccurate outputs
especially in regions with few stations
Advantages of satellite data
High spatial resolution
detailed coverage across globe, even remote areas
Disadvantages of satellite data
relatively recent
limited historical depth
cloud cover issues
can obscure images, making it hard to detect floods
will have data gaps
Advantages of reanalysis data
more complete
combines satellite and model data for global consistency
Disadvantage of reanalysis data
relies on assumptions and parameters used in model
may not fully reflect reality
What is mortality displacement?
occurs when extreme events (like heatwaves) cause deaths to occur earlier than they would have, leading to a temporary spike followed by a dip in mortality.
total deaths over months/years
Integrated assessment models
a tool for assessing potential policy responses to climate change
Steps of building integrated assessment model
Model projecting GHG emissions
Model mapping GHG emissions into climate change
Damage function estimating economic costs of climate change
Social welfare function for aggregating damages over time
Cost benefit analysis
aims to assess the desirability of an action by comparing the benefits and costs of the action in a common unit of account
uses expected utility theory
weighs outcomes by their probability
Why do we need to use a discount factor in conducting the cost benefit analysis?
costs and benefits often occur at various points in time
carbon abatement has costs today, benefits are far in the future
so, discount factor is used to express a future cost or benefit as an equivalent current cost or benefit
Challenges with implementing cost benefit analysis
potentially large range of costs and benefits
difficulties in measuring costs and benefits
choice of discount rate?
an outcome of NPV>0 may have undesirable effect on inequality
benefits may be non-market
flow of costs and benefits may be uncertain
how to account for possibility of extreme effects?
how to account for possibility of irreversible outcomes?
there is a long timeframe, leading to intergenerational tradeoffs
how do we account for new abatement technologies?
Why might a social discount rate < market rate be appropirate?
accounts for ethical considerations and intergenerational equity.
should not include risk premium
reflecting pure time preference, not risk.
not relevant in considering a society-wide long-term impacts like climate change
evidence behaviour is consistent with hyperbolic discounting
tend to discount the near future more steeply than the distant future
long-run damages should be discounted less heavily over time.
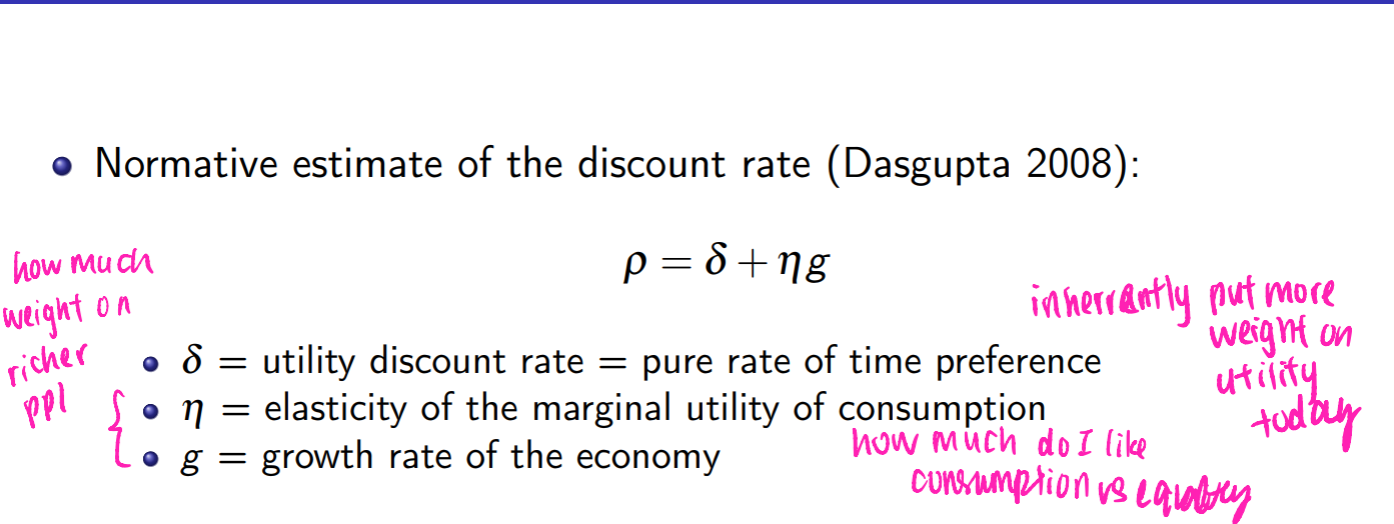
Normative estimate of discount rate
δ captures preference for today’s generation relative to next generation
ng captures the fact that future generations will be wealthier
gains to wealthier people should count less than gains to poorer people
future < current
the discount rate also reflects the value of incremental future consumption may depend on whether future generations are wealthier than the current generation
δ, pure rate of time preference
measures amount by which utility of a future generation discounted in welfare calculations relative to utility of current generation
Explain the economic and philosophical debate on choice of δ
δ =0
current and future generation should be weighted equally, only ethically justifiable choice
(Stern)
δ >0
preference for present over future utility that individuals exhibit in savings and investment behaviour
n, elasticity of marginal utility of consumption
n=0
MU of dollar of consumption is constant as income increases
n=1
1% rise in income reduces MU of consumption by 1%
it reflects the society’s aversion to consumption inequality
if higher, that means you really want redistribution to transfer income from rich to poor
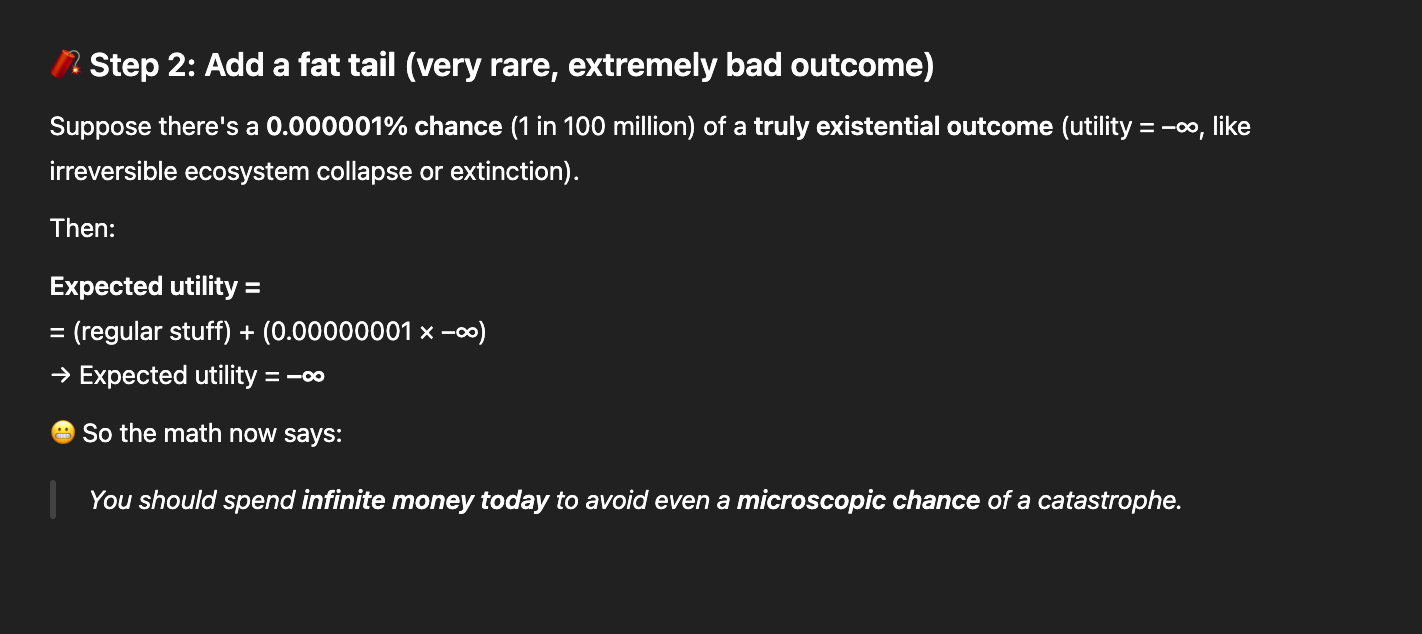
Dismal Theorem
under certain conditions regarding uncertainty and preferences, society has an indefinitely large expected loss from high-impact, low probability events.
implies that CBA will be very misleading in the presence of catastrophic outcomes with small, uncertain probabilities
expected utility theory doesn’t work well — because the rare disasters (low probability) overshadow everything else, making decisions hyper-sensitive or even mathematically undefined..
Weitzman’s argument
Even if traditional models don’t justify strong climate action (e.g. through optimal consumption smoothing), we should still act early because there's a small but real chance of catastrophic outcomes — and these low-probability, high-impact events are not handled well by standard economic tools.
Nordhaus vs Stern
Nordhaus chooses δ and n that reflects a higher preference for present utility
should be consistent with observed real interest and saving rates rather than normatively acceptable parameters.
Stern chooses δ close to zero
based on ethical arguments
>0 only to account for possibility of exogenous extinction of humanity
Stern chooses n = 1
If someone’s consumption doubles (from
cto2c), then an extra dollar of consumption is half as valuable.So, we value extra consumption less the richer someone is.
shows some preference for equality
Nordhaus wrinkle experiment
If you use a very low (or zero) discount rate, you place almost equal weight on all future generations — even those 10,000 years from now.
willing to spend a massive amount today to prevent a tiny inconvenience in the distant future
can be politically and economically unrealistic.
Hence, the experiment highlights how using a low discount rate can lead to inflated present value estimates of future benefits and costs.
Stern’s response to Nordhaus’ argument
Social Rate of Return is not equal to Private Rate of Return, especially for climate change
choice of market rate is depended on the type of assets invested in
long run lending rates on gov bonds is 1.5%
private long run rates of return on equities is 6-7%
social discount rate may fall over time
environmental services are income elastic
As societies become wealthier, clean air, biodiversity, and climate stability become more highly valued.
We’re willing to pay more for environmental goods as incomes rise.
price of environmental goods may increase with scarcity over time
If something is more valuable in the future, we should discount it less today to reflect the increased importance to future generations