Keynesian Economics: Concepts and Equilibrium Analysis
1/78
There's no tags or description
Looks like no tags are added yet.
Name | Mastery | Learn | Test | Matching | Spaced | Call with Kai |
|---|
No analytics yet
Send a link to your students to track their progress
79 Terms
Keynesian Cross
A model showing where total spending equals total output (GDP) at a given price level.
Disposable income
Income (Y) - Taxes (T)
Marginal Propensity to Consume (MPC)
The fraction of extra income that people spend instead of save.
Example: You get $100 more and spend $80
Consumption function shifts
Changes in disposable income, consumer expectations, wealth, taxes.
Equilibrium spending formula
Y = C(Y) + I + G + (X-IM)
Output = Consumption(Income) + Investment + Government Spending + (Exports - Imports)
When total spending > output produced
Inventories fall, firms increase production
When total spending < output produced
Inventories rise, firms cut production
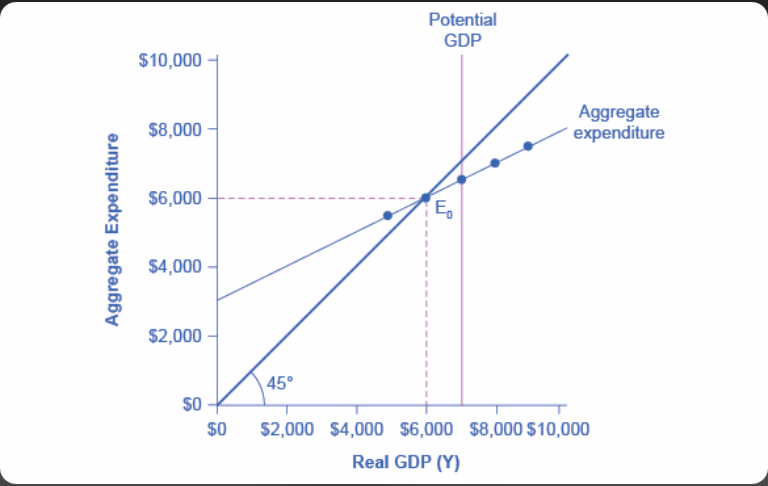
45° line in income-expenditure diagram
Line of points where the total income = total spending.
Expenditure schedule
The relationship between total spending and national income.
Equilibrium income determination
Point at the intersection of the 45° line and expenditure schedule.
Aggregate Demand (AD)
The relationship between the price level and the quantity of real GDP demanded.
Consumption when prices rise
Decreases due to erosion of purchasing power.
Consumption when prices fall
Increases due to enhanced purchasing power.
Downward shift of the consumption function
What do higher prices cause
Upward shift of the consumption function
Lower prices.
Higher price level effect on aggregate output demanded
Reduces it.
The effect of a lower price level on the aggregate output demanded
Increases it.
AD curve shifts
Changes in consumption, investment, government spending, and net exports.
Potential GDP
The level of output when resources are fully employed.
Full employment
When unemployment is at its natural rate (no cyclical unemployment).
Negative output gap
When actual GDP < potential GDP.
Positive output gap
When actual GDP > potential GDP.
Recessionary gap causes
Low spending, weak demand, high prices, low wealth.
Inflationary gap causes
High spending, strong demand, asset booms.
Natural closure of recessionary gap
Falling prices increase purchasing power and spending.
Natural closure of inflationary gap
Rising prices reduce purchasing power and spending.
Spending multiplier formula
1 / (1 - MPC)
Multiplier greater than 1 reason
Because each round of spending generates more income and spending.
Relationship between saving (S) and investment (I) at full employment
At full employment, total savings in the economy always equals total investment.
S = I when the economy is using all its resources efficiently.
If S > I
Recessionary gap.
If I > S
Inflationary gap.
Common reasons S > I
Credit crunch, low investment incentives, bank failures.
Government action to close recessionary gap
Increase public spending, cut taxes, boost investment.
Natural adjustment of the economy
Movements in wealth, prices, or exchange rates correcting output gaps.
Prevention of natural adjustment
Financial crises, misaligned expectations, market failures.
Role of expectations in investment and consumption
Positive expectations boost spending; negative expectations reduce it.
Exchange rate depreciation effect on NX
Makes exports cheaper, imports more expensive — raises NX.
Exchange rate appreciation effect on NX
Makes exports more expensive, imports cheaper — lowers NX.
Stock market boom effect on consumption
Increases wealth and boosts consumption.
Spending multiplier when MPC = 0.8
5
Spending multiplier when MPC = 0.75
4
MPC calculation
Δ Consumption / Δ Disposable Income
Marginal Propensity to Save calculation
1 - MPC
Relation between Marginal Propensity to Save and the multiplier
1 / MPS
Effect of increasing MPC on the multiplier
It gets larger.
Effect of decreasing MPC on the multiplier
It gets smaller.
Effect of taxes on the spending multiplier
Taxes reduce disposable income, thus lowering the multiplier effect.
GDP increase from initial spending of $100 million with multiplier 4
$400 million.
Spending multiplier when MPC = 0.6
2
Effect of increase in investment on AD curve
Shifts AD rightward (horizontal shift at each price level).
Effect of fall in net exports on AD curve
Shifts AD leftward.
Government spending needed for recessionary gap of $500 billion with multiplier 5
$100 billion.
GDP gap formula
Potential GDP - Actual GDP
Effect of increase in taxes on expenditure schedule
Downward.
Effect of decrease in taxes on expenditure schedule
Upward.
Effect of wealth increase on consumption function
It shifts upward.
Effect of rising interest rates on investment spending
It falls.
Effect of weakening foreign demand on net exports
NX falls, shifting AD left.
MPC when consumers save 30% of new income
0
GDP increase when MPC = 0.9 and initial spending is $50 million
$500 million (Multiplier = 10)
Spending increase needed for GDP shortfall of $1 trillion with multiplier 2.5
$400 billion.
Effect of sharp price rise on AD
Quantity of output demanded falls along the AD curve.
Effect of government cutting taxes on AD
AD shifts to the right.
Effect of stock market crash on AD
AD shifts to the left.
Effect of rising consumer wealth on equilibrium GDP
It rises.
Effect of investment boom on multiplier effect
GDP increases more than the initial investment.
Effect of rising foreign prices on net exports
Increases exports, improving NX.
Effect of rising interest rates on AD curve
Leftward shift (lower investment).
Lines drawn in the Keynesian Cross diagram
45° line and expenditure schedule.
Equilibrium GDP on income-expenditure graph
Where expenditure schedule intersects 45° line.
What shifts the expenditure schedule upward
Increases in C, I, G, NX.
What shifts the expenditure schedule downward
Decreases in C, I, G, NX.
Why does the Aggregate Demand (AD) curve slope downward?
Higher prices reduce real wealth and consumption.
X-axis of the AD curve diagram
Real GDP (Quantity of Output).
Y-axis of the AD curve diagram
Price Level.
Recessionary gap shown on a graph
Actual GDP to the left of Potential GDP.
Inflationary gap shown on a graph
Actual GDP to the right of Potential GDP.
Effect on AD curve if investment falls
It shifts left.
Marginal Propensity to Save (MPS)
Fraction of extra income that people save instead of spend