2.5.2 Output gaps
1/5
There's no tags or description
Looks like no tags are added yet.
Name | Mastery | Learn | Test | Matching | Spaced |
|---|
No study sessions yet.
6 Terms
ACTUAL GROWTH RATES
Actual growth is actual change (i.e. change in real GDP) over time and its changes are what make up the business cycle
LONG TERM TRENDS
long run trend rate of growth is average sustainable rate of economic growth over a period of time
OUTPUT GAP
diff between actual level of GDP and estimated long-term value for GDP
shown on the trade cycle diagram which demonstrates how actual GDP is not always on trend
POSITIVE AND NEGATIVE OUTPUT GAP
pos- when GDP is higher than estimated
neg- when GDP is lower than estimated
w/ a neg output gap, theres spare capacity in economy with factories, offices and workers not being utilised to produce g and s
MEASURING OUTPUT GAP
very difficult to measure, bc exact position of LRAS is unknown and initial estimates of real GDP are often inaccurate
some believe they’re so difficult to measure that they’re not a valid concept to use from the purpose of economic policy
not possible to measure the productive potential of an economy as there is no single monetary value for the level of variables such as machinery, workers and tech
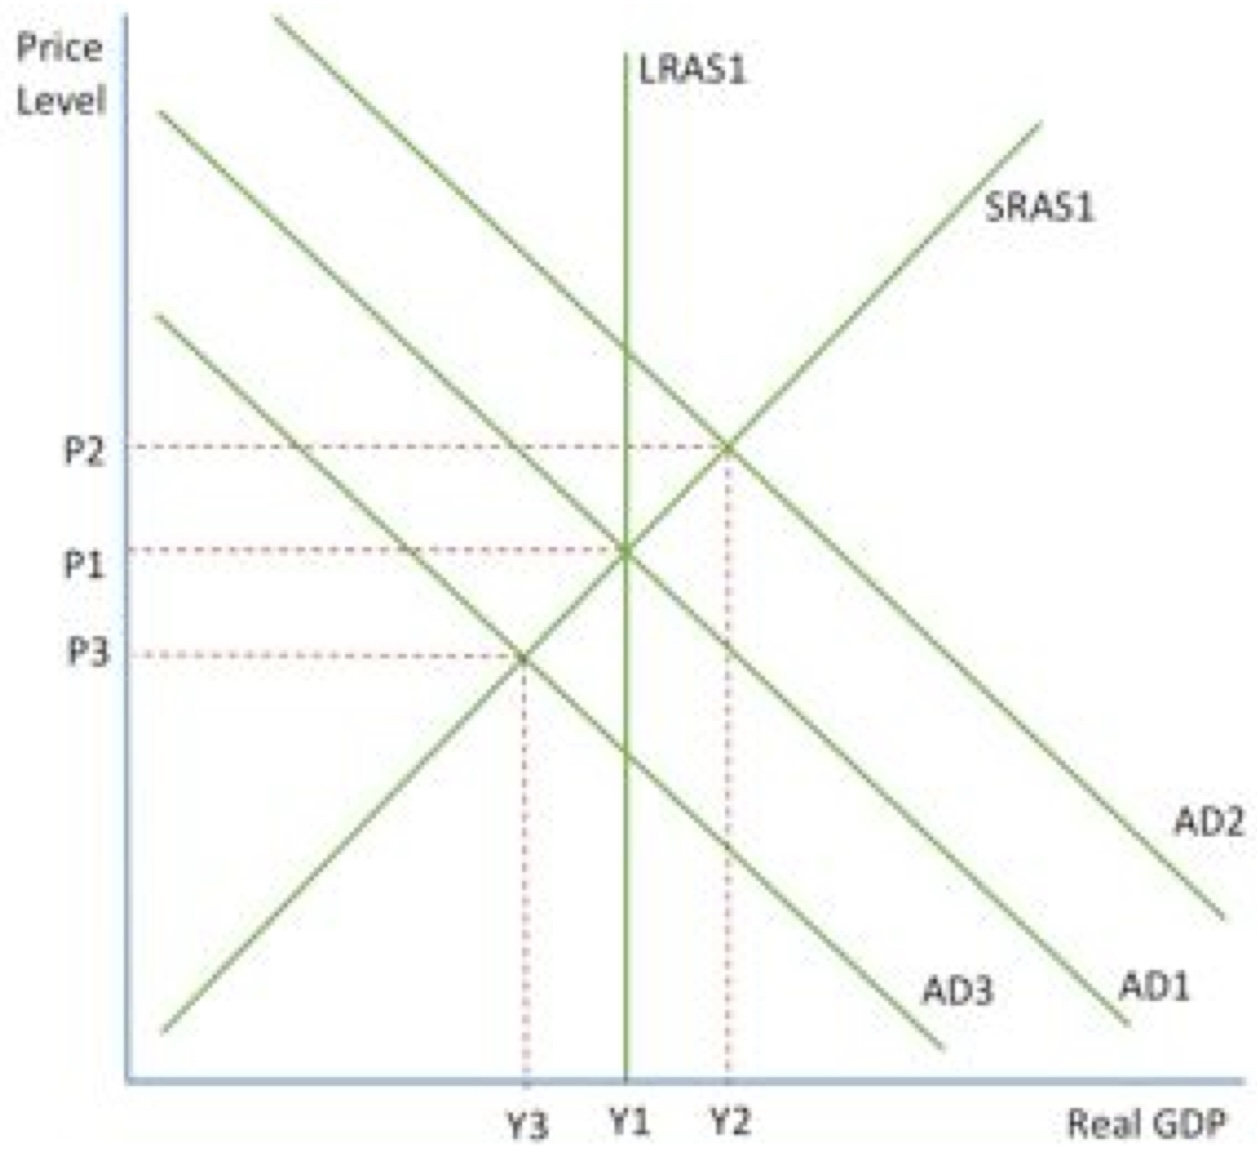
OUTPUT GAP- AD/AS DIAGRAM
LRAS shows full capacity output
An equilibrium to the right of the LRAS shows the economy working over capacity (pos) in the short term but to the left it shows the economy working under capacity (neg)
classical economists would argue that a pos output gap would be filled by long-run EG moving LRAS curve, a recession which would decrease AD or a rise in the costs of production which would decrease SRAS- opposite for neg