DNA Profiling I
1/58
There's no tags or description
Looks like no tags are added yet.
Name | Mastery | Learn | Test | Matching | Spaced |
|---|
No study sessions yet.
59 Terms
Reasons for human identity testing
Forensic cases
Paternity testing
Identifying people from remains in mass disasters and human investigations
Missing persons investigations
Military DNA - all soldiers have DNA taken and sequenced as a ‘dog tag’
Convicted felon DNA databases
Sources of human DNA
Body fluids e.g. blood, semen, urine, saliva, faeces
Tissues e.g. skin, hair, bone
Fingerprints
Used chewing gum
Cigarette butt
Weapons
Bite marks
Used tissue
Aim of forensic profile
Unique profile that links a person to a crime or relative unambiguously
DNA polymorphisms allow generation of profile
Everyone has different numbers of the repeated sequences
Short tandem repeats (STRs)
Known as microsatellites
Repeating units of 1-7 bases
5-100 repeats at each satellite
The core unit ranges from 2-6 bp
Scattered through the genome
For forensic profiling, tetra (4) and penta (5) are used
2 STR
Dinucleotide
3 STR
Trinucleotide
4 STR
Tetranucleotide
5
Pentanucleotide
6
Hexanucleotide
What four repeats are used for DNA profiling?
TPOX - simple repeat
THO1 - simple repeat
D12S391 - compound repeat
VWA - compound repeat
TPOX
Human thyroid peroxidase gene
Chromosome 2
Intron 10
Simple repeat
Repeating unit is [AATG]
TPOX8
[AATG][AATG][AATG][AATG][AATG][AATG][AATG][AATG]
Repeating unit is repeated 8 times
THO1
Human tyrosine hydroxylase gene
Chromosome 11
Intron 1
Simple repeats with non-consensus alleles
THO1 repeat [AATG]
THO19.3
[AATG]6ATG[AATG]3
THO19.3 has one incomplete repeat with three nucleotides
D12S391
Chromosome 12
Compound repeats
Two or more adjacent simple reads
Repeating units [AGAT][AGAC]
[AGAT] 8 to 17 in a row [AGAC] 6 to 10 in a row [AGAT] 0 to 1 in a row
D12S39115
[AGAT]8[AGAC]6[AGAT]
VWA
Human von Willebrand factor
Chromosome 12
Intron 40
Compound repeat with non-consensus alleles
Repeating unit [TCTA][TCTG]
VWA16 and VWA16.2
VWA16 [TCTA]2[TCTG]4[TCTA]19
VWA16.2 [TCTA]2[TCTG]4TA[TCTA]10
There are two repeating units
In certain groups of people, after the first two repeats, there is ‘TA’ and then the next set of repeats
16 is the full repeats and .2 denotes the two extra bases
Complex repeats
When picking repeats for analysis, one complex repeat (always VWA) and THO1 will be used
Mixture of simple and non-repeats
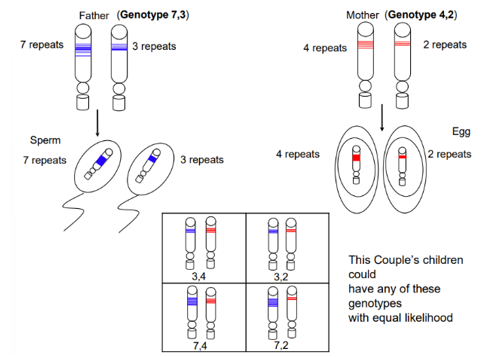
Genotype
If the father has 7 repeats in one chromosome and 3 repeats in the other, it will be inherited by the sperm whose genotype will be 7,3
If the mother has 4 repeats in one chromosome and 2 repeats in the other, it will be inherited by the egg whose genotype will be 4,2
The children of this couple will then have equal likelihood to have a genotype with any combination of these repeats
PCR amplification of STR alleles
On the graph, smaller fragments are first and then larger fragments
Two peaks - heterozygotes (alleles different)
One peak - homozygotes (alleles same length)
Introduced in 1994 with 4 sites (QUAD)
SGM
1995
6 sites
1 in 50 million discriminating power
QUAD
1994
4 sites
1 in 10,000 discriminating power
SGM+
1999
10 sites
1 in 1000 million (1 billion) discriminating power
In 1999, introduction of low copy number (LCN)
DNA-17
2014
17 sites
1 in 1000 million (1 billion) discriminating power
Discriminating power legal requirements
Legally, can’t say there is more than 1 in a billion chance
Unless entire population has been sequenced, can’t be certain
This is why SGM+ and DNA-17 have the same result
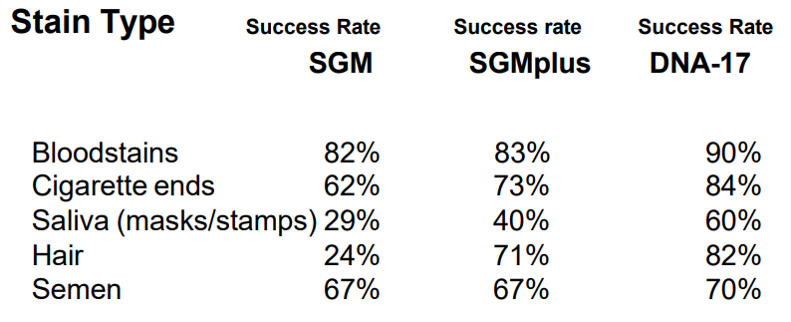
Stain type
STR fragment analysis
STR fragments can be told apart by putting fluorescent dye on the forward primer
Attach the primer via linker onto the DNA base on the forward primer
The succinimidyl ester reacts rapidly with amine linkers on DNA bases
Dyes - blue, green, yellow, red
By running it on a DNA sequencing machine, it shines the appropriate laser at the appropriate wavelength so they can tell them apart

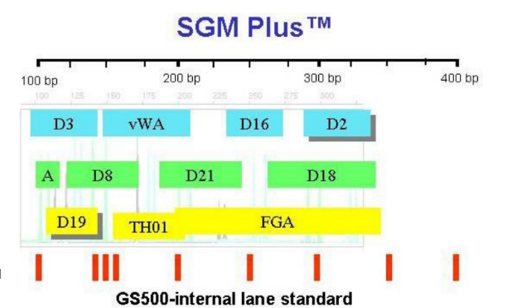
SGM plus TM
When D3 is amplified up, the individuals with D3 will have amplicon sizes between 80 - 135 bp, labelled blue
D8 - STR’s amplified in that region will be between 115 - 175 bp, but this falls in the size range of D3, so they’re labelled green
D19 sits within D3 and D8 range so it’s yellow
A is always amplified up
To know how big the fragments are, use a marker/ladder made of DNA fragments
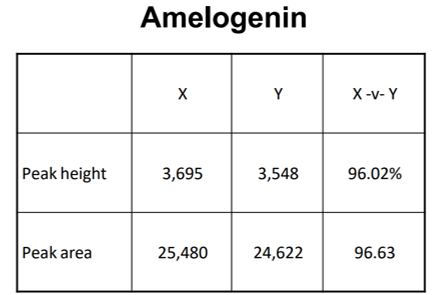
A
Amylogenic
Sex-determining amplicon
X - amplifies at 106 bp
Y - amplifies at 112 bp
DNA-17 kit
Similar to SGM+ STRs
Has a few extra STRs
Bigger kits need to use red so often another colour is used for the ladder
STR typing steps
Native acrylamide is used
Flush out the capillaries to clear it from previous samples
Load plate into machine 8 samples at a time
Capillary electrophoeresis
As it passes down, there is a window where a laser divides it into colours with a prism to then detect the colour and allow sample detection and interpretation
The machine and capillary site are slightly outside the box first
The capillaries can’t be dipped in so as it loads new samples - it moves across the first row and applies and a positive charge which moves the sample up into the capillaries (reducing contamination)
Native acrylamide
Doesn’t denature
Allows analysis of small differences in DNA size
Capillary electrophoersis
Runs on a thin wire
Filled with acrylamide
Takes PCR samples to inject into capillary
Detection platforms for STR typing
Beckman CEQ 8000 capillary electrophoresis
ABI 3730xl DNA analyser (best type)
Beckman EQ 2000XL CE-based DNA sequencing system
CEQ sample preparation
Sample plate is a 96 well plate
Into each well, add a sample and the buffer with the size marker
Add 0.5µl PCR reaction into the well
Load up the plate and run on CEQ
CEQ8000 collection software
Samples run on one gel
The machine run and data collection are controlled by one array
Analysis is done with one software
One array controls the injection of the samples and electrophoresis conditions
it then creates a file with the data collected from the CCD
Software processes the raw data
Matrix file - corrects for spectral overlap
Size standard - detects the size standard in the sample’s data
Displays data that can be used to assign allelic designations to the DNA profile
Fluorescence detection
A dye molecule is excited by a laser
The excited dye emits light which is then detected
The fluorophores used in DNA detection are in visible range
Filters detect the emission spectra of the dyes that are used
Data is detected by a charged coupled device (CCD)
An electron hitting this is converted into an electrical signal
The strength of the current is proportional to the intensity of the signal
More produced, bigger the peak
Flurorophores
Molecules capable of fluorescence
Visible range
400 - 600 nm
Spectral overlaps
Must be able to distinguish from slight differences in different colour dyes to avoid overlap
Must use colour corrections when sample comes off
Matrix files correct spectral overlap
In the raw data, it’s all mixed together as matrix correction hasn’t been applied
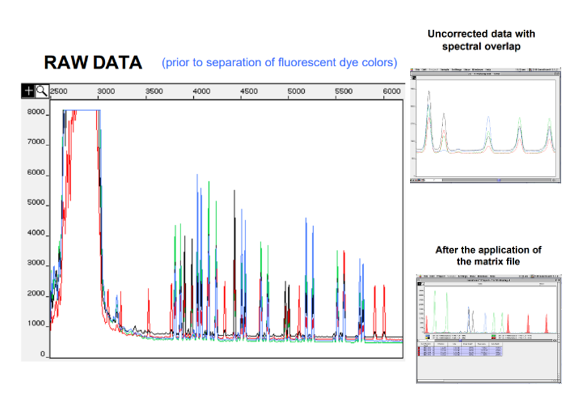
Matric files correct spectral overlap
Standards are run on the detection platform
Amount of contaminating colour is measured
This is used to correct raw data from analysed samples
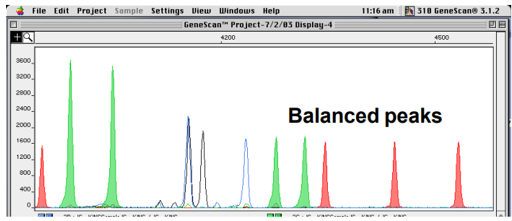
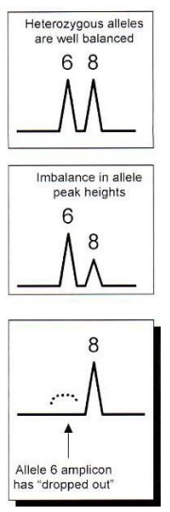
Interpretation of peaks
Peak morphology
Peak balance
Peak height/area
Artefacts
Peak morphology
Nice clear point/peak should have shoulders as it gets down to the bottom
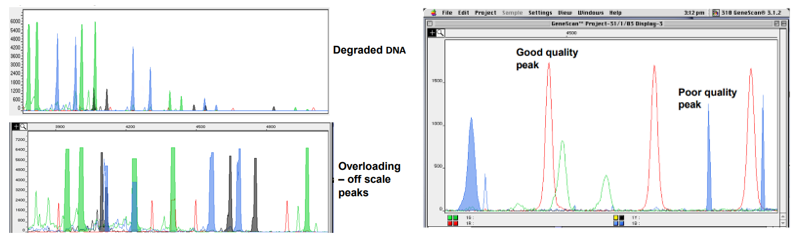
Peak balance
Two alleles of any one loci should be balanced and if they are imbalanced, the DNA could be degraded
Peak height/area
This is worked out by the machine so they can be compared to values in the table to see whether they’re similar
Artefacts
PCR stutter
Non-template addition
Allelic dropout
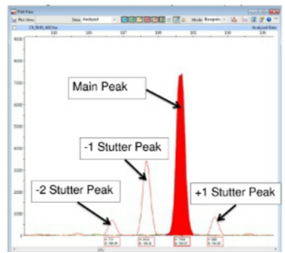
Stutter
Slippage during amplification
Mispairing during PCR reactions
Polymerase doesn’t like repeating sequences and often misses the base
Some peaks are smaller than the true peak in the profile
Tetramers have less stutter than dinucleotide repeats
Affects simple repeats
Large alleles demonstrate a higher degree of stutter
Minimise stutter
Use complex repeats - tetra/pentra repeats and a taq with high fidelity
Non-template addition
Taq polymerase adds an extra nucleotide to the 3’ end of the PCR product
The nucleotide is most often an adenosine
Taq polymerase has a terminal N (A) transferase activity - at the end of the PCR product, an adenine residue is added
If the system doesn’t resolve to the 1 bp level, it leads to a broad peak
Microvariants may go undetected
Minimise non-template addition
Not overloaded reaction with DNA and final incubation at 72 °C for 45 minutes to add A so everything gets an A on
Allelic dropout
Only one of the two alleles amplifies so there are two possible causes
Degradation of the large allele
Mutation of the primer site

Allelic dropout example
6 is not detected
At 3’ end, it can’t anneal properly
It won’t be amplified
Only the other allele is amplified
Minimise allelic dropout
Make primers to sites that are not polymorphic between individuals and populations
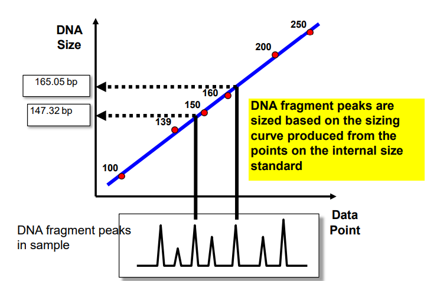
Sizing
Software looks for predefined pattern of the ladder
The multi-colour system allows internal size standards to be run in the same gel lane
Different systems
DNA fragment peaks are sized based on the sizing curve produced from the points on the internal size standard
Local Southern method
Promega systems
Use the ILS 600
22 fragments between 60 - 600 bp
Beckman systems
Use 2 different size standards for STR analysis
CEQ 400 - 22 fragments between 60 - 420 bp
CEQ 600 - 33 fragments between 60 - 640 bp
Local Southern method
Requires two standard peaks above unknown and two standard peaks below unknown
For CEQ 400 size standard, a 165 bp peak would be sized using the 140 bp and 160 bp on one side and the 180 and 200 bp on the other
It’s used often but not always the best for every situation