Quality Monitoring - Troubleshooting Techniques Week 3 (Laboratory)
 Call Kai
 Learn
Learn Practice Test
 Spaced Repetition
 Match
Match Flashcards
 Knowt Play
1/109

Earn XP
Description and Tags
Clinical Chemistry - Laboratory
Name | Mastery | Learn | Test | Matching | Spaced | Call with Kai | Chat |
|---|
No analytics yet
Send a link to your students to track their progress
110 Terms
Quality Assurance and Quality Control
Two critical components of laboratory practice that ensure precision and and accuracy of clinical chemistry test.
What does QA and QC ensures? (At least two)
Accuracy
Precision
Quality Assurance
It focuses on overarching and systematic efforts to improve and maintain laboratory performance
Quality Control
Involves routine procedures and checks used to monitor and control quality of test results on a day to day basis.
It covers the: Pre-analytical, Analytical, and Post-analytical.
Quality Assurance
It only covers the Analytical phase:
Quality Control
Total Quality Management
a managerial process that focuses on improvement of the quality of all the factors that affect laboratory testing and performance and it consist five elements.
Five Elements of TQM: (mnenomic: A CLIP)
Quality Assessment
Quality Control
Quality Laboratory process
Quality Improvement
Quality Planning
Quality Control
A system of ensuring accuracy and precision in laboratory by including Quality Control Reagents, Testing known samples that resembles patients, and a component of the QA system and part of the performance monitoring that occurs after established test.
Two kinds of quality control:
Intralaboratory or the Internal QC
Interlaboratory or the External QC
Quality Assurance
A planned and systematic activities implemented in a quality system so that quality requirements for a product or service will be fulfilled.
Primary Goal of Quality Assurance:
To deliver quality services and products to customers.
Intralaboratory/Internal QC
Involves the analyses of control samples together with the patient specimens.
Monitors the Day-to-Day performance of the lab tests and ensures the precision of the results obtained.
Employ Levey-Jennings or Shewhart QC chart plot.
Interlaboratory / External QC
Involves the proficiency testing programs that periodically provide samples of unknown concentrations to participating clinical laboratories
Interlaboratory/External QC
Maintain long term accuracy of the analytical methods
Employs Youden chart/plot
College of American Pathologist
A proficiency in CAP is the GOLD STANDARD for clinical laboratory external QC TESTING.
Standard/Calibrator
A Solution of known characteristics and known concentrations
Control
A material of known value that is analyzed with patient samples to determine acceptability results.
Assayed Control
Values are assigned by the manufacturer
Unassayed values
Determined by each individual laboratory for their methods or instruments.
In clinical chemistry, why do laboratories routinely run three levels of controls (Low, Normal, and High) rather than just a single normal control?
To monitor the analytical method's performance across the entire clinically reportable range.
Running Low, Normal, and High controls ensures that the instrument is accurate and precise at both pathological and normal physiological concentrations.
When analyzing QC results using Levey-Jennings charts, which Westgard rule is violated if two consecutive control measurements both exceed the mean by more than 2s in the same direction?
The 2_2s rule is violated when two consecutive control points exceed the same mean limit (either +2s or -2s), indicating a significant systematic error.
Which of the following scenarios is considered a "trend" in Quality Control data, as evaluated on a Levey-Jennings chart?
Six consecutive control values showing a continuous increase or decrease in one direction.
A trend is a gradual, continuous shift in QC values in one direction over several days, often caused by reagent deterioration or instrument wear.
The three levels of control:
Normal, High, or low
Calibrator/standard function
Machine can now interpret its raw readings using the language and mathematical rules we taught it, Anchoring its measurement to a known standard ensuring clinical accuracy.
Control function
The generated result can now be used to assess the machine’s capability to repeat that calibrated accuracy… testing a machine its own stability and environmental bias without changing ITS MATH (It just built or you set during calibration).
Standard/Calibrator
To establish a reading on the photometer from which the unknown can be determined.
It allows variation in instruments and reagents when OD (optical density) is used for the calculation
Characteristics of an IDEAL QC MATERIAL:
Resembles human sample
Inexpensive and stable for LONG PERIODS
NO COMMUNICABLE DISEASES
with KNOWN ANALYTE CONCENTRATION (THE ASSAYED CONTROL)
CONVENIENT PACKAGING for EASY DISPENSING AND STORAGE.
Color of Serum
Yellow
QC MATERIAL:
A solution (usually a serum) whose constituents are diverse but known which is run simultaneously with the test to check the accuracy and precision of the results.
QC MATERIAL:
A specimen or solution which is analyzed solely for quality control purposes, not for calibration.
Sources of QC MATERIAL:
Commercial Product
Diagnostic Sample
“HOME-MADE or In-HOUSE
What is an In-house QC material?
Pooled Sera collected in the lab
If reagent is reagents, or bacterium is bacteria, and medium is media…. Then SERUM is _____
Sera
What are home-made QC material?
Preserved in small quantities
Quality Control (QC) materials are available in various forms, including liquids and lyophilized formats. Which of the following statements correctly describes a lyophilized control material?
It is a freeze-dried, powder-like material that must be reconstituted by accurately adding a diluent (like water) before use.
Lyophilized means freeze-dried. This process turns the liquid control into a stable, dry powder to extend its shelf life. Before the technician can run it with patient samples, they must reconstitute it, which means adding a precise amount of liquid (usually deionized water or a specific diluent) to turn it back into a liquid form.
Control Limits (control values)
These are expected values represented by intervals of acceptable values with Upper and Lower Limits
Control limits are calculated from the ______ and ________?
Mean
Standard Deviation
What is the IDEAL CONTROL/REFERENCE LIMIT?
between 2SD
How Quality Control Material is usually ran?
Simultaneously with the patient sample at the beginning of each shift. (every morning)
After instrument is serviced. (machine maintenance)
When reagents lots are changed. (when control is empty)
After calibration, and whenever patient spx result seen inappropriate. (problems with the result)
Difference between ASSAY and ASSAYED?
Assay - The test method or procedure used to measure a chemical.
"We are running the glucose assay today."
Assayed - (Control) A control material that has already been tested by the manufacturer, who provides a sheet listing the exact expected target values.
"Open a bottle of assayed control serum to check our accuracy."
State the Parameters of Quality Control: (mnemonic: Accurate Patient Samples Save Real Bodies)
breakdown:* Accuracy, Precision, Specificity, Sensitivity, Reliability, Bias.
A medical technologist is validating a new clinical chemistry analyzer and must evaluate its QC parameters, including Accuracy, Precision, Specificity, Sensitivity, Bias, and Reliability. Which parameter specifically describes the ability of an assay to detect only the targeted analyte without cross-reacting with other substances?
Specificity
A laboratory tests a control material with a certified target value of 100 mg/dL. The analyzer yields a result of 99.8 mg/dL. This result demonstrates a high level of which QC parameter?
Accuracy is how close a measured value is to the true, actual value. Because 99.8 mg/dL is almost exactly the true value of 100 mg/dL, the assay is highly accurate.
A technologist analyzes the same control sample 10 times in a row. The results are: 62, 61, 62, 62, 61, 62, 61, 62, 62, and 61 mg/dL. The true value is 85 mg/dL. How would you describe these results?
Precise but not accurate
“Precision is reproducibility—getting the same or similar results repeatedly, even if they are wrong. The machine is consistently hitting the wrong number (around 62 instead of 85), meaning it has high precision but low accuracy.”
A newly developed immunoassay for Digoxin shows false-positive results when patient serum contains high levels of structurally similar endogenous substances. This assay lacks adequate which parameters of QC CONTROL:
Specificity. is the ability of an assay to measure only the specific analyte it is supposed to measure, without cross-reacting or getting confused by other look-alike substances in the blood.
A Trojan-Troponin assay is capable of detecting cardiac troponin concentrations as low as 0.01 ng/mL in blood, allowing for the very early detection of myocardial infarctions. This metric describes the assay's which parameters of QC CONTROL:
Sensitivity (also known as the lower limit of detection) is the ability of an assay to detect and measure very small amounts of an analyte.
Which parameter describes an assay's ability to maintain both its accuracy and precision over an extended period under varying lab conditions (e.g., different operators, minor temperature shifts, different days)?
Reliability is the overall trustworthiness and stability of the test method over time. If a test is reliable, it consistently delivers accurate and precise results day after day, regardless of small, standard laboratory variations.
Which QC parameter is defined as a quantitative term describing the mathematical difference between the average measurements made on the same object and its true value?
Bias
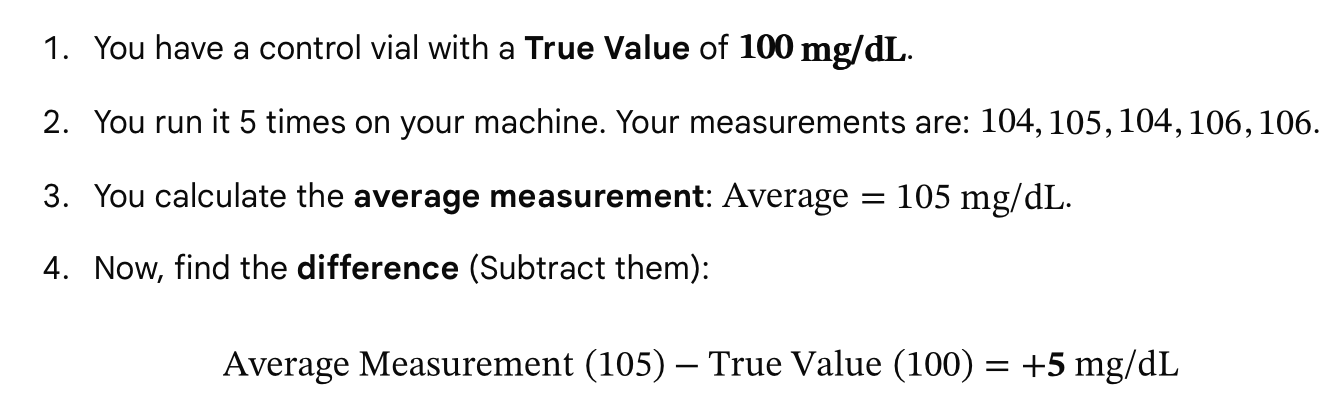
What is the purpose of getting the +5mg/dL for ? What does it represent?
That is your Bias. It is a quantitative term telling you that your machine is consistently overestimating the results by exactly 5 units.
rationale: So if it asks for the calculated numerical gap (quantitative term) between your average and the true target, the answer is always Bias.
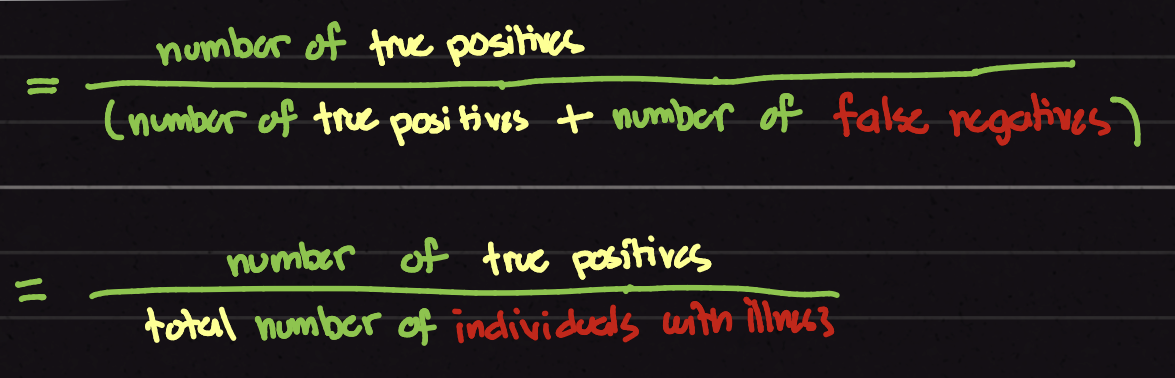
What is this formula for ?
Sensitivity = a/a(a+c)
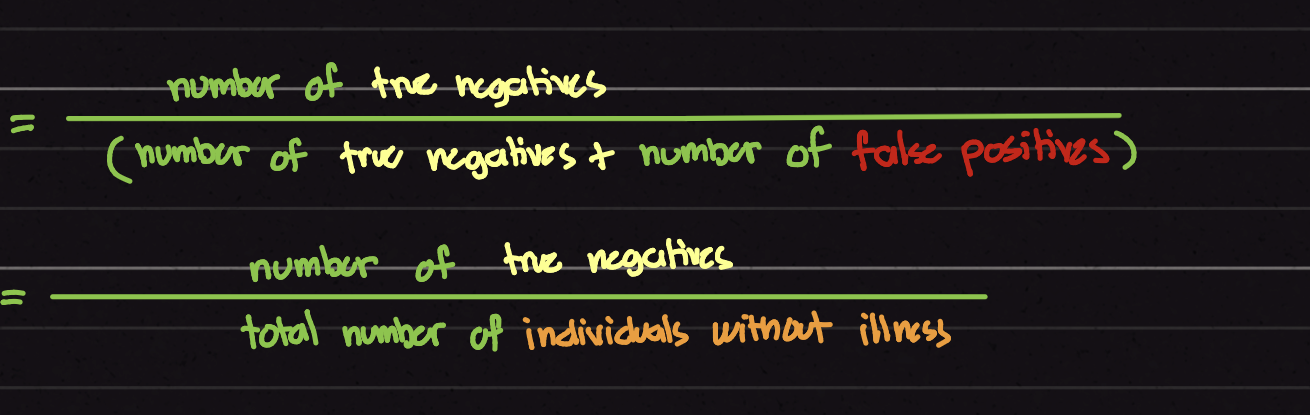
What is this formula for?
Specificity
False - Negative Error Rate
Percentage of True Positive (sick patients) that the TEST FAILED TO DETECT. → C/(A+C)
A laboratory evaluates a new HIV assay using a validation panel of 200 patients who are confirmed to have the disease. The analyzer correctly identifies 190 patients as positive, but reports the remaining 10 patients as negative. What is the False Negative Error Rate for this assay?
5% - False Negative Error Rate
Sensitivity
The ability of a test to detect a disease in a when present (true sick patient).
(Percentage of sick patients that the test successfully caught)
Which Quality Control parameter is defined as "the ability of a test to indicate nondisease when no disease is present"?
Specificity
False-Positive Error Rate
Test falsely indicated presence of disease in nondiseased participants.
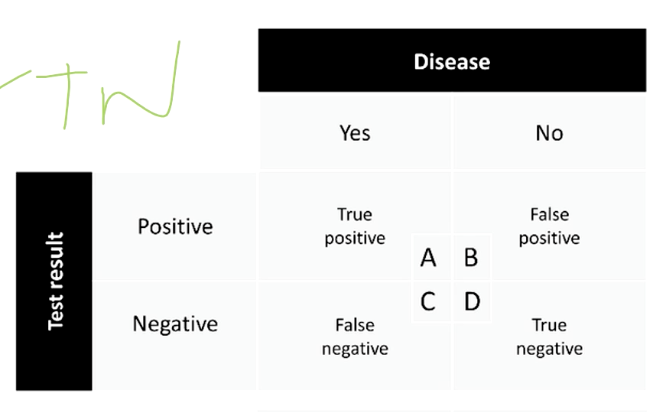
Based on the given what is this formula → b/(b+d)
False Positive Error Rate
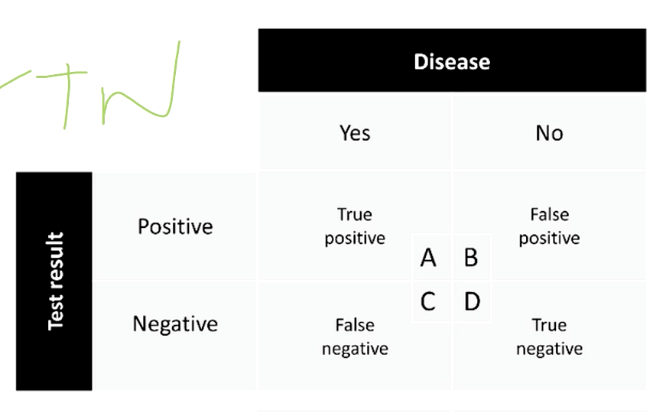
Provide the formula for False-Negative Error Rate
→ C/ (A+C)
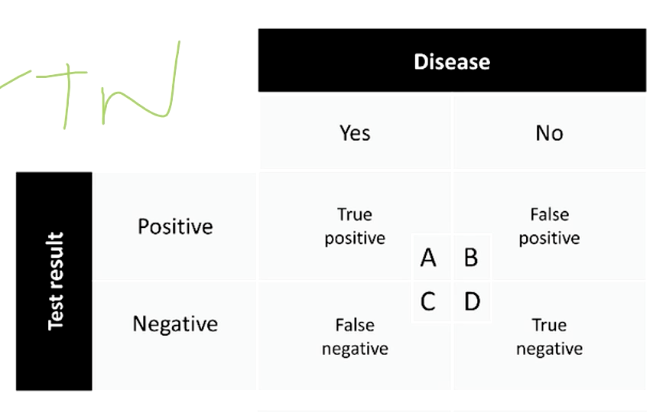
Positive Predictive Value formula
A/(A+B)
Positive Predictive Value
Indicates what proportion of the subjects with positive results had the disease.
Negative Predictive Value
Indicates what proportftion of subjects with true negative that are actually had no or did not have disease.
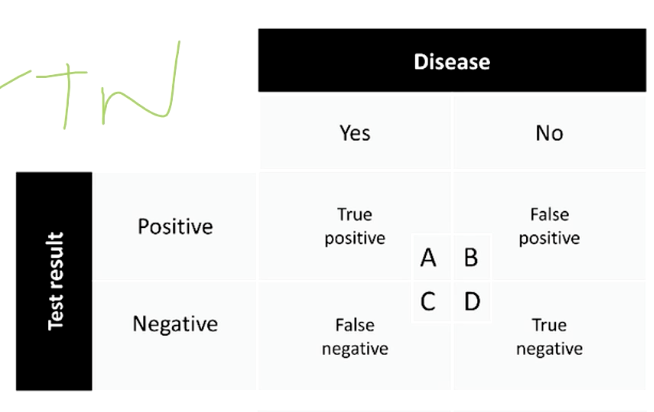
Negative predictive value formula (based on this picture)
d/(c+d)
Test Validity
is the ability of a screening test to accurately identify diseased and non-diseased individual.
An ideal screening test is exquisitely sensitive and extremely specific.
An ideal screening test is exquisitely _________ and extremely _________.
Sensitive and Specific.
Arithmetic mean
A set of numbers is obtained by adding all the numbers in the set and dividing the sum by the number of values in that set.
Median
is the middle value in a set of numbers that are arranged according to their magnitude.
Mode
is the most frequently obtained value in a set of numbers.
used to describe with two centers (bimodal)
When constructing a Levey-Jennings Quality Control chart, a medical technologist must establish the exact center line (the target value) for a new lot of control serum. Which measure of central tendency is calculated by summing all the daily control measurements and dividing that total by the number of days recorded?
MEAN
RATIONALE: The Mean is the mathematical average of a data set. In laboratory quality control, the calculated mean serves as the absolute center line on a Levey-Jennings chart, representing the target performance value for that specific assay run
A technologist reviews a list of ten daily calcium control results (in mg/dL):9.2, 9.5, 9.3, 9.5, 9.4, 9.6, 9.5, 9.3, 9.7, 9.5
Which measure of central tendency is 9.5 mg/dL in this specific Quality Control data set?
Mode
RATIONALE: The Mode is defined as the value that occurs with the highest frequency in a data set. In this list of results, the value 9.5 appears four times, which is more frequent than any other number.
To evaluate the distribution of a new glucose control lot, a technician records 5 consecutive daily results: 96, 104, 98, 101, and 95 mg/dL. What is the Median value for this Quality Control data set?
To find the Median, you must first arrange the data points in consecutive order from lowest to highest: 95, 96, 98, 101, 104. The median is the exact middle number in this ordered list, which is 98. (Note: 98.8 is the mean, not the median).
Standard Deviation
A measure of the dispersion of values from the mean.
It helps describes the normal curve.
It is the most frequently used measure of variation
Coefficient of Variation
Percentile expression of the mean
It is an index of precision
Variance
Called the Standard Deviation Squared
It is a measure of variability
It represents the difference between each value and the average of the data.
What QC chart is shown?
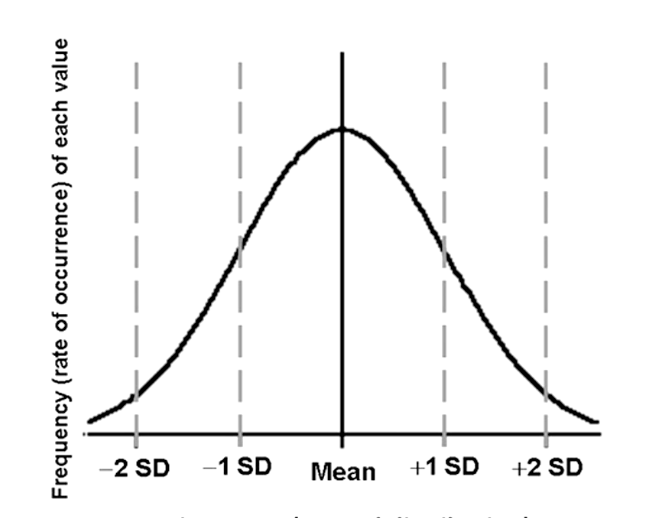
Gaussian Curve
Gaussian Curve (Bell-Shaped Curve)
AKA as the Normal frequency/distribution curve
It occurs when the data set can be accurately described by the SD and the Mean.
It is a population probability distribution that is symmetric about the mean.
It focused on the distribution of errors from the analytical method rather than the values from a health or a patient population.
68.26% of the values fall within which SD?
+-1SD
95.44% of the values fall within which SD?
+-2SD
99.74% of the values fall which SD?
+-3SD
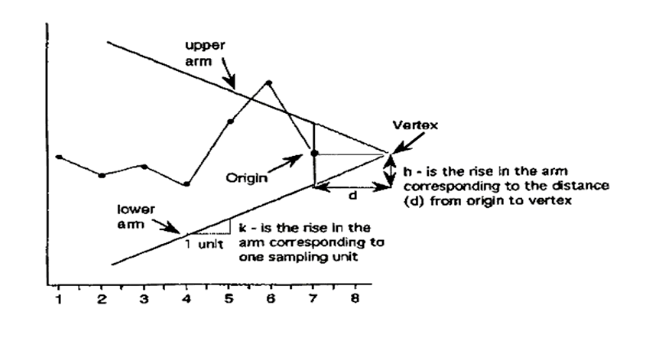
What graph is this and the method/technique it utilizes.
V-mask ; Cumulative Sum Graph (CUSUM)
Cumulative sum Graph
Identifies consistent bias problem
Calculate the difference between the QC results and the target mean
It requires computer implementations.
Very sensitive to small, persistent errors.
It will give the earliest indication of systematic errors (trend)
Most Common Method; Cumulative Sum Graph
V-Mask
Multirule QC
Uses a combination of decision criteria, control rules, to decide whether an analytical run is in control or out of control.
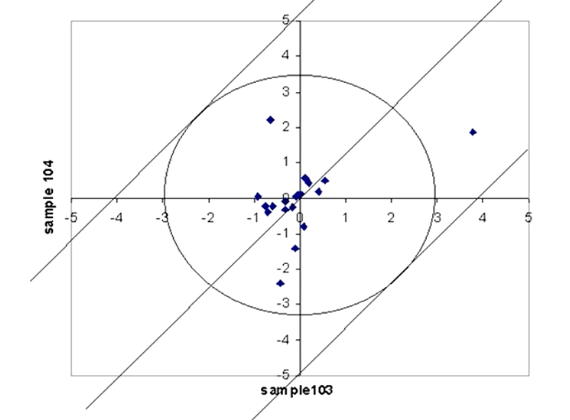
QC chart and state its purpose:
It used to compare results obtained on a high and low control serum from different laboratories.
It displays the results of the analyses by plotting the mean values for one specimen on the ordinate (Y-axis) and the other specimen on the abscissa (x-axis)
A medical technologist notices a single control value for the potassium assay exceeds the mean by slightly more than +2 standard deviations (+2SD), but is well within (+3SD). According to the Westgard scheme, how should this run be handled if no other rules are broken?
While analyzing daily QC, the analyzer flags a control point for cholesterol at -3.4SD below the target mean. Which Westgard rule is violated, and what type of error does this typically point to?
Over two consecutive runs, the Level 1 control value measures (+2.1s) on the first run, and (+2.3s) on the second run. Which Westgard rule is violated, and what should the technician do?
In a single analytical run, Level 1 control reads at (+2.2s) and Level 2 control reads at (-2.1s). What Westgard rule is broken?
Over four consecutive days of testing, the daily QC values for total protein are: +1.1s, +1.3s, +1.2s, and +1.5s. All values sit on the same side of the mean. Which rule is violated?
Control Rule
A term used to indicate if the analytical process is out of control.
Levey Jennings Chart
Most widely used QC chart in the clinical laboratory.
Apply rules without computer
Graphic representation of acceptable limits of variation in the results of an analytical method.
It easily identifies random and systematic errors.
Types of Error
Random Error
Systematic Error
Trend
Shift
State the definition, the QC parameter it affects, and the 6 major causes of Random Error.
Key Definition & Behavior
The Cause: It is due to chance. The exact source cannot be definitely identified.
The Variation: It varies from sample to sample and is present in all measurements.
The Variables: Driven by technique variations in instruments, operators, and environmental conditions.
2. What Parameter Does It Affect?
It directly affects PRECISION (reproducibility).
(Hint: Systematic error affects accuracy/bias; Random error affects precision).
3. The 6 Master Causes
Mislabelling of samples
Pipetting errors
Improper mixing of samples and reagents
Voltage fluctuations
Temperature fluctuations
Dirty optics (light source)
State the definition, the QC parameter it affects, how it relates to bias, and the 6 major causes of Systematic Error
Answer Key & Reviewer Summary
1. Key Definition & Behavior
The Cause: Errors that can be identified.
The Behavior: Shifts results consistently in one direction (creates a constant difference that is consistently higher or lower than the true value).
2. What Parameter & Concept Does It Affect?
It directly affects ACCURACY (the agreement between a measured value and the true value).
It is detected clinically as either a positive or negative bias.
3. The 6 Master Causes
Improper calibration
Deterioration of reagents and control materials
Contaminated solutions
Unstable and inadequate reagent blanks
Failing instrumentation (leaking ISE, diminishing lamp power)
Poorly written procedures
Define a Trend on a QC chart. State how many consecutive days it must last, what it indicates about the system, and its 3 specific causes.
1. Key Definition & Behavior
QC values slowly move up or down from the mean line.
They must continue moving in the exact same direction.
2. Critical Timeline & Indication
Duration: Must continue for SIX (6) consecutive days.
Meaning: Indicates a gradual loss of reliability in the test system.
3. The 3 Master Causes
Repair or installation of instrument
New lot of reagent o recalibration of the method
Deterioration of reagent
Define a Shift on a QC chart. State how many consecutive days it must last, what it represents about test performance, and its 5 specific causes.
1. Key Definition & Behavior
Control values distribute themselves on one side or either side of the mean.
2. Critical Timeline & Indication
Duration: Must continue for SIX (6) consecutive days.
Meaning: Represents a sudden or abrupt change in test performance.
3. The 5 Master Causes
New reagents
New quality control material
Change in internal temperature
Dirty cuvettes
Improper calibration of instrument
Outliers
Control values that are far from the main set of values (highly deviating values). They can be caused by either Random OR Systematic errors.
F - Test
Specifically used to compare Standard Deviations (precision) between two groups of data to see if there is a statistically significant difference.
T - Test
Specifically used to compare Means (average/accuracy) between two groups of data to see if there is a statistically significant difference.
Analytical Run
A set of control and patient specimens assayed, evaluated, and reported together.