Exam 2 Research Methods
1/82
There's no tags or description
Looks like no tags are added yet.
Name | Mastery | Learn | Test | Matching | Spaced | Call with Kai |
|---|
No analytics yet
Send a link to your students to track their progress
83 Terms
Surveys
involves asking people questions, can be administered in person or online
Ex. Questionnaire
Poll
to find out their opinions, beliefs or behaviors( often about politics)
Ex. voting
Observational Studies
Involve watching behavior, often without asking any questions at all
Ex. scientist observing a group of people
claim frequency
how often a certain statement or claim appears
Ex. The number of times a claim appears in articles
casual claim
one variables causes a change in another variable
Ex. Eating breakfast improves concentration
Association claim
how two variables are linked or related
Ex. Teens who use social media more are less happy
construct validity
how well a test a study actually measures what it claims
A stress questionnaire truly measures stress, not tiredness
What variables are being measured (observational, surveys, polls)
claim frequency
association
casual
= construct validity
3 important consideration
choosing question formats
writing well-worded questions
encouraging accurate responses
Open-ended questions
permits respondents to answer in any way they chose
Ex. What do you think of this class?
Forced-choice questions
Requires picking the best of 2+ options
Likert Scale: rating scale→ strongly agree, agree
Semantic Differential questions: numeric scale 1-5
Writing well worded questions
Make each questions clear and straightforward
make sure to focus on 1 concept at a time
Ex. How effective is communication in your team?
Things to Avoid
Leading question: How much did you love our project?
Double-barreled questions: two questions→ Was the project fun and educational?
Negatively worded questions: can lead confusion-
Response set
People respond in the same way to all questions (negatively, positively, neutral)
Acquiescence: a tendency to people to agree with statements
Fence sitting: respondents only answer to neutral
How to fix acquiescence
Reverse worded:
Q1: I feel happy with my job
Q2: I often feel unhappy at work
Socially desirable responding
People give untruthful responses that make them look better than they actually are (faking good)
Faking bad
people give untruthful responses that make them look bad
Why might be the reason to these issues?
attitudes, beliefs, personality, self-esteem
Behavioral Observations
can be used to measure variables for any type of claim → frequency, association or casual
3 common problems with behavioral observations
Observer Bias
Observer effects/Expectancy Effect
Reactivity
Observer Bias
When the observer’s expectations or beliefs influence their INTERPRETATION of the participant
Ex. a psychologist believes that boys are more aggressive than girls so they only record boys and not enough girls
Observer Effects/ Expectancy effects
When the observer’s expectations influence the BEHAVIOR of he participants being observed, aka when the researchers’ expectations leak out
Clever Hans
a horse who we thought to be smart but he proved expectancy effect, the horse was following uncsious cues from humans like posture or facial expressiong
Ways to prevent these effects 4
Training for observers(train them to control their own expressions)
Clear instructions
Having multiple observers
Masked design: observers are unaware of the purpose of the study
Reactivity
When people change their behavior simply because they know they are being watched → PRESENCE
Two ways to prevent reacitivty
Unobtrusive observations: observer watches without the participants knowing they are being observed
Unobtrusive data: Obtaining data through methods that do not involve direct contact with participants (reviewing their history, analyzing media)
External Validity
can represent the population (needs to be unbiased and random sample)
Generalizability
Does the sample represent the population?→ external validity
Populations
include the entire set of people, products, items that you’re interested in (all college students)
Samples
a smaller set of people
Ex. 300 students from 5 universities
Census
everyone in the study→ key word every
Ex. Surveying every single college student in the US
Biased vs Unbiased examples
Biased:
giving surverys to students sitting in the front row because they pay more attention
parking meter in populated areas
Unbiased: better external validity
obtaining a list of students
Strategies that lead to biased sampling→ reduces external validity
Convenience Sampling: Sampling those who are easiest to contact
Self-selected sampling: Sampling on those who volunteer
Ex. Those who post on Rate My Professor
If the study is not generalizable to the rest of the population then
we would say it was poor/low external validity
Probability Sampling
Every member of the population has an equal and known chance of being selected
Non probability Sampling
involves nonrandom sampling→ biased sampling and poor external validity
6 Probability Sampling Techniques (unbiased)
Simple random sampling
Systematic Sampling
Cluster Sampling
Multistage sampling
Stratified random sampling
Oversampling
Simple random sampling
sample is chose at random from the population (often using random generator)→ ENHANCES EXTERNAL VAILIDTY
Systematic Sampling
Researcher selects every nth individual from a list
Ex. Selecting every 10th name
Cluster Sampling
Population is divoded into clusters and clusters are randomly selected and all invididuals are chosen
Ex. Randomly selecting 5 high schools (clusters) and every student is selected in those 5 schools
Multistage Sampling / Two step process
Clusters are selected randomly, but then individuals within each cluster are selected randomly for the sample
Ex. Selecting 5 high schools, and only selecting 50 students from each school
Stratified random sampling
The population is divided into strata (categories) based on demopgraphics and then it is randomly selected equally
Ex. divide students into 4 groups based on year and if its 70% freshman and 40% senior you want 70 freshman and 40 seniors
Oversampling
The researcher intentionally over represents one or more groups in the sample
Non probability Sampling Techniques (biased)
Convenience sampling
Purposive sampling
snowball sampling
quota sampling
Convenience sampling
Sampling those who are easiest contact
Ex. You want to study a padres fan so u go to padres fan
Purposive Sampling
Sampling those who only fit a certain profile or category
Ex. smokers
Snowball Sampling
Participants are asked to recommend there own family or friends to be included
Ex. Do you know anyone else we can study
Quota sampling
nonprobability sampling, researchers set a target number of each category until the number of participants are met
Ex. if you need 40% men and 60% women. You might stand in a mall ro trecuit 40 men and 60 women who walk until your spots fill up
Random assignment
randomly placing into different groups such as experiment or control
Ex. using random assignment to put participants into sleep group and no sleep
→ENHANCES INTERNAL VALIDITY
Why is the size of a sample not as important to external validity as the way a sample was collected?
We care more about generalizability aka external validity, if we use a large sample and it is not generalized then it doesn’t represent the population of interest.
Bivariate Correlation
an association between two variables. It can be positive, negative or zero
What claims do they support?
ASSOCIATION claim; suggest one variable is related to another
Casual claim: only if one of the variables is manipulated
Correlations studies establish
External Validity rather then internal validty
Two important validities to assess
Construct validity: How well a study measures the variable
Statistical Validity: How statistical conclusions from a study are accurate
What are the 6 questions to assess statistical validity in correlation?
How strong in the relationship?
How precise is the estimate
Has it been replicated?
Could outliers be affecting it?
Is the restriction or range?
Is the association curvilinea?
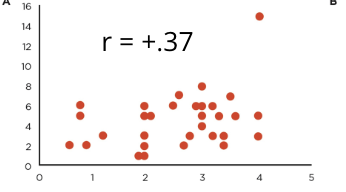
What is the effect size of a correlation coefficient
small: r=0.50
Small: r=0.10
Medium: r=0.30
Large: r=0.50
→ HIgher R value indicates a stronger association between two variables
Higher p value indicates a
greater likelihood that an association is due to chance
Two problems
Directionality Problem
Third Variable
Spurious association
Directionality problem
When its unclear which variable came first in a correlational study
Ex. social media usage or depression
Third variable
a third factor that might be related to both variables (correlation between ice cream sales and drowning, third variable might be temperature)
Spurious Attention
a resulting false correlation between two caused
Ex. the correlation between ice cream sales and drowning is spurious, because its actually temperature
Outlier
An extreme score that can distort the correlation, especially in small samples
Mediator
Explains why or how the variables are relation (why does x affect Y)
Ex.
IV: life stress
Mediators: poor sleep
DV: depression
Moderator
changes the strength or direction of the relationship between two variables (when or whom) or under what condition
→ effect of X and Y depends on Z
Ex. The association between academic stress and student anxiety depends on your school
What 3 issues can decrease statistical validity
outliers
restriction of range
curvilinear relationship
Outlier
A data point is extremely different from the rest of the data in a dataset
Restricition of range
When all scores are not accounted for, which can often inaccurately decrease an effect size
Ex. relationship between SAT scores and college GPA but you’re only looking at students who got into an ivy school
Curvilinear association
When a set of data is not well represented by a straight line and often result in a zero effect size
can we infer casuality from an association
no do not infer causality from an association claim
Multivariate
refers to studies that involve more than two measured variables
Ex. does watching sexual connect on TV predict teen pregnancy
3 criteria for establishing causation
Covariance
Temporal Precende
Internal Validity
Longitudinal designs
measure the same variables in the same people at several points in time
cross sectional correlation
cross sectional tests the relationship between two variables measured at the same point in time → helps w covariance and are associated
Ex. correlation between parental overvaluation and child narcissism measured at TIme 1 (month 0)
temporal precedence
the cause comes before the effects in time
Ex. stress causes insomnia
auto correlation
If one variable measured earlier is associated with measurement of the same variable taken later
Ex. they measure narcissism in Time 1 (age 8) and Time 2 (age 10)
(both variables at Time 1 and 2) TEMPORAL PRECEDENCE
cross lag correlation
examines whether the earlier measure of one variable is associated with the later measure
Ex. parental overvaluation T1 and Child narcissism at T2 → TEMPORAL PRECEDENCE
Multiple regression
can help eliminate internal validity problems by controlling for potential third variables
Ex. sexual content predicts pregnancy even when we control for other potential third variables
Criterios variable/ dependent variable
the variable that the researcher is most interested in understanding or predicting
Predictor Variables/Independent variable
explains variance in the criterion variable
Beta coefficient (standardized)
indicates the strength and direction of the relationship between a predictor and the criterion(original units)
Ex. exposure to sex on TV and pregnancy is positive
.45 is stronger than .20
b (unstandardized)
Predicts actual values, aka raw relationship
Ex. -2.5 means for each pint depression drops by 2.5 units
Can multiple regression establish causation?
No because it still can confirm temporal precedence or control for measured third variables
Pattern and parsminory
making a casual claim by identifying consistent paattern of results across many studies that explained by a simple explanation
Ex. longer smoking=higher cancer risk