Leacture 3: terrestrial biomes
 Call Kai
 Learn
Learn Practice Test
 Spaced Repetition
 Match
Match Flashcards
 Knowt Play
1/20

There's no tags or description
Looks like no tags are added yet.
Name | Mastery | Learn | Test | Matching | Spaced | Call with Kai | Chat |
|---|
No analytics yet
Send a link to your students to track their progress
21 Terms
whats the room, human body, and home freezer temperature in celsius
21*;37*; -18*
What is a walter climate diagram
a. what is the x and y axis
Temperature in celsius vs precipitation in mm
in a walter climate diagram, if the first month its july, the biome is in the nothern/southern hemisphere, if its january its in the nothern/southern hemisphere
southern;nothern
what is growing season on a walter climate diagram
when precipitation is above temperature line and temperature is above 0
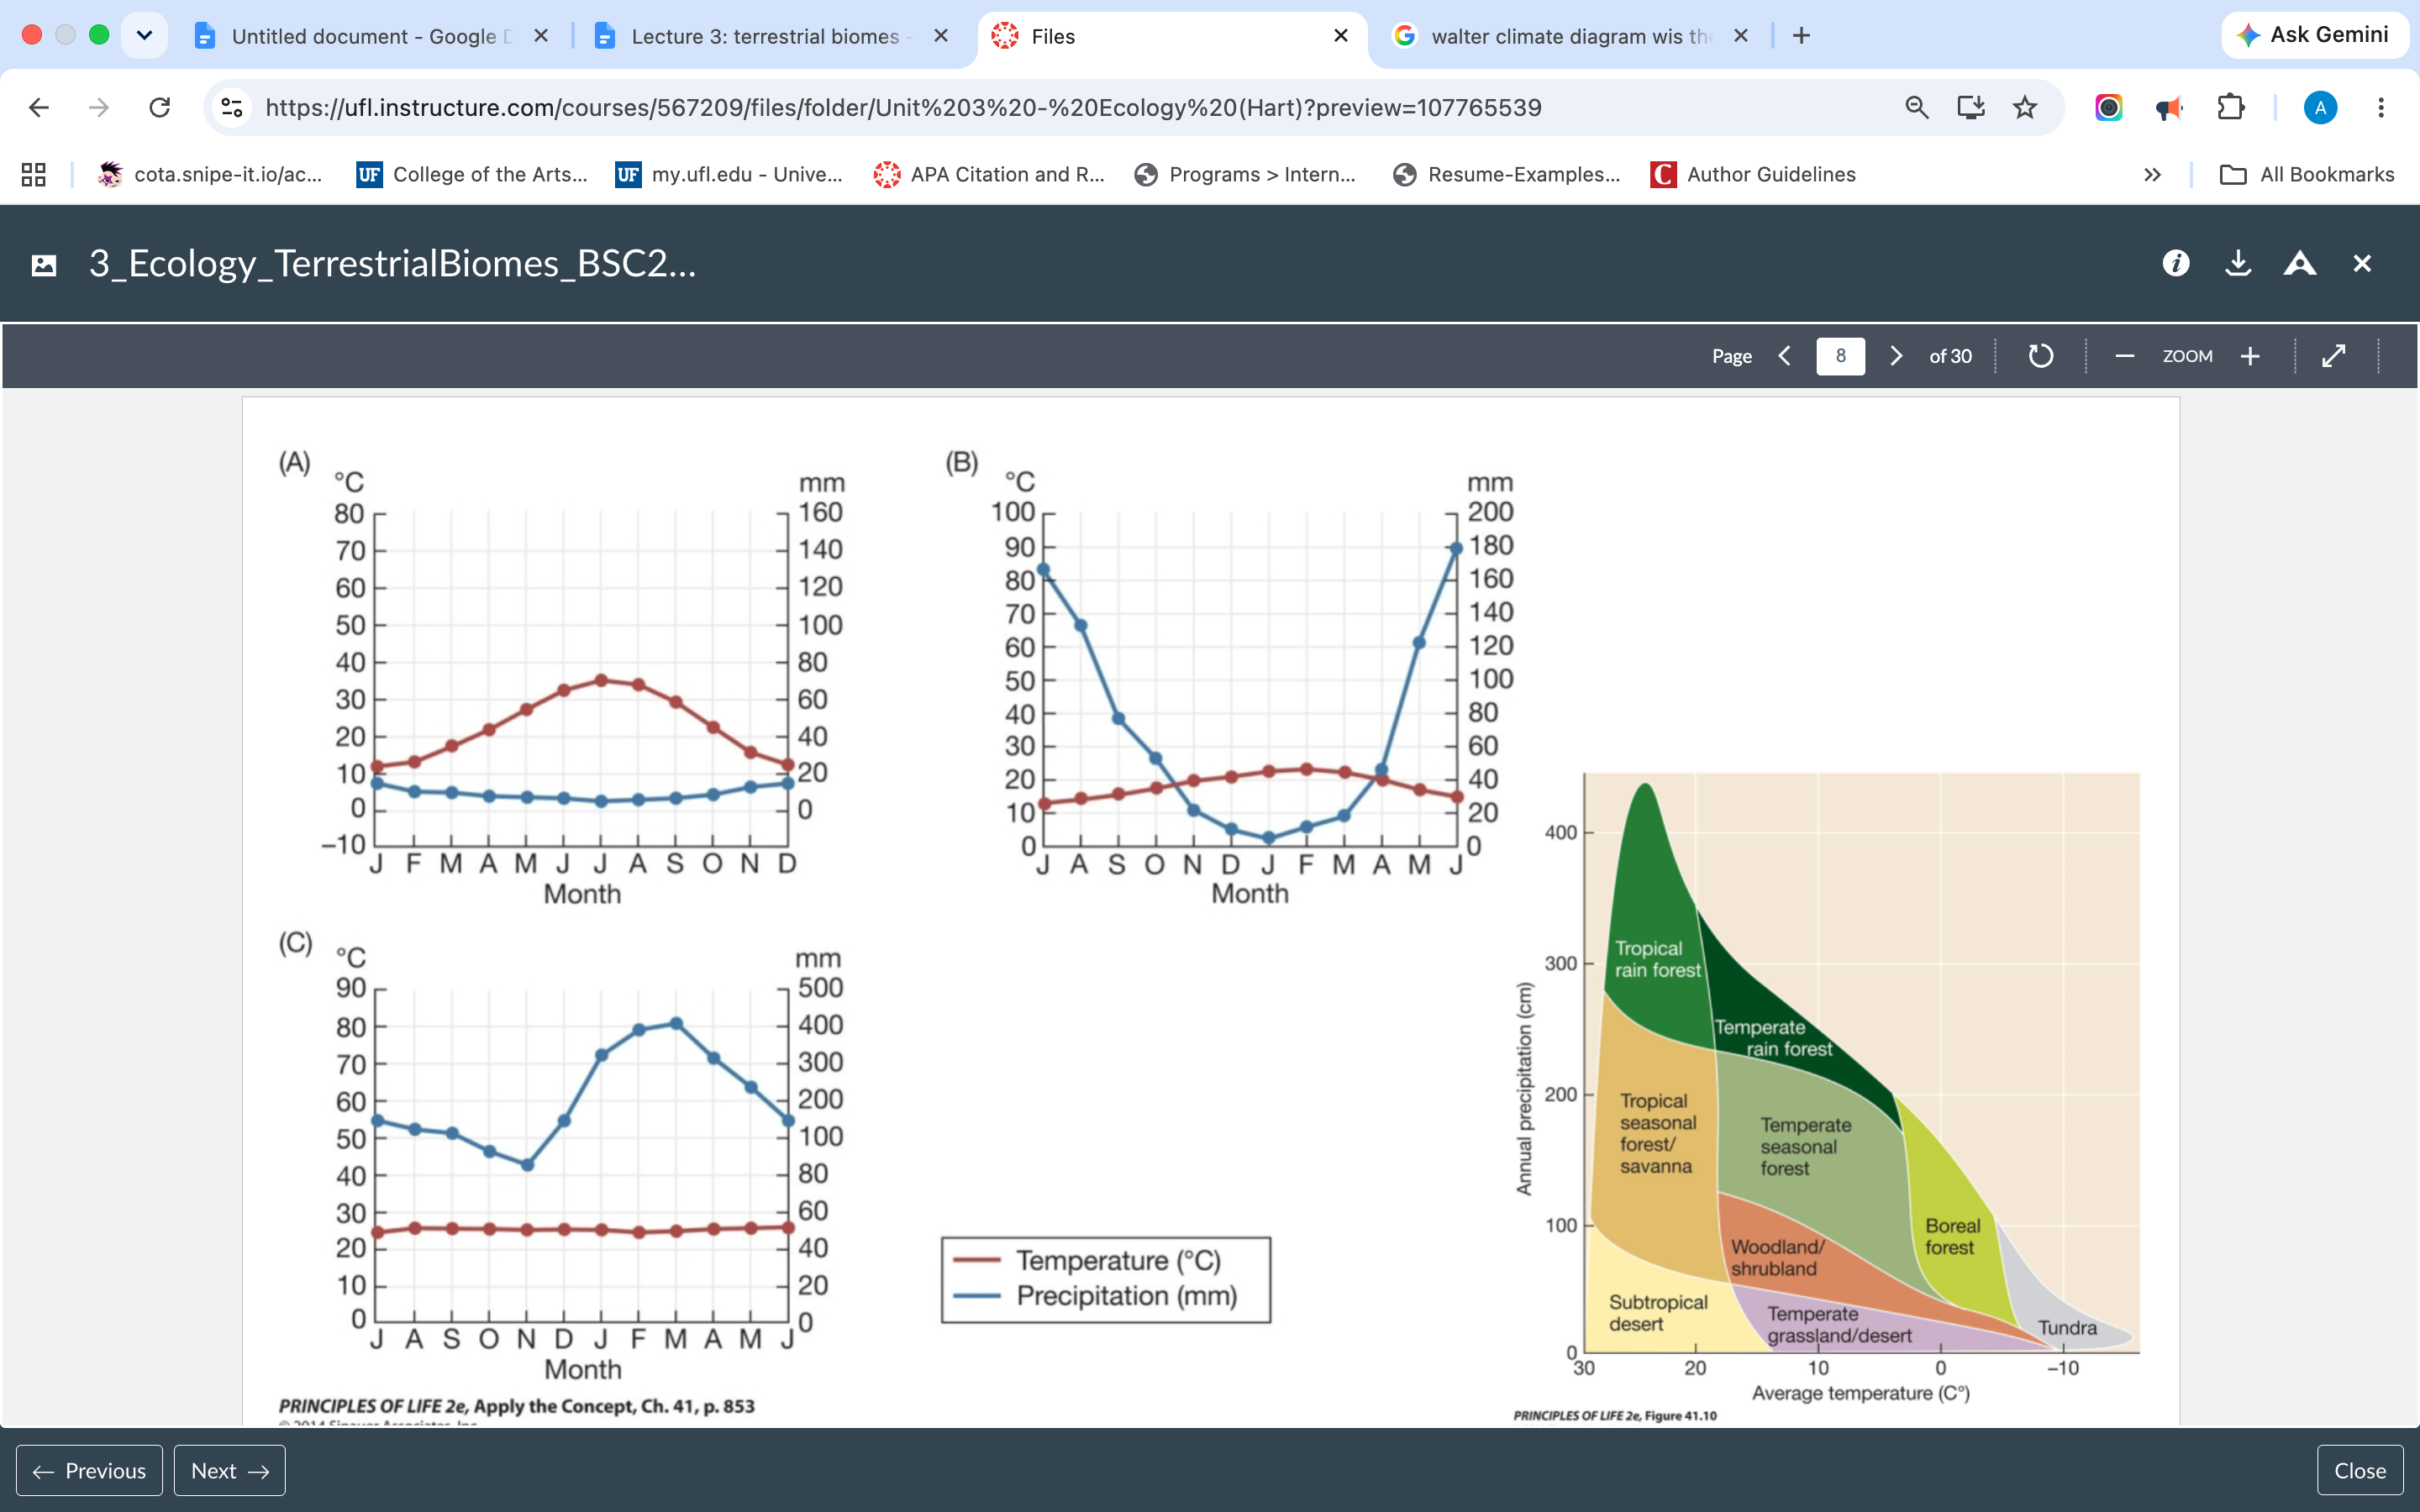
describe the
a. seasonality in temperature
b. seasonality in precipitation
c. what hemisphere biome is in
d. growing seasons
Graph A. There is seasonality (variety) in temperature, no seasonality in precipitation, no growing season, in the southern hemisphere because it starts with january
Graph B. Seasonality in rainfall, minimal seasonality in temperature, has two separate and long growing seasons, in the northern hemisphere, in the northern hemisphere because starts in july
Graph C. Seasonality in rainfall, minimal seasonality in temperature (essentially none tbh), its always growing season, in the northern hemisphere because starts in july
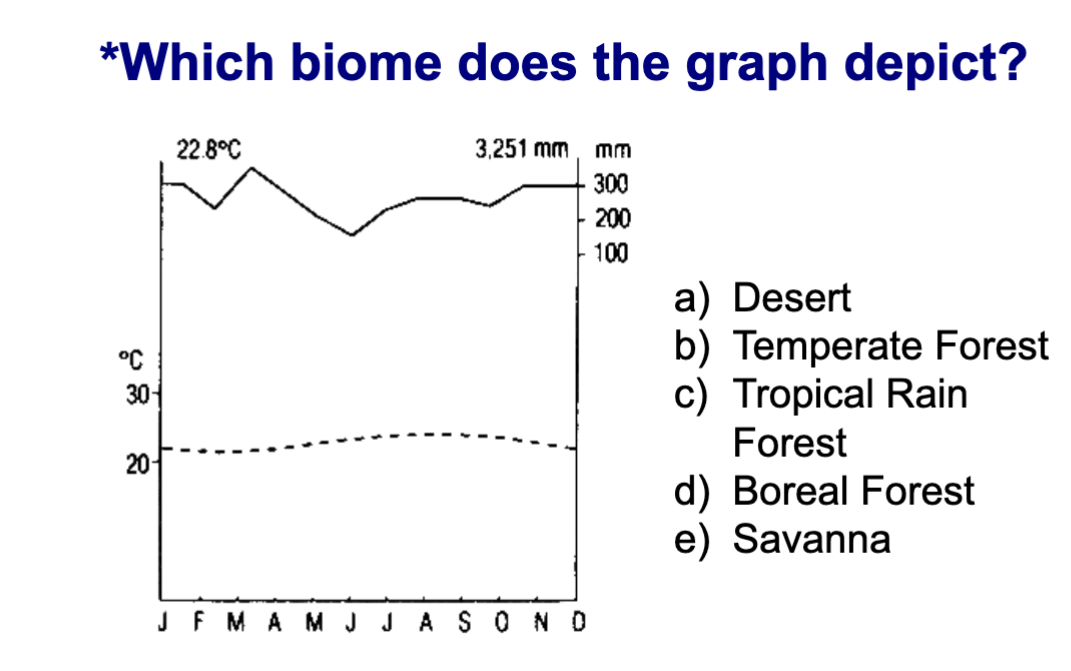
graph for tropical rainforest
Graph: Highest precipitation levels with minimal seasonality. 20-30 degrees celsius barely any seasonality, always in growing period
describe tropical rainforest (trees, location, soil)
Found near the equator
Tall trees
High species diversity
Large canopies
Soil
Old, highly weathered
Low in nutrients
Low in carbon
graph for temperate forest (This is florida)
Graph: High precipitation with seasonality. Temperature is from 5-30* degrees celsius with seasonality.
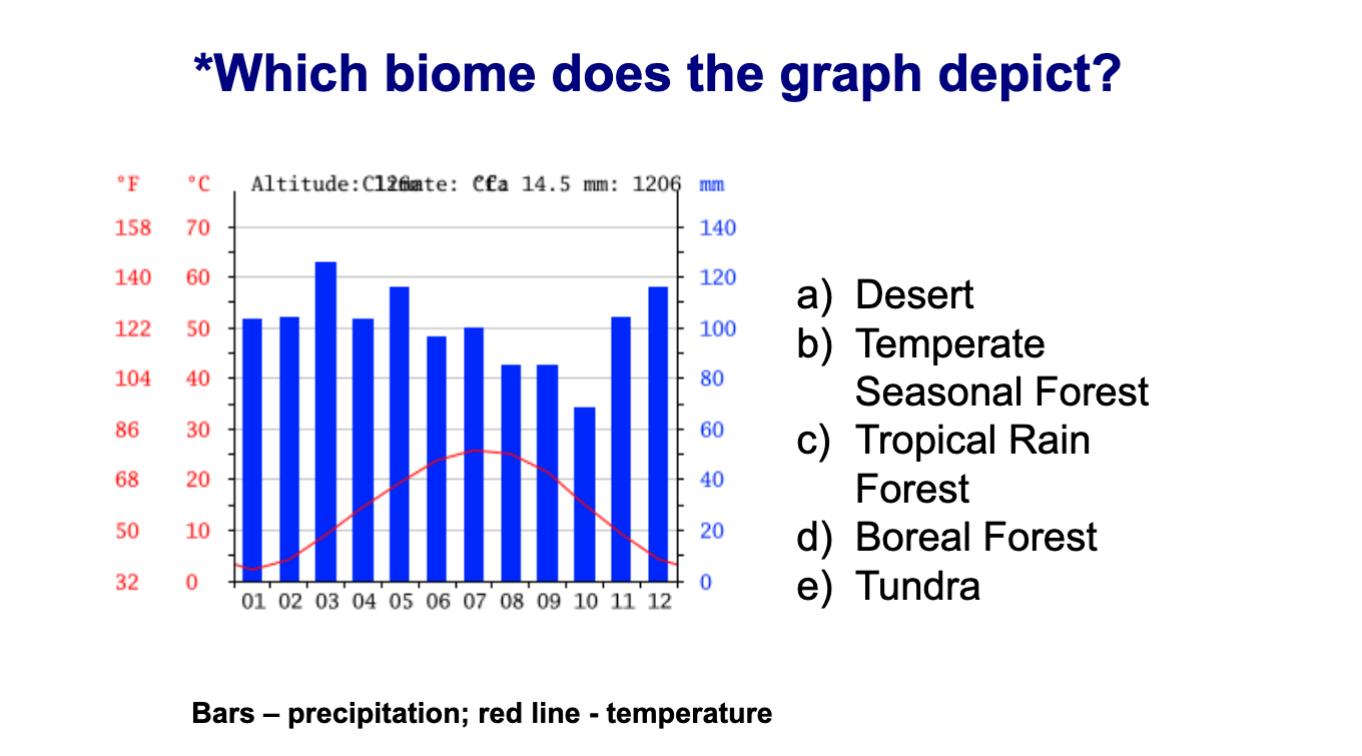
describe temperate forest weather and trees.
cold , dry winters
Warm, moist summers
Relatively large tree biomass
Deciduous (leaves fall during seasons) and evergreen trees
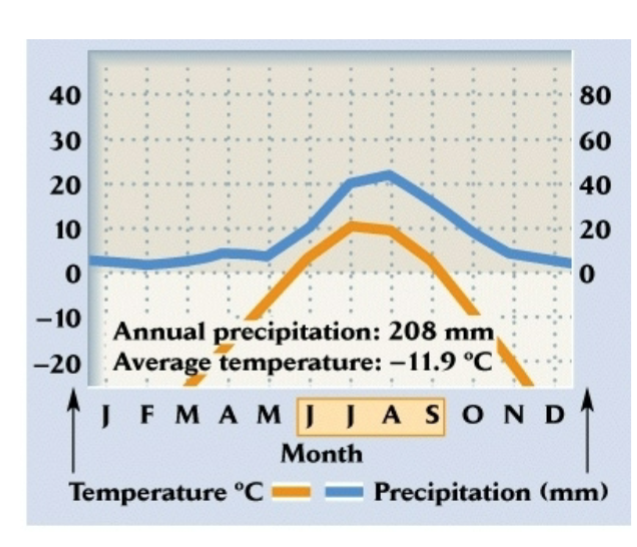
graph for tundra
Graph: short growing period between JJAS, outside of growing period the temp is near 0*C
describe tundra weather, trees, and soil
Severe winters
Cool summer
Short vegetation
No or sparse trees
Sedges, low shrubs, mosses and lichens
Soil
Mostly permafrost (permanently frozen soil)
High in organic matter
High carbon and nutrients
Holds about ½ of global carbon dioxide
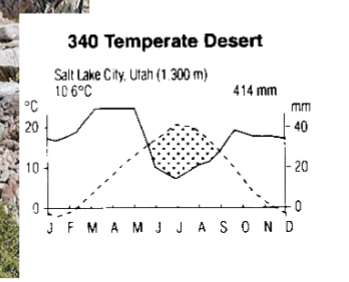
graph for temperate desert
Solid line is precipitation; dotted line is temperature.
typical dry dessert. Fluctuation between hot and cold. Nongrowing season at JJAS.
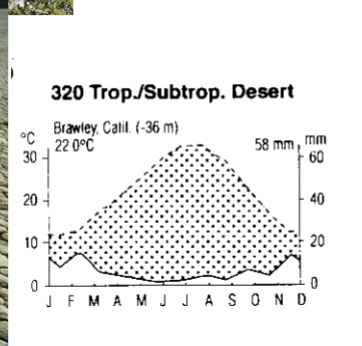
graph for trop/subtrop desert
Solid line is precipitation; dotted line is temperature.
consistently very hot, unlike temperate. Never in growing season. Temperature increases greatly at JJAS. precipitation is minimal with barely any seasonality.
graph for taiga/boreal forest
Graph: bow like graph. It legit looks like a bow
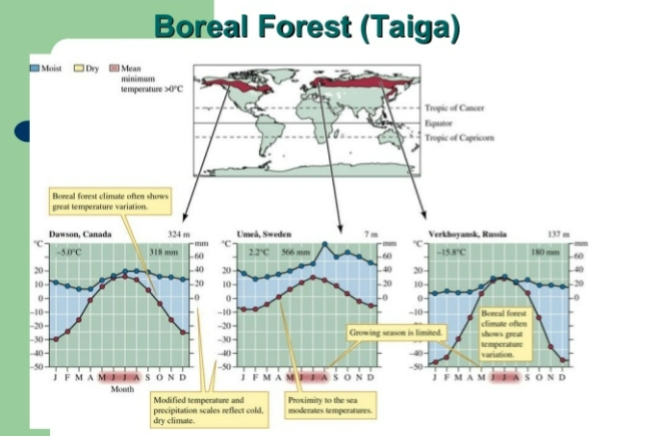
describe taiga/boreal forest (Weather, precipitation, temperature ranges)
Cold forests
100-200 cm of precipitation, minimal precipitation
Temperature ranges from 0 to -10*C
graph for grasslands
symmetrical bell-shaped graph, precipitation and temperature are basically the same line
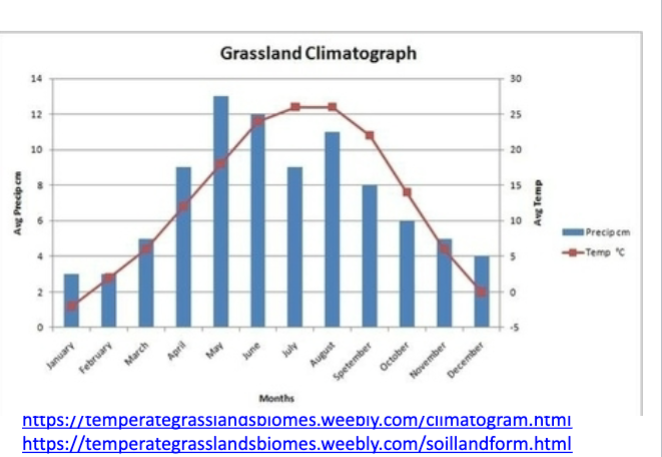
describe grasslands soil
Thick top soil
Fertile soil
Shaped by drought, fire, and grazing
Adaptations for Tropical rainforest
Plant drip tips
High rainfall
Raindrops runoff quickly
Sheds leaf of excess water
Prevents fungi and bacterial growth
Root buttresses (large, wide, and plank-like roots that project outward from the base of a tree trunk. They act as structural supports, preventing massive, shallow-rooted trees from toppling over in the thin, nutrient-poor soils typically found in tropical rainforests(
Nutrient-poor soil
Fertile layer at
surface level
Shallow root system
Lend support for tall
trees
Animal adaptations
Specialization
Diversity
Camouflage
Poisons & aposematic colors
Permeable skin
Long limbs & prehensile tails
Adaptations for desert
Drought avoidance strategies in plants
Annual life cycle
Perennials – unique adaptations
Leaf structures
Thick cuticle
Trichomes
Spines
Reduce number of stomata
CAM photosynthesis
Fleshy stems & leaves
Deep tap root
Animal adaptations
Avoid heat during day
Low rates of evaporation through skin
Concentrated urine
Produce dry feces
Live in burrows
Large ears
Reduce contact with hot sand
Nocturnal torpor (roadrunner)
Salt glands
Long legs
Moist food in diet
Tundra and ice cap adaptations
Blubber layer
Thick, insulating fur
Oils on skin and/or coats
Shorter legs & ears
Hibernation/burrowing
Countercurrent heat exchange
Production of antifreeze proteins
Hibernation
Winter coats with thick underfur that shed when weather warms