Thinking Like A Scientist
1/26
Name | Mastery | Learn | Test | Matching | Spaced |
|---|
No study sessions yet.
27 Terms
A comprehension test was given to students after they had studied textbook material either in silence or with the television turned on. What is the dependent variable?
The students' performance on the comprehension test
A comprehension test was given to students after they had studied textbook material either in silence or with the television turned on. What is the independent variable?
The studying conditions
Dependent Variable
The results
Independent Variable
The variable that is changed
Y-Axis
The lines on one side of the graph
Constant
The factors that don't change throughout the whole experiment
X-Axis
The bottom line on a graph
Step 3 of the Scientific Method
Hypothesis
Step 2 of the Scientific Method
Conduct background research
Step 4 of the Scientific Method
Develop an experiment
Step 1 of the Scientific Method
Ask a question
Step 5 of the Scientific Method
Collect data
Step 7 of the Scientific Method
Conclusion
Step 6 of the Scientific Method
Analysis
Workers at a company were assigned to one of two conditions: One group completed a stress management training program; and another group of workers did not participate in the training. The number of sick days taken by these workers was examined for the two subsequent months. What is the independent variable?
Participation in the stress management training program
Workers at a company were assigned to one of two conditions: One group completed a stress management training program; and another group of workers did not participate in the training. The number of sick days taken by these workers was examined for the two subsequent months. What is the dependent variable?
The number of sick days taken by the workers over the next two months
Students watched a cartoon either alone or with others and then rated how funny they found the cartoon to be. What is the independent variable?
Whether students watched the cartoon alone or with others (the viewing condition)
Students watched a cartoon either alone or with others and then rated how funny they found the cartoon to be. What is the dependent variable?
The rating of how funny the students found the cartoon
Some elementary school teachers were told that a child's parents were college graduates, and other teachers were told that the child's parents had not finished high school; they then rated the child's academic potential. What is the independent variable?
The education level of the child's parents
Some elementary school teachers were told that a child's parents were college graduates, and other teachers were told that the child's parents had not finished high school; they then rated the child's academic potential. What is the dependent variable?
The teachers' ratings of the child's academic potential
Students at a university were split into two groups and each received a different text for philosophy course. One group received a traditional textbook, while the other received an interactive textbook on a tablet computer. After the course, the final exam marks between the two groups of students were compared. What is the independent variable?
The type of textbook used
Students at a university were split into two groups and each received a different text for philosophy course. One group received a traditional textbook, while the other received an interactive textbook on a tablet computer. After the course, the final exam marks between the two groups of students were compared. What is the dependent variable?
The final exam marks of the students

What is the data represented along the x-axis?
The time of day

What is the data represented along the y-axis?
The angle of separation

What is the purpose of the key shown in this graph?
To show which colors match with the specific months
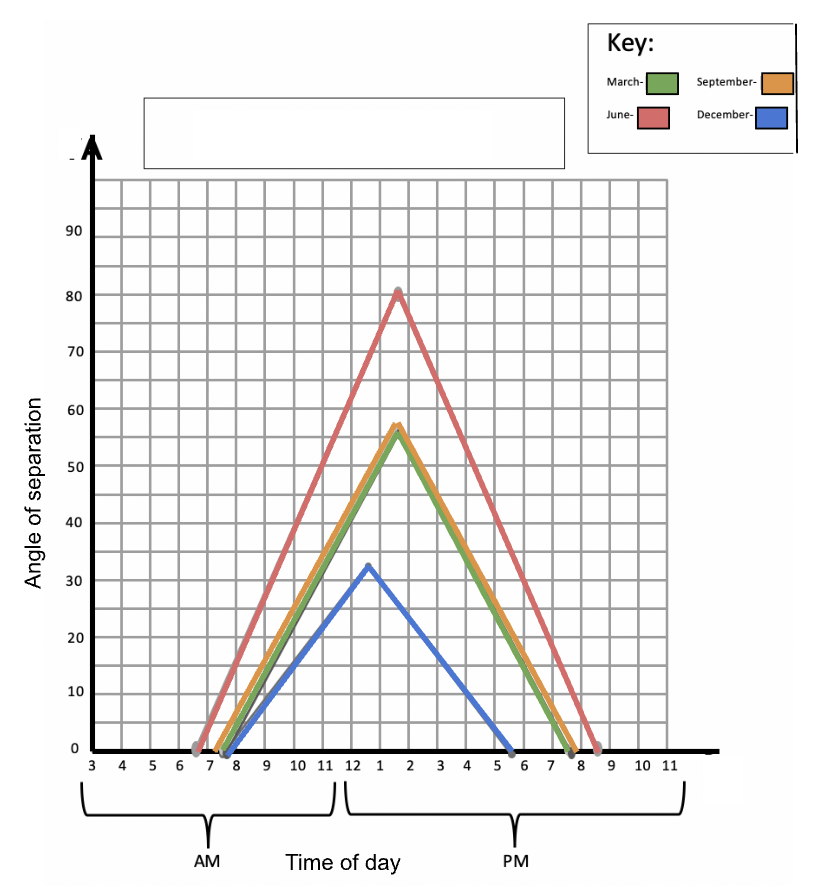
What can you conclude about what this graph is showing?
The angle of separation is highest during June and lowest during December

What is a good title for this graph?
The Angle of Separation throughout the Year