PSYCH 306 STATS
1/84
There's no tags or description
Looks like no tags are added yet.
Name | Mastery | Learn | Test | Matching | Spaced | Call with Kai |
|---|
No analytics yet
Send a link to your students to track their progress
85 Terms
What is an example of a theoretical construct operationalised as a measurable construct?
Theoretical construct
The thing you’re trying to take a measure of
cant be directly observed, often vague
age, gender, opinion
Measure
The mthod or tool used to make observations
question in a survey, behavioural observation, brain scan
Operationalisation
The logical connection between the measure and the theoretical construct
• the process by which we try to derive a measure from a theoretical construct
Variable
What we end up with when we apply our measure to something in the world
• the actual data we end up with in our data sets
dependent variable alt name
outcome variable
independent variable
predictor variable
Examples of experimental quantitative research
Between-groups/between-subjects/independent design
2 treatment groups given different treatments
Random assignment
Within-subject/repeated-measures design
Participants are given both treatments
Exploratory quantitative research
• Correlational/cross-sectional
• Avoids ethical concerns
No intervention; observation to find systematic differences
Sources of variation in the outcome measure
• Predictor variable
• BUT ALSO
• Measurement: error
○ Participant error
• Confounding factor
○ Largest source of concern
○ Another variable that systematically varies with variable of interest
• "noise" factors
○ Things which influence the outcome; does not systematically vary with the variable of interest
○ Independent from predictor
○ e.g demographics, SES
What are the three types of categorical measurement scales?
binary
nominal: named categories (car/bus/train)
ordinal: ranked order (low/medium/high)
What are the two types of quantitative measurement scales?
interval: Numeric scale with equal intervals, no true zero (e.g., temperature in °C, Likert scales, calendar years)
ratio: Numeric scale with equal intervals and a true zero (e.g., reaction time in ms, number of children)
What mathematical operations are valid for interval and ratio scales?
Interval: Can add and subtract, but not meaningfully multiply or divide
Ratio: Can add, subtract, multiply, and divide
Range
The difference between the highest and lowest values in a dataset.
IQR
The middle 50% spread of the data, showing the range between the 25th percentile (Q1) and 75th percentile (Q3).
What is standard deviation (SD)?
A measure of how spread out the values are around the mean
High SD = more spread out data
Low SD = more clustered around the mean
What are the main steps in NHST?
State the hypothesis
Null & Alternative Hypothesis Formulation
Determine the level of significance
Determine the Test statistics
Comput the test statistics
Clculate the p-value
Compare the p-value with the level of statistics
reject or fail to reject the null hypothesis
Power
The probability of correcty detecting a true effect (true positive)
determined by effect size and sample size
Significance level
The probability of a false positive when there is no effect really.
a = .05
What does a sampling distribution under the null hypothesis represent?
What does it mean if a test statistic is within the critical region of a sampling distribution?
It represents the distribution of possible test statistic values (like means, correlations, or group differences) that we would expect if the null hypothesis were true
tells us what values are likely or unlikely under “no effect” conditions
Null hypothesis
The null hypothesis (H₀) is the default assumption that there is no effect, no difference, or no relationship between variables.
What is a “critical region” in hypothesis testing?
A critical region contains test values so extreme that they are unlikely under the null hypothesis
if the test statistic falls into this region, we reject the null
What does a significance level (e.g., α = 0.05) mean?
It is the threshold for statistical significance. α = 0.05
there is a 5% chance of observing the result as extreme as the one we got, if the null hypothesis is true
What’s the difference between one-sided and two-sided tests?
One-sided test: Critical region is on one side → used for directional hypotheses.
Two-sided test: Critical regions on both sides → used for non-directional hypotheses (most common).
What is a p-value?
The probability of getting a test statistic as extreme (or more) as the one observed, if the null hypothesis is true
Low p-value (e.g., < 0.05) → result is significant → reject H₀.
CHECKS IF RESULT IS SIGNIFICANT
What is “effect size” in statistics?
A measure of how big a difference or effect is, regardless of significance?
helps find practical significance
What is Cohen’s d and how is it interpreted?
measures effect size for group differences
Small = 0.2
Medium = 0.5
Large = 0.8+
What does “power” mean in hypothesis testing?
Power = 1 − β
the probability of detecting a true effect (true positive)
aim for power = 0.8 (80%)
What affects statistical power?
Sample size (↑ size = ↑ power)
Effect size (larger effects = easier to detect)
Significance level (α) (higher α = more power)
Variability in the data (less variability = more power)
What is the purpose of a power analysis?
To determine one of the following (given the other 3):
Required sample size
Power of the test
Effect size
Significance level (α)
Used to design statistically sound experiments.
What trade-offs are revealed in a power analysis?
Low power → more false negatives (Type II errors)
Small α → fewer false positives (Type I errors) but lower power
Bigger sample = more power, but costlier
You must balance power, α, sample size, and effect size.
How many types of t test are there and what are they used for?
one-sample
independent samples
paired samples
When is a one-sided or two-sided test used
One-sided test: Used when you only care about effects in one direction (e.g., vocabulary is higher than average).
Two-sided test: Used when any difference matters (e.g., vocabulary is higher or lower).
When should a one-sample t-test be used?
When comparing the mean of a sample to a known population mean using one continuous variable
Q: does the mean differ from the expected (null) value)?
What are example hypotheses in a one-sample t-test about vocabulary size?
H₀: Mean vocabulary of multilingual 2-year-olds = 300 words
H₁: Mean vocabulary ≠ 300 words
What assumptions must be met for a one-sample t-test?
data must be normally distributed (check with Shapiro-Wilk test)
Observations must be independent
How do you check for normality in t-test assumptions?
A: Use the Shapiro-Wilk test.
If non-significant (p > 0.05), normality is assumed and t-test can proceed.
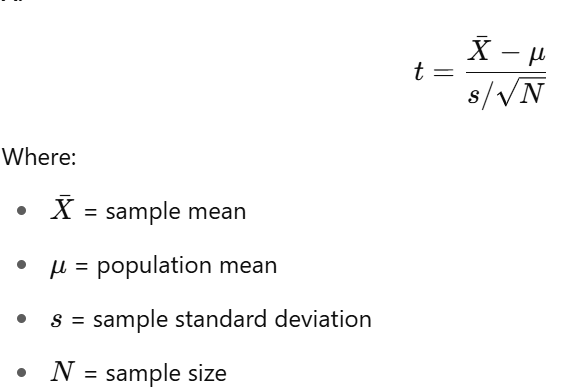
what is the formula for a one-sample t-statistic?
what are the degrees of freedom ina one-sample t-test?
df=N−1
The number of independent values that can vary while keeping the sample mean fixed.
Should you calculate effect size when the result is not significant?
Not necessary, but can be informative. However, it’s not required if p > 0.05 and no significant effect is detected.
What should you do if your data do not meet t-test assumptions?
e.g data is not normally distributed (checked using Shapiro-Wilk)
Use non-parametric test altertaives like the Wilcoxon signed-rank test, especially when normality is violated
What is the Wilcoxon signed-rank test and when is it used?
used when comparing a sample to a known value without assuming normality
ranks the absolute differences between values and the hypothesised value
assesses if the positive and negative ranks differ significantly
What are the pros and cons of non-parametric tests?
PRO: Don’t assume normal distribution
CON: Generally less powerful, may fail to detect small effects
Independent samples t-test
Use when comparing two separate groups.
What are the assumptions of an independent-samples t-test?
DV is continuous
groups are indpendent
normally distributed
Homogeneity of variance (check with Levene’s test)
Paired (repeated) t-test
Use when measurements are from the same individuals at two time points or matched pairs.
Paired (repeated) t-test Assumptions
Dependent variable is continuous
Pairs are dependent (e.g., same person at T1 and T2)
The difference scores between paired values are normally distributed
Why can’t you use a t-test on a categorical variable with 3 or more levels?
T-test only compare 2 groups
If your categorical variable has 3+ levels, doing multiple t-tests leads to multiple comparisons, increasing the risk of Type 1 error (false positive)
What is the risk of doing multiple t-tests when comparing more than two groups?
Multiple comparisons inflate the probability of a false positive
For example, running 10 tests creates a ~40% chance of at least one false positive, much higher than the intended 5% (α = 0.05).
What statistical test should be used when comparing means across 3 or more groups?
ANOVA (analysis of variance), an omnibus test that evaluates all group differences simultaneously, avoiding multiple comparisons
What is the null hypothesis in ANOVA?
All group means are equal
no effect of group membership on the outcome variable
What does ANOVA test for?
Whether there is significant variation between group means compared to within-group variability
it tells you if at least one group differs significantly
What are the two main sources of variability in ANOVA?
Between-group variability: differences in group means (explained by predictor)
within-group variability: differences within each group (residual or unexplained variation)
What is the F-statistic in ANOVA?
A ratio:
F = (Between-group variance) / (Within-group variance)
a higher F means group membership explains more of the variability in the outcome
What does a high F-statistic indicate?
Group differences are large relative to within-group variabilty, suggesting that group membership matters
Why is the F-statistic always positive?
Because both variances (numerator and denominator) are squared quantities, the ratio cannot be negative
—> ANOVA is a non-directional test
Can ANOVA detect which specific groups are different?
No, ANOVA tells you at least one group is different
must use post hoc tests like Tukey’s HSD to identify which groups
What part of the distribution does ANOVA use to test significance?
The upper tail of the F-distribution
Because the F-statistic is always positive, the test is one-sided (but non-directional).
What is "residual variation" in ANOVA?
Within-group variability —- the part of the outcome not explained by group membership
What does a significant ANOVA result (p < 0.05) mean?
The observed differences in groups are unlikely due to chance, and that group membership has a significant effect on the outcome.
What is a one-way ANOVA used for?
Used when you have one categorical predictor (with 2+ levels) and a continuous outcome, and data for each group comes from different individuals
What are residuals in ANOVA?
Residuals = Differences between each data point and its group mean
They represent within-group variation, also called error or unexplained variance.
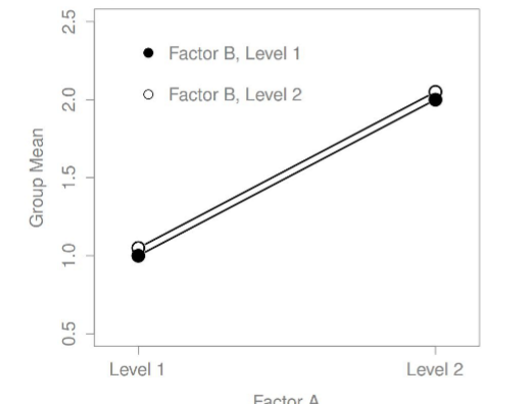
One main effect, no interaction
Two main effects, no interaction
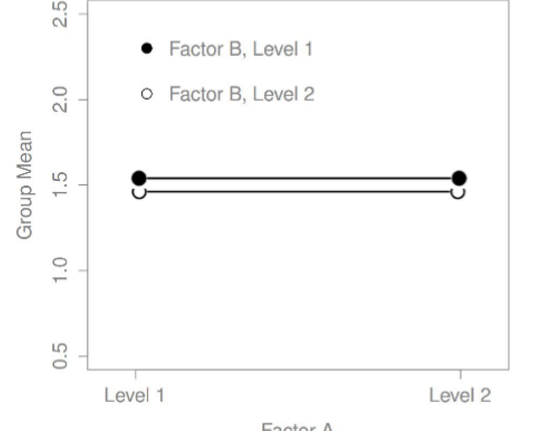
No main effect, no interaction
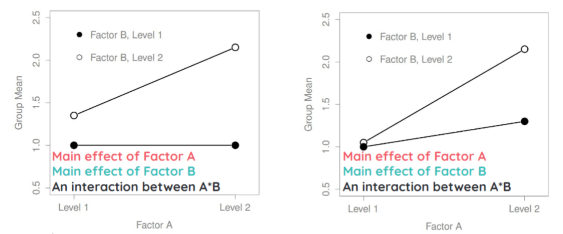
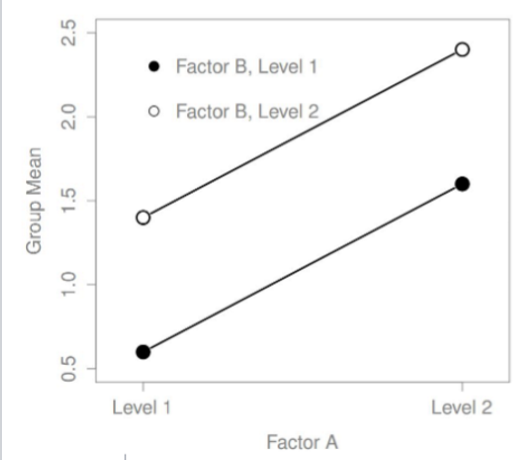
Two main effects and an interaction
How can you follow up on a significant interaction in factorial ANOVA
The effect of Factor A (e.g., age) within each level of Factor B (e.g., workplace)
OR the effect of Factor B within each level of Factor A
Choose the version that best explains how the interaction depends on one factor.
ANOVA fix: Observations not independent
Use Repeated Measures ANOVA
ANOVA fix: Residuals not normally distributed
Use a non-parametric test (e.g. Kruskal-Wallis)
ANOVA fix: Unequal variances across groups
Use Welch’s ANOVA
ANOVA fix: Unequal group sizes
Not a strict violation, but reduces power
What is Levene’s Test used for in ANOVA?
Checks for homogeneity of variance — whether group variances are equal, an assumption of standard ANOVA
What is the effect size in ANOVA?
Quantifies the strength of the group differences. Common measures include:
Eta squared (η²)
Partial eta squared
These describe the proportion of total variance explained by group membership.
What is power in the context of ANOVA
Power = 1 – β
It is the probability of correctly detecting a true effect, and depends on:
Sample size
Effect size
Significance level (α)
Three-way ANOVA
3 categorical predictors
1 continuous outcome
Does life satisfaction differ across people in different occupations, countries, and age groups?
MANOVA
Used when there are:
2+ continuous dependent variables
1+ categorical independent variables
CORRELATION!
Do life satisfaction, self-esteem, and/or some combination of them differ across people in different occupations
ANCOVA
1+ continuous categorical predictor
1 continuous outcome
1+ continuous nuisance variables
does life satisfaction differ across people in different occupations, after controlling for the effects of income and health
MANCOVA
1+ categorical predictor
Multiple continuous outcomes
1+ continuous nuisance variables
Do life satisfaction, self-esteem, and/or some combination of them differ across people in different occupations, after controlling for the effects of income and health
ANOVA Power (1 - B)
The probability of correctly detecting a true effect (true positive)
determined by effect size & sample size
ANOVA significance level (a)
he probability of a false positive when there is no effect really
set at an acceptable level = 0.05
What is the Bonferroni correction?
A method for adjusting the significance threshold when running multiple tests:
α' = α / number of tests
Example: If α = 0.05 and 10 tests, α' = 0.005
Law of large numbers
A statistic (e.g mean) calculated from a sample approaches its true value in the whole population as the sample size gets larger
95% confidence interval (of the mean)
a range within which the true population vlue falls 95% of the time
(i.e. if you collect 100 samples and calculate CIs, 95% of those CIs contain the true mean)
Central Limit Theorem
The distribution of a sample means approaches a normal distribution as the sample size gets larger