Robotics reviewer
1/115
There's no tags or description
Looks like no tags are added yet.
Name | Mastery | Learn | Test | Matching | Spaced |
|---|
No study sessions yet.
116 Terms
internet of things (IoT)
is the network of physical objects- devices, vehicles, buildings, and other items embedded with electronics, software, sensors, and network connectivity - that enables these objects to collect and exchange data.
Kevin Ashton
he coined the term ‘internet of things’ in 1999
Internet of Things (IoT)
it is a device that collect and transmit data via the internet
2.5 Billion Gigabytes
how many data is generated per day?
Data
it can be any unprocessed fact, value, text, sound, or picture that is not being interpreted and analyzed
Data
the raw facts and figures
Structure
how the data is presented
context
an environment where our prior knowledge and understanding can make sense of data
meaning
data in the correct structure and placed within context
knowledge
the application of information to a solution
text, graphics, sound, moving images
4 types of data representation
information
data that has been interpreted and manipulated and now has some meaningful inference for the users
knowledge
combination of inferred information, experiences, learning, and insights. results in awareness or concept building for an individual or organization
numeric data
if a feature rerpresents a characteristic measured in numbers it is called a numeric feature
categorical data
a categorical feature is an attribute that can take on one of the limited, and usually fixed number of possible values on the basis of some qualitative property
nominal feature
a categorical feature is also called as?
ordinal data
this denotes a nominal variable with categories falling in an ordered list. examples include clothing sizes such as small, medium, and large or a measurement of customer satisfaction on a scale from “not at all happy” to “very happy”
volume
scale of data. with the growing world population and technology at exposure, huge amounts of data are being generated each and every millisecond.
variety
different forms of data - healthcare, images, videos, audio clippings
velocity
rate of data streaming and generation
value
meaningfulness of data in terms of information that researchers can infer from it
veracity
certainty and correctness in data we are working on
structured data
is quantitative data in form of numbers and values
unstructured data
qualitative data in form of text files, audio files, video files.
data science
it is an interdisciplinary field of scientific methods, processes, algorithms, and systems to extract knowledge or insights from data in various forms either structured or unstructure
artificial intelligence
a branch of computer science dealing with the simulation of intelligent behavior in computers
artificial intelligence
a program that can sense, reason, act, and adapt
artificial intelligence
is the programmed reasoning and thinking skills applied to machines to mimic human or animal intelligence.
artificial intelligence
The science and engineering of making intelligent machines, especially intelligent computer programs
artificial intelligence
is an approach to make a computer a robot or a product think how smart humans think
Blaise Pascal
first mechanical, calculating machine built by French mathematician and inventor?
Charles Babbage and Ada Lovelace
first design for your programmable machine is done by?
Warren McCullach and Walter Pitts
Foundations of neural networks established by __________ drawing parallels between the brain and computing machines
Alan Turing
he introduced a test, which is the Turing test, as a way of testing a machine intelligence
ELIZA
_____ is a natural language program that is created. it can handle dialogue on any topic similar in concept of today’s chatbots
Edward Feigenbaum
he creates expert systems which emulate the decisions of human experts
Deep Blue
beats the world chess Garry Kasparov
Roomba
it is an autonomous vacuum cleaner that avoids obstacles
2009
in this year, Google builds the first self driving car to handle urban conditions
AlphaGo
Beats the professional goal player Lee Sedol 4-1
1955
The year where the term artificial intelligence is used for the first time
Arthur Samuel (1959)
he described machine learning as the field of study that gives computers ability to learn without being explicitly programmed
Machine Learning
is the study of programs that are not explicit program but learn patterns as they are exposed to more data over time
Machine Learning
using data to answer questions
Deep Learning
Machine learning that involves using very complicated models called deep neural networks
Deep learning
models that determine the best representation of original data; in classic machine learning humans must do this
Target
predicted category or value of the data
Features
properties of the data use for prediction,(non-target columns)
Label
The target value for a single data point
Supervised learning
use labeled training data to infer model
Regression
predicts continuous valued output
Classification
predicts a discreet valued output
training
Feed training data to learning algorithm
Testing
test the model, using testing set and obtain the predictions based on the trained model
Accuracy
calculated as the number of all correct predictions divided by the total number of the dataset
Recall or Sensitivity
measures the percentage of the actual positive class that is correctly predicted
Precision
Measures the percentage of the predicted positive class that is correct
Specificity
is concerned with how correctly the actual negative class is predicted
F1 Score
is the harmonic mean. it is a nice metric because it uses precision and recall.
Receiver Operating Characteristic Curve
what is the meaning of ROC curve
Mean Squared Error (MSE)
is the mean absolute error. It is the average of the squid aid that is used as the loss function for least squares regression.
Mean Absolute Error (MAE)
it evaluates the absolute distance of the observations (the data set entries) to the predictions on a regression, taking the average of the overall observations
Mean Absolute Percentage Error (MAPE)
is the mean of all absolute percentage errors between the predicted and actual values.
Root Mean Square Error (RMSE)
is the standard deviation of the errors which occur when a prediction is made on a dataset.
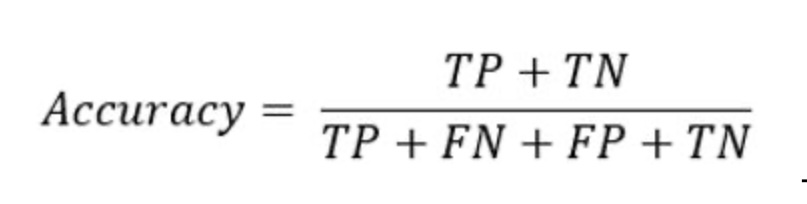
formula for accuracy
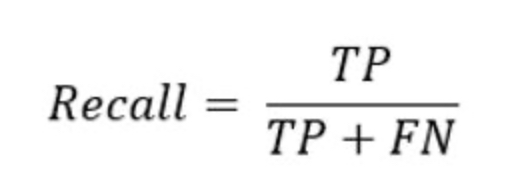
formula for recall
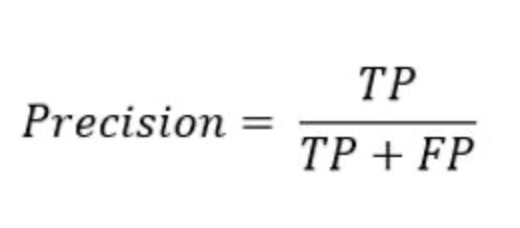
formula for precision
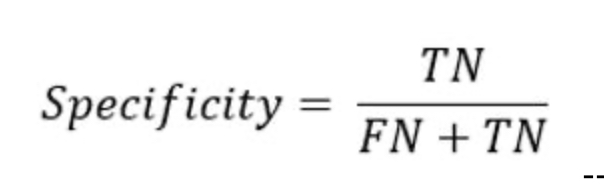
formula for specificity
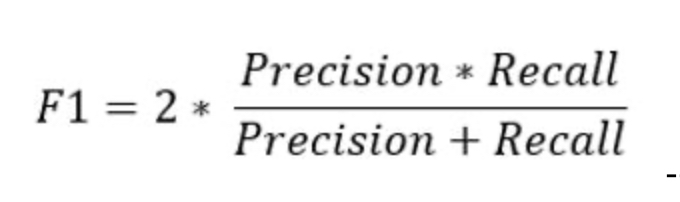
formula for f1 score
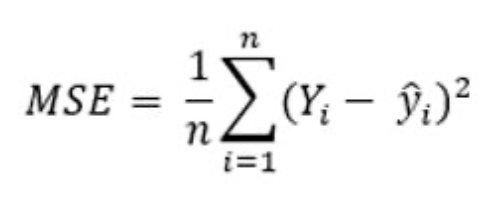
formula for Mean Squared Error
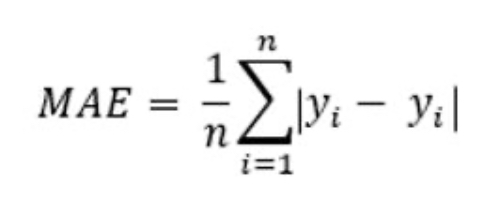
formula for Mean Absolute Error
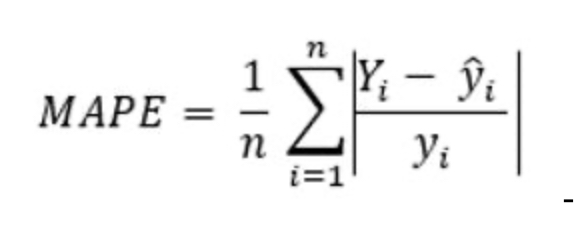
formula for Mean Absolute Percentage Error
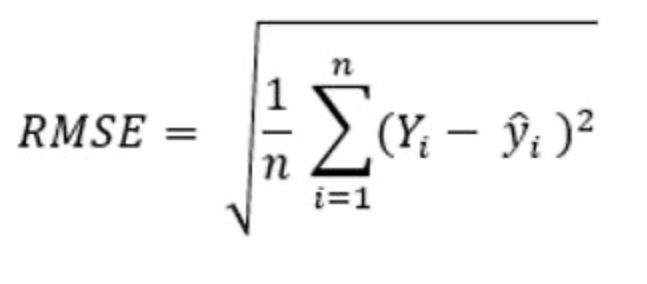
formula for Root Mean Square Error
Anaconda
is a distribution of the Python and R programming languages for scientific computing that aims to simplify package management and deployment
Python
It’s a popular programming language that was created by Guido Van Rossum and released 1991. It is an interpreted, high-level general, purpose, programming language. It’s language constructs, as well as its object oriented approach aim to help programmers write clear, logical code for small and large scale projects.
Scientific Python Development Environment
meaning of Spyder
SPYDER
A powerful Python IDE with advanced editing, interactive, testing, debugging, and introspection features
JupyterLab
is a next generation web based user interface for project Jupyter
Jupyter Notebook
it is a web based interactive computing notebook environment. Edit and run human readable documents while describing the data analysis.
Colab
I love you to write an execute python in your browser with zero configuration required, access to GPUs fee of charge and EC sharing
Keras
is an advanced programming interface (API) that works for the Tensorflow library.
Matplotlib
is a library that helps with the visualization and plotting
NumPy
Is one of the first libraries that worked with data science. You can use it for mathematical and statistical functions using large n-arrays or multi dimensional matrices.
Numerical Python
what is the meaning of NumPy
Pandas
is another library in Python for data science derived from NumPy
Python Data Analysis
what is the meaning of Pandas
Pytorch
it is a deep learning framework from Facebook’s AI research group.
Tensorflow
it also helps with building neural network
Pandas
it is an open source Python library, providing high performance, data manipulation, and analysis tool, using its powerful data structures
NumPy
it is a Python used for working with arrays. it also has functions for working in domain of linear algebra, fourier transform, and matrices.
Matplotlib
it is a comprehensive library for creating static, animated and interactive visualization in Python.
Seaborn
it is a python data decision library based on matplotlib. it provides a high-level interface for drawing attractive and informative statistical graphics.
Area
it displays graphically quantitative data.
bar plots
it it represents categorical data with rectangular bars with height or lengths proportional to the values that they represent
histogram
it is a plot that helps you discover and show the underlying frequency distribution of a set of continuous data.
line plot
it shows the frequency of data along the number line. It is best to use when a data is time series.
scatter plots
used when you want to show the relationship between two variables
box plots
it is a plot which a rectangle is drawn to represent the second and third quartile, usually with a vertical line to indicate the median value.
hexagonal bin plot
it is another way to manage the problem of having too many points that start to overlap.
kernel density estimation plot
it is a technique that lets you create a smooth curve give a set of data