Poverty and inequality
1/22
There's no tags or description
Looks like no tags are added yet.
Name | Mastery | Learn | Test | Matching | Spaced | Call with Kai |
|---|
No study sessions yet.
23 Terms
Absolute poverty
When a person has insufficient resources to meet basic human needs, e.g food, shelter and clothing.
Relative poverty
When a person’s income is lower than the average in that country/society.
Current international poverty line
$3.00 per person per day (Set by the world bank)
Measuring relative poverty
A poverty line is set, which is a percentage of average income.
Commonly, these poverty lines range from 40-70% of household income.
In the EU, people falling below 60% of median income are said to be at risk of poverty.
Problems with the concept of relative poverty
It is highly subjective
It changes overtime
It cannot be used to make international comparisons
Measures of poverty
The UN human poverty index
Ratio method
The versions of the UN human poverty index
HPI-1
HPI-2
Both of these are composite measures which combine components such as life expectancy, literacy rates, long-term unemployment and relative income.
HPI-1
Used for poorest countries
Focuses on basic deprivations like not living long, not being able to read/write and lack of basic necessities.
HPI-2
Used for developed countries.
Includes relative measures such as inequality, unemployment and relative income because absolute deprivation is less common
Composite measure
Measurements based on multiple data items.
Causes of changes in absolute poverty and relative poverty
The level of Indebtedness
The level of unemployment
Health or education
Access to public services
The state of the economy and real incomes
Distribution of income
Income
A flow concept, the money earned by a person over a period of time
Wealth
The stock of assets a person owns
Income inequality
The unequal distribution of earnings between individuals
Wealth inequality
Difference in the value of stocks of assets owned by individuals
The Lorenz curve
A graphical representation of income distribution
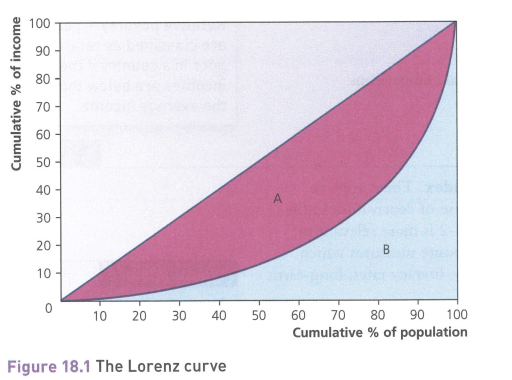
The Gini coefficient
A numerical calculation of inequality based on the Lorenz curve
A value of 0 being perfect equality
A value of 1 being perfect inequality
Gini coefficient formula
G= A/A+B
A represents the diagonal line between the Lorenz curve
B represents the area under the Lorenz curve
It can be represented as a percentage by multiplying it by 100 after the result
Causes of income inequality and wealth inequality within countries
Globalisation
Education, training and skills
Wage rates
Strength of trade unions
Degree of employment protection
Social benefits
The progressiveness of the tax system
Causes of income inequality and wealth between countries
Natural resources
Geography
History (Colonialism)
Political stability
Macroeconomic policies
Amount of FDI by foreign countries
Degree of technological change
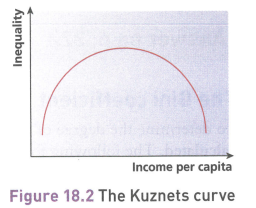
Impact of economic change and deveSlopment on inequality - The Kuznets curve
When an economy is at the early stage of development, and primarily agricultural, there is low inequality
Industrialisation results in increased inequality, but at some point it starts to decrease
Significance of capitalism for inequality
This usually contributes towards inequality due to the difference in the amount of resources owned by individuals