10 – Population Growth
1/20
There's no tags or description
Looks like no tags are added yet.
Name | Mastery | Learn | Test | Matching | Spaced | Call with Kai |
|---|
No analytics yet
Send a link to your students to track their progress
21 Terms
Intrinsic rate of growth r
Reproductive rate (R0) minus death rate. 3 Factors influencing the intrinsic rate of growth (r);Female fecundity, age at first birth, and mortality.
Example of r: Mice vs. Elephants
Mice have a higher $r$ because they have earlier reproduction and shorter generation times.
3 main types of population growth patterns
Exponential, Geometric, and Logistic growth.
Conditions for Exponential Growth
Unlimited resources and continuous reproduction with overlapping generations.
Exponential growth outcomes based on r
If r=0, size is constant; r>0, population increases; r<0, population declines to extinction.
Geometric Growth
Growth in "pulses" occurring in seasonal environments with non-overlapping generations.
λ (lambda) in geometric growth
The ratio of successive population sizes.
Exponential and Logistic Population Growth
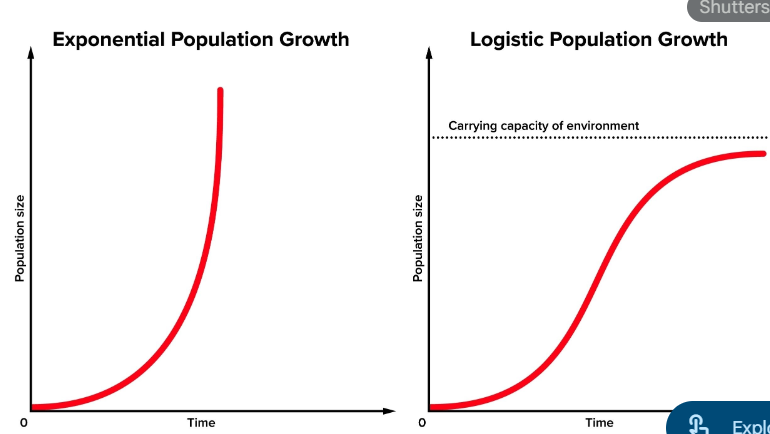
Logistic Growth
Growth that starts exponentially but slows and stabilizes at a carrying capacity (K), forming an S-shaped (sigmoid) curve.
3 Factors determining Carrying Capacity (K)
Habitat availability, resources, and disease.
Why do growth patterns differ?
Exponential assumes unlimited resources; Logistic accounts for limited resources; Geometric is for discrete (not continuous) reproduction.
Density-independent factors
Abiotic factors that limit growth regardless of population size (e.g., floods).
Density-dependent factors
Biotic factors that limit growth as population density increases (e.g., predators, disease).
Example: Galapagos finches
Rainfall correlates with food availability, which directly correlates with birth rates.
Human population distribution
Clumped distribution; highest abundance and density are found in Asia and coastal regions.
Bottom-heavy diagram
Indicates a high birth rate and a growing population.

Uniform/Columnar diagram
Indicates self-replacement where birth rates equal death rates.
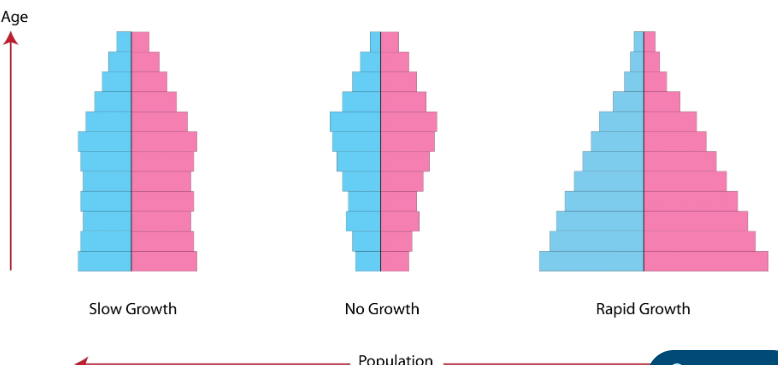
Narrow base diagram
Indicates a declining population due to low birth rates.

Global human population trend (2100)
Expected to decline due to aging populations and falling birth rates.
Comparison of birth rates (1963 vs. 2023)
Global births per woman dropped from approximately 5.3 to 2.2.
Future country projections
China is projected to decline by ~50%, while India and Nigeria are projected to increase.