PSYASS 2 - 7 Utility
1/45
Earn XP
Description and Tags
Name | Mastery | Learn | Test | Matching | Spaced |
|---|
No study sessions yet.
46 Terms
Utility
refers to the usefulness or practical value of a test in improving decision-making efficiency
Concept of Utility
not limited to tests alone but can also extend to training programs and interventions audiences
Factors that Affect a Test’s Utility (5)
Psychometric Soundness
Costs
Benefits
Selection Ratio
Base Rates of Success
Psychometric Soundness
Factors that Affect a Test’s Utility
Reliability: A test must give consistent results over time.
Validity: A test must measure what it is supposed to measure.
Costs
Factors that Affect a Test’s Utility
test can be expensive in terms of money, time, and resources
Benefits
Factors that Affect a Test’s Utility
A test’s benefits should outweigh its costs
Selection Ratio
Factors that Affect a Test’s Utility
the selection ratio is the number of job openings vs. applicants
Base Rate of Success
Factors that Affect a Test’s Utility
base rate refers to how many people succeed without testing
Utility Analysis
a family of cost-benefit techniques used to evaluate the effectiveness of a test, training program, or intervention
Types of Utility (3)
Expectancy Data Analysis
Cost-Benefit Models
Productive Gain Analysis
Expectancy Data Analysis
Types of Utility
converts test data into probability tables to predict performance outcomes
Cost-Benefit Models
Types of Utility
compare the financial benefits of using a test versus the costs of administering it
Productivity Gain Analysis
Types of Utility
assess how much work output improves due to testing
Market Analysis and Targeting
Process
analyze market trends, consumer behavior, and competitors to gain a better understanding of the local market and potential opportunities
Content Creation and Marketing
Process
generating messages that connect, motivate action and allow you to engage with your target audience on a personal level
Process
Process
in an increasing digitally connected world, it is important for local producers to harness the power of digital marketing to compete effectively; through this project, we hope to make a positive contribution to local economic development and strengthen the identity of local products in the digitally connected global market
How Utility Analysis is Conducted (6)
Expectancy Data
Taylor-Russel Tables
Naylor-Shine Tables
The Brogden-Cronbach-Gleser Formula
Productivity Gain
Decision Theory and Test Utility
Expectancy Data
How Utility Analysis is Conducted
an expectancy table can provide an indication of the likelihood that a test taker will score within some interval of scores on a criterion measuring an interval that may be categorized as “passing,“ “acceptable,“ or “failing”
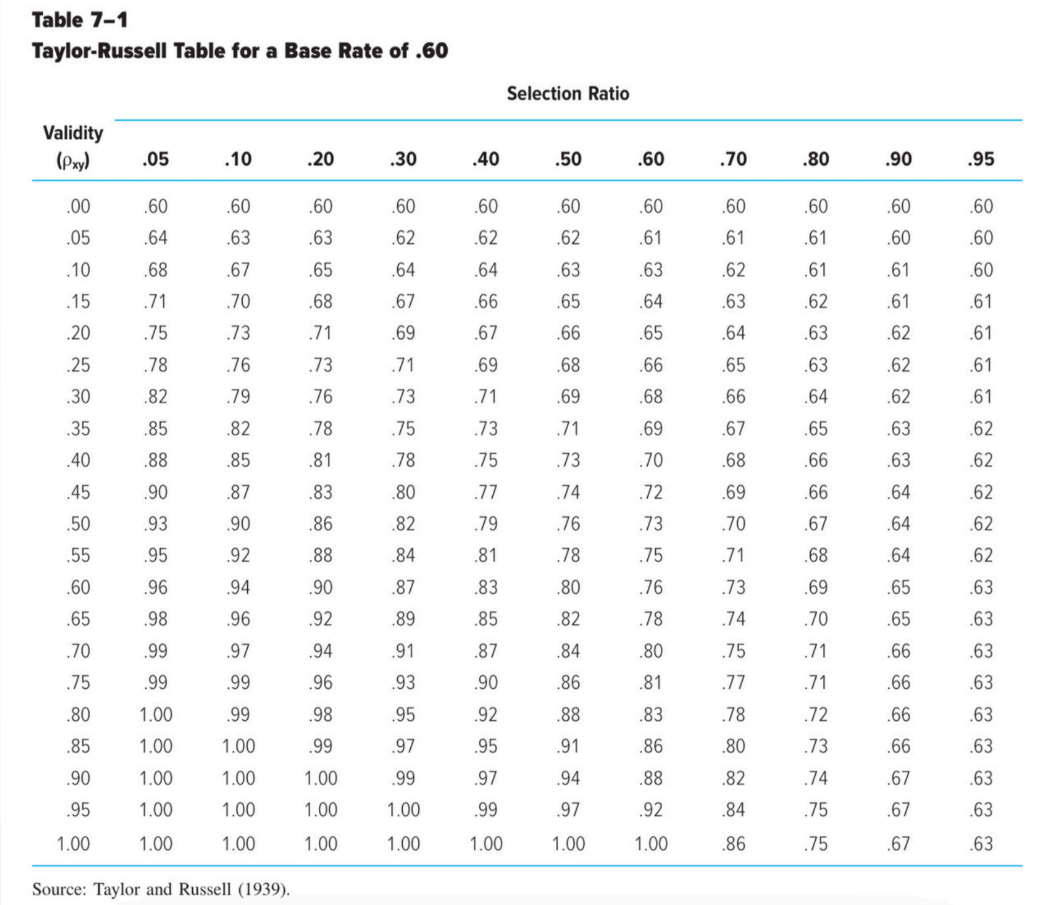
Taylor-Russell Tables
How Utility Analysis is Conducted
provide an estimate of the extent to which inclusion of a particular test in the selection system will improve selection
validity coefficient
Taylor-Russell Tables
the value assigned for the test’s validity is the computed ________ ___________
Selection Ratio
Taylor-Russell Tables
is a numerical value that reflects the relationship between the number of people to be hired and the number of people available to be hired
Base Rate
Taylor-Russell Tables
refers to the percentage of people hired under the existing system for a particular position
Naylor-Shine Tables
How Utility Analysis is Conducted
entails obtaining the difference between the means of the selected and unselected groups to derive an index of what the test (or some other tool of assessment) is adding to already established
The Brogden-Cronbach-Gleser Formula
How Utility Analysis is Conducted
the independent work of Hubert E. Brodgen (1949) and a team of decision theorists
used to calculate the dollar amount of a utility gain resulting from the use of a particular selection instrument under specified conditions
Utility Gain
The Brogden-Cronbach-Gleser Formula
refers to an estimate of the benefit (monetary or otherwise) of using a particular test or selection method
Productivity Gain
The Brogden-Cronbach-Gleser Formula
refers to an estimated increase in work output
Decision Theory and Test Utility
How Utility Analysis is Conducted
Cronbach and Gleser (1965)
a classification of decision problems
various section strategies ranging from single-stage processes to sequential analyses
a quantitative analysis of the relationship between utility, the section ration cost of the testing program and expected value of outcome and;
a recommendation that in some instances job requirements be tailored to the applicant’s ability instead of the other way around
Vapor Test (VT)
Decision Theory and Test Utility
designed to determine if alive and well subjects are indeed breathing
Practical Consideration (3)
Pool of Job Applicants
The Complexity of the Job
The Cut Score in Use
Pool of Job Applicants
Practical Consideration
some utility models are based on the assumption that there will be a ready supply of viable applicants from which to choose and fill positions
some jobs require such expertise or sacrifice that the pool of qualified candidates may be very small
the economic climate also affects the size of the pool
top performers on a selection test may not accept a job offer
The Complexity of the Job
Practical Consideration
the same kind of utility models are used for a variety of positions, yet the more complex the job, the bigger the difference in people who perform well of poorly
as job complexity increases, the range of variation in performance between individuals becomes more significant; while utility analysis uses standardized models to measure factors like skills, satisfaction, and job fit, these models become less accurate as the complexity of the job rises
The Cut Score in Use (6)
Practical Consideration
Cut Score
Relative cut score
Norm-referenced cut score
Fixed cut score
Multiple cut score
Multiple hurdles
Cut Score
The Cut Score in Use
is a predetermined threshold used to decide whether an individual meets the minimum required standards or qualifications for a particular job or assessment
Relative Cut Score
The Cut Score in Use
is based on the performance of other individuals; instead of setting an absolute standard, this cut score is determined by comparing the test scores or performance levels of all candidates in the pool
Norm-referenced Cut Score
The Cut Score in Use
is determined by comparing an individual’s performance to a pre-established group, or “norm group," often a previous set of candidates; the cut score could be set based on the percentiles or ranking within the norm group
Fixed Cut Score
The Cut Score in Use
is a constant threshold that does not change, regardless of the performance of others or the difficulty of the test
Multiple Cut Scores
The Cut Score in Use
the use of multiple cut scores for a single predictor for the purpose of categorizing test takers; refer to several thresholds set for different stages or aspects of a selection process
Multiple hurdles
The Cut Score in Use
involve a series of stages in which candidates must meet or exceed specific cut scores at each stage to proceed to the next
Methods for Setting Cut Scores (7)
Angoff Method
Known Groups Method
IRT-Based Methods
Item Mapping Method
Bookmark Method
Method of Predictive Yield
Discriminant Analysis
Angoff Method
Methods for Setting Cut Scores
the judgements of the experts are averaged to yield cut scores for the test
can be used for personnel selection based on traits, attributes, and abilities
problems arise if there is disagreement between experts
Known Groups Method
Methods for Setting Cut Scores
entails collection of data on the predictor of interest from groups know to possess, and not to possess, a trait, attribute, or ability of interest
based on the analysis of data, a cut score is set on the test that best discriminates the groups’ test performance
there is no standard set of guidelines for choosing contrasting groups
IRT-Based Methods
Methods for Setting Cut Scores
in an IRT framework, each item is associated with a particular level of difficulty
in order to “pass" the test, the test taker must answer items that are deemed to be above some minimum level of difficulty, which is determined by experts and serves as the cut score
allow for more precise and flexible cut scores because they take into account both difficulty of test items and the abilities of the test takers, making it possible to set cut scores that are tailored to different levels of difficulty and candidate abilities
Item Mapping Method
Methods for Setting Cut Scores
involves mapping the items of a test to specific levels of proficiency or performance; this method is based on the idea that certain test items correspond to different levels of competency or job-related skills
Bookmark Method
Methods for Setting Cut Scores
is a judgmental approach where experts (usually subject matter experts) review test items and decide the point at which candidates should be considered proficient; the experts “place a bookmark" at the point where the test items transition from being relatively easy to difficult, indicating the level of performance needed to pass
Method of Predictive Yield
Methods for Setting Cut Scores
R. L. Thorndike (1949) proposed a norm-referenced method called the method of predictive yield
the method took into account the number of positions to be filled, projections regarding the likelihood of offer acceptance, and the distribution of applicant scores
Discriminant Analysis
Methods for Setting Cut Scores
a family of statistical techniques used to shed light on the relationship between identified variables (such as scores on a battery of tests) and two (or more) naturally occurring groups (such as persons judged to be successful at a job and persons judged unsuccessful at a job)