Command of evidence: quantitative

0.0(0)
Studied by 0 people
call kaiCall Kai
Locked
learnLearn
examPractice Test
spaced repetitionSpaced Repetition
heart puzzleMatch
flashcardsFlashcards
GameKnowt Play
Card Sorting

1/9

encourage image

There's no tags or description

Looks like no tags are added yet.

Last updated 10:19 PM on 9/25/26
Name
Mastery
Learn
Test
Matching
Spaced
Call with Kai
Chat

No analytics yet

Send a link to your students to track their progress

10 Terms

1
New cards
<p>A) <span>less than 20% urban in 1970 to more than 50% urban in 2020.</span></p><p><span>B) less than 40% urban in 1970 to around 90% urban in 2020.</span></p><p><span>C) around 40% urban in 1970 to more than 70% urban in 2020.</span></p><p><span>D) around 50% urban in 1970 to around 90% urban in 2020.</span></p>

A) less than 20% urban in 1970 to more than 50% urban in 2020.

B) less than 40% urban in 1970 to around 90% urban in 2020.

C) around 40% urban in 1970 to more than 70% urban in 2020.

D) around 50% urban in 1970 to around 90% urban in 2020.

C
2
New cards
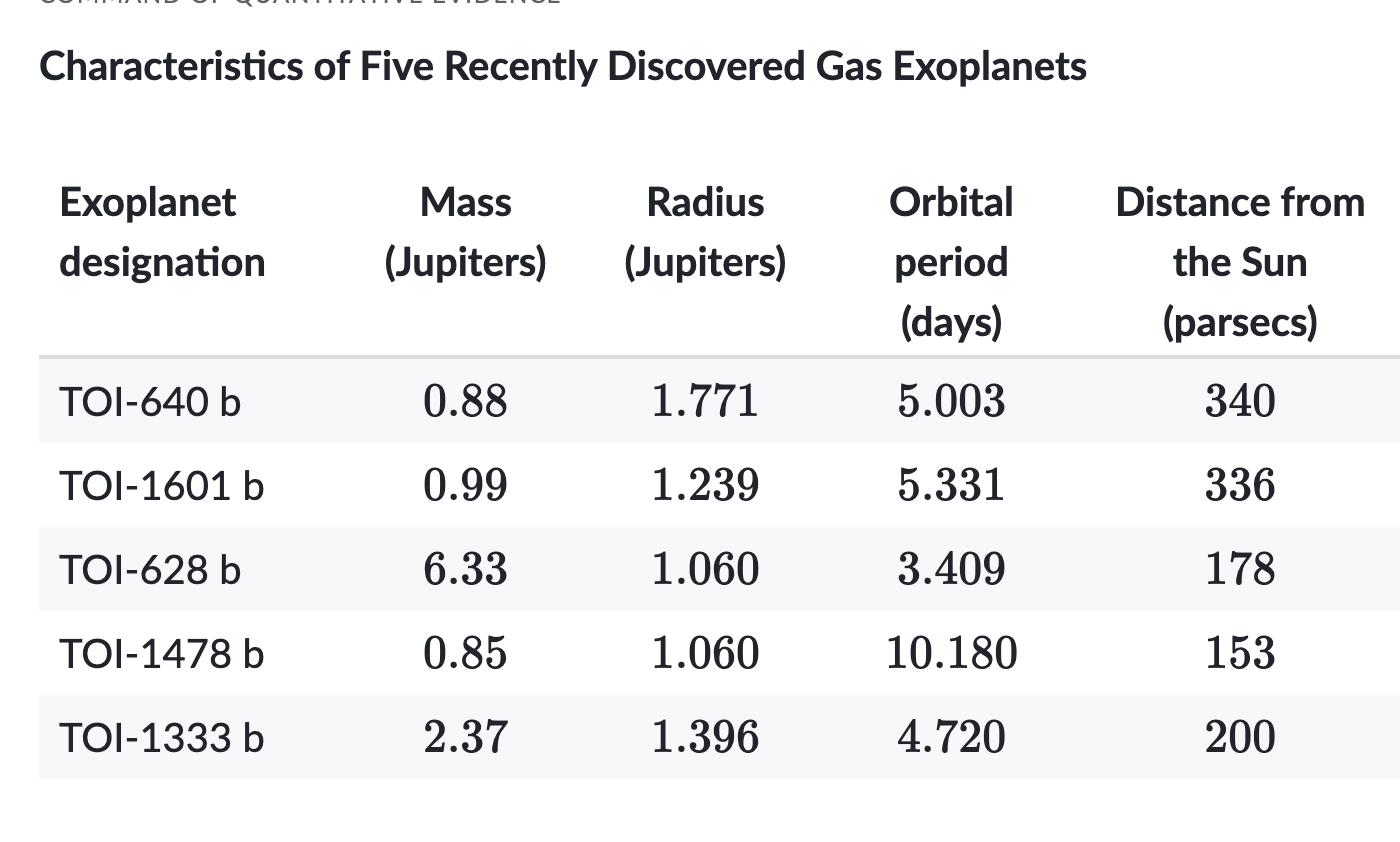
<p>“Hot Jupiters” are gas planets that have a mass of at least 0.25 Jupiters (meaning that their mass is at least 25% of that of Jupiter) and an orbital period of less than 10 days (meaning that they complete one orbit around their star in less than 10 days), while “warm Jupiters” are gas planets that meet the same mass criterion but have orbital periods of more than 10 days. In 2021, Michigan State University astronomer Joseph Rodriguez and colleagues announced the discovery of five new gas exoplanets and asserted that four are hot Jupiters and one is a warm Jupiter.</p><p>Which choice best describes data from the table that support Rodriguez and colleagues’ assertion?</p><p></p><p>A) <span>None of the planets have an orbital period of more than 10 days, and TOI-628 b has a mass of 6.33 Jupiters</span></p><p><span>B) TOI-1478 b has an orbital period of 153 days, and the masses of all the planets range from 0.85 to 6.33 Jupiters</span></p><p><span>C) All the planets have a radius between 1.060 and 1.771 Jupiters, and only TOI-1333 b has an orbital period of more than 10 days</span></p><p><span>D) Each of the planets has a mass greater than 0.25 Jupiters, and all except for TOI-1478 b have an orbital period of less than 10 days</span></p>

“Hot Jupiters” are gas planets that have a mass of at least 0.25 Jupiters (meaning that their mass is at least 25% of that of Jupiter) and an orbital period of less than 10 days (meaning that they complete one orbit around their star in less than 10 days), while “warm Jupiters” are gas planets that meet the same mass criterion but have orbital periods of more than 10 days. In 2021, Michigan State University astronomer Joseph Rodriguez and colleagues announced the discovery of five new gas exoplanets and asserted that four are hot Jupiters and one is a warm Jupiter.

Which choice best describes data from the table that support Rodriguez and colleagues’ assertion?


A) None of the planets have an orbital period of more than 10 days, and TOI-628 b has a mass of 6.33 Jupiters

B) TOI-1478 b has an orbital period of 153 days, and the masses of all the planets range from 0.85 to 6.33 Jupiters

C) All the planets have a radius between 1.060 and 1.771 Jupiters, and only TOI-1333 b has an orbital period of more than 10 days

D) Each of the planets has a mass greater than 0.25 Jupiters, and all except for TOI-1478 b have an orbital period of less than 10 days

D because TOI-1478 is the only planet with an orbit of more than 10 days, meaning it’s the only warm Jupiter

3
New cards
<p></p>


D because it’s the only option comparing two separate jobs that people think robots can do

4
New cards
term image

A because it’s the only option talking about crop yields increasing, implying that the increased investment in irrigation helped it grow
5
New cards
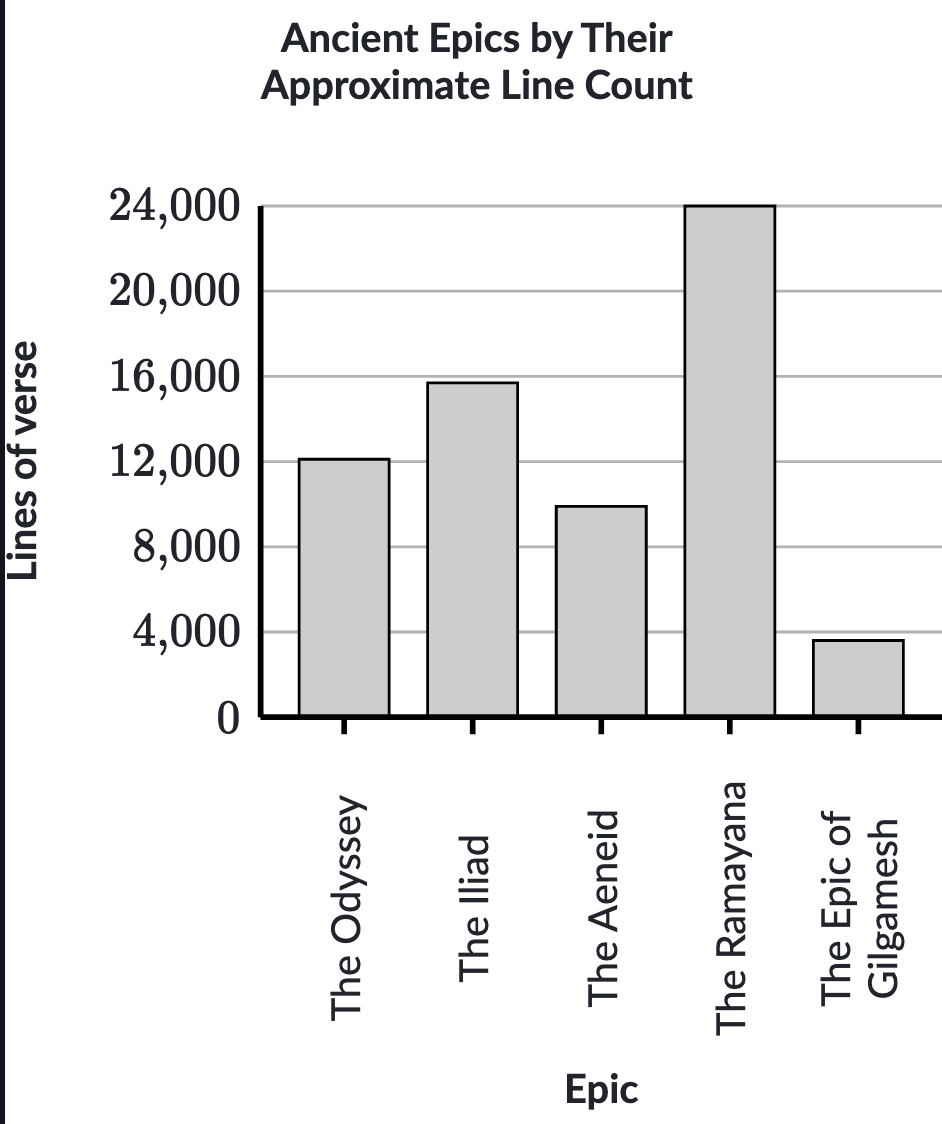
<p>The <em>Ramayana</em>, composed in Sanskrit and dated variously from 500 BCE to 100 BCE, is one of the most influential epics in world literature. It is often compared to the <em>Iliad</em> and the <em>Odyssey</em>, the classical Greek epics that depict the Trojan War and its aftermath. All three epics explore themes such as love, loyalty, and the struggle between good and evil, and feature a range of divine and human characters. However, the <em>Ramayana</em> ______</p><p></p><p>A) <span>is longer than both the </span><em>Iliad</em><span> and the </span><em>Odyssey</em><span>, as it contains about 24,000 lines of verse, while the </span><em>Iliad</em><span> and the </span><em>Odyssey</em><span> contain about 16,000 and 12,000 lines respectively.</span></p><p><span>B) is closer in length to the </span><em>Aeneid</em><span>, another notable work of ancient Greek literature, which contains about 9,800 lines of verse.</span></p><p><span>C) Is slightly shorter than the </span><em>Iliad</em><span>, which contains about 16,000 lines of verse, but is longer than the </span><em>Odyssey</em><span>, which contains about 12,000 lines of verse.</span></p><p><span>D) is significantly shorter than both the </span><em>Iliad</em><span> and the </span><em>Odyssey</em><span>, as it contains only 3,600 lines of verse, while the </span><em>Iliad</em><span> and the </span><em>Odyssey</em><span> contain about 16,000 and 12,000 lines respectively.</span></p>

The Ramayana, composed in Sanskrit and dated variously from 500 BCE to 100 BCE, is one of the most influential epics in world literature. It is often compared to the Iliad and the Odyssey, the classical Greek epics that depict the Trojan War and its aftermath. All three epics explore themes such as love, loyalty, and the struggle between good and evil, and feature a range of divine and human characters. However, the Ramayana ______


A) is longer than both the Iliad and the Odyssey, as it contains about 24,000 lines of verse, while the Iliad and the Odyssey contain about 16,000 and 12,000 lines respectively.

B) is closer in length to the Aeneid, another notable work of ancient Greek literature, which contains about 9,800 lines of verse.

C) Is slightly shorter than the Iliad, which contains about 16,000 lines of verse, but is longer than the Odyssey, which contains about 12,000 lines of verse.

D) is significantly shorter than both the Iliad and the Odyssey, as it contains only 3,600 lines of verse, while the Iliad and the Odyssey contain about 16,000 and 12,000 lines respectively.

A because all of the other choices are very untrue
6
New cards
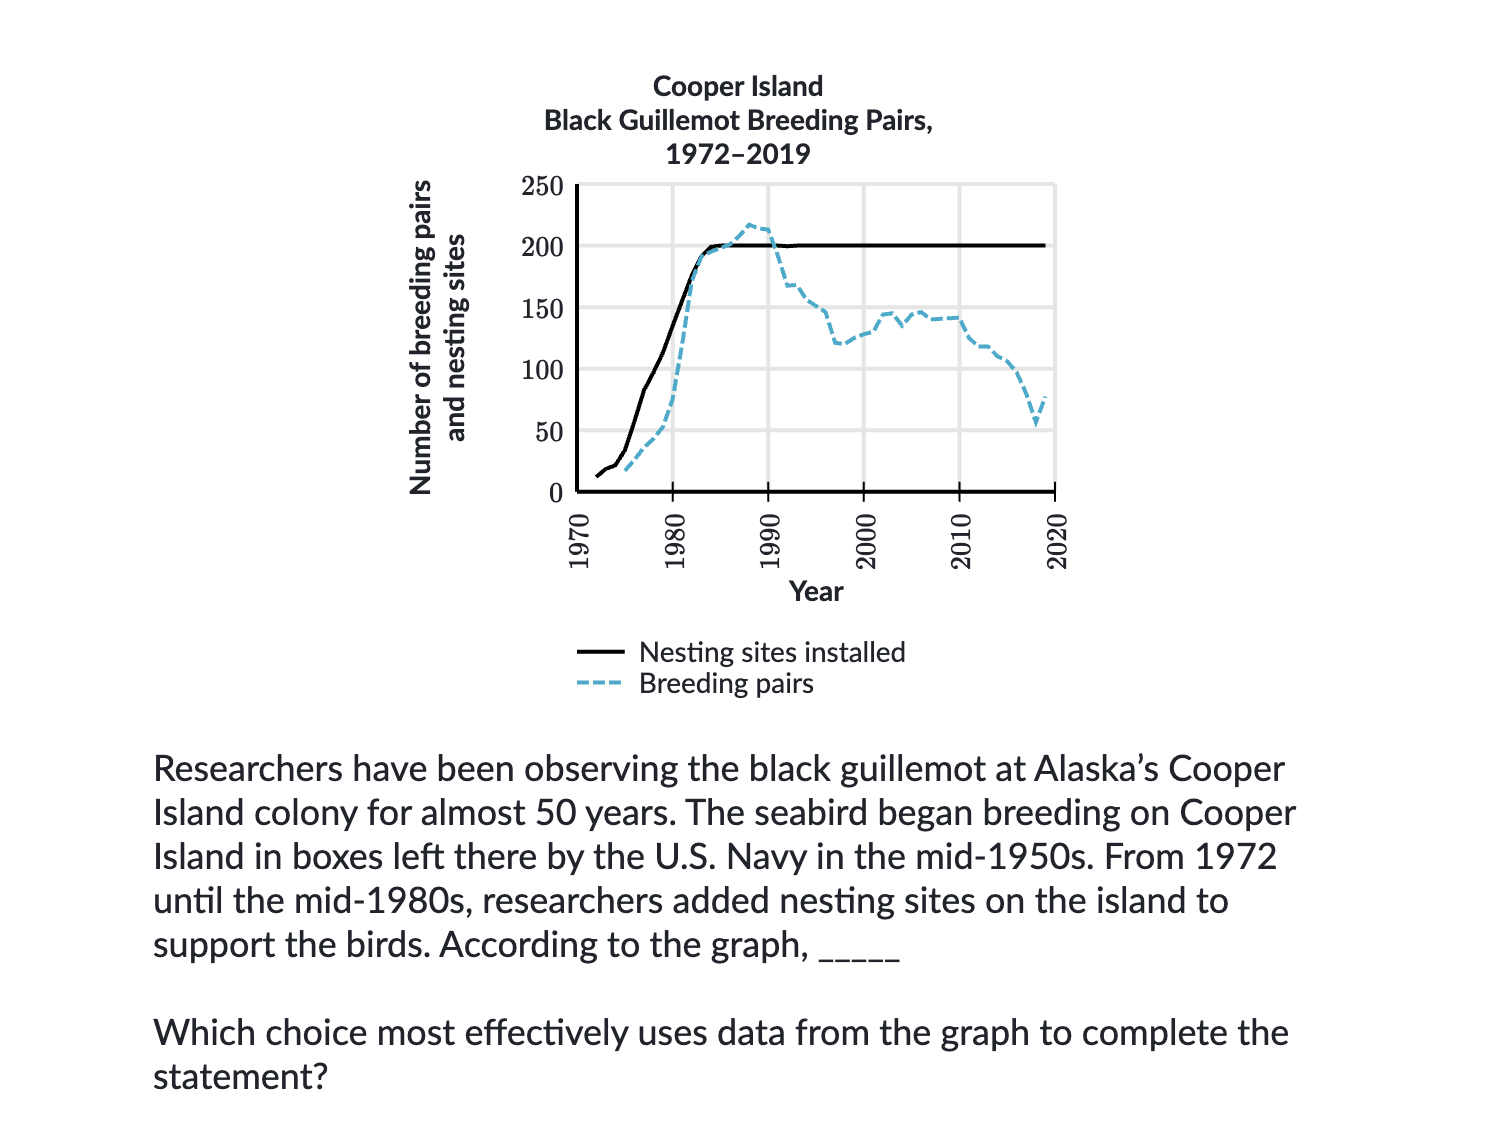
<p>A) <span>while both the number of nesting sites and the number of breeding pairs remained the same until the early 1990s, the number of breeding pairs exceeded the number of available nesting sites thereafter</span></p><p><span>B) because the number of nesting sites peaked at 200 in the late 1980s, the number of breeding pairs dropped to fewer than 90 when the study concluded in 2019</span></p><p><span>C) despite a consistent number of available nesting sites after the mid-1980s, after the early 1990s the number of breeding pairs remained below the number of available nesting sites</span></p><p><span>D) although the number of breeding pairs rapidly increased until the early 1980s, those numbers leveled off as the number of available nesting sites stabilized</span></p>

A) while both the number of nesting sites and the number of breeding pairs remained the same until the early 1990s, the number of breeding pairs exceeded the number of available nesting sites thereafter

B) because the number of nesting sites peaked at 200 in the late 1980s, the number of breeding pairs dropped to fewer than 90 when the study concluded in 2019

C) despite a consistent number of available nesting sites after the mid-1980s, after the early 1990s the number of breeding pairs remained below the number of available nesting sites

D) although the number of breeding pairs rapidly increased until the early 1980s, those numbers leveled off as the number of available nesting sites stabilized

C
7
New cards
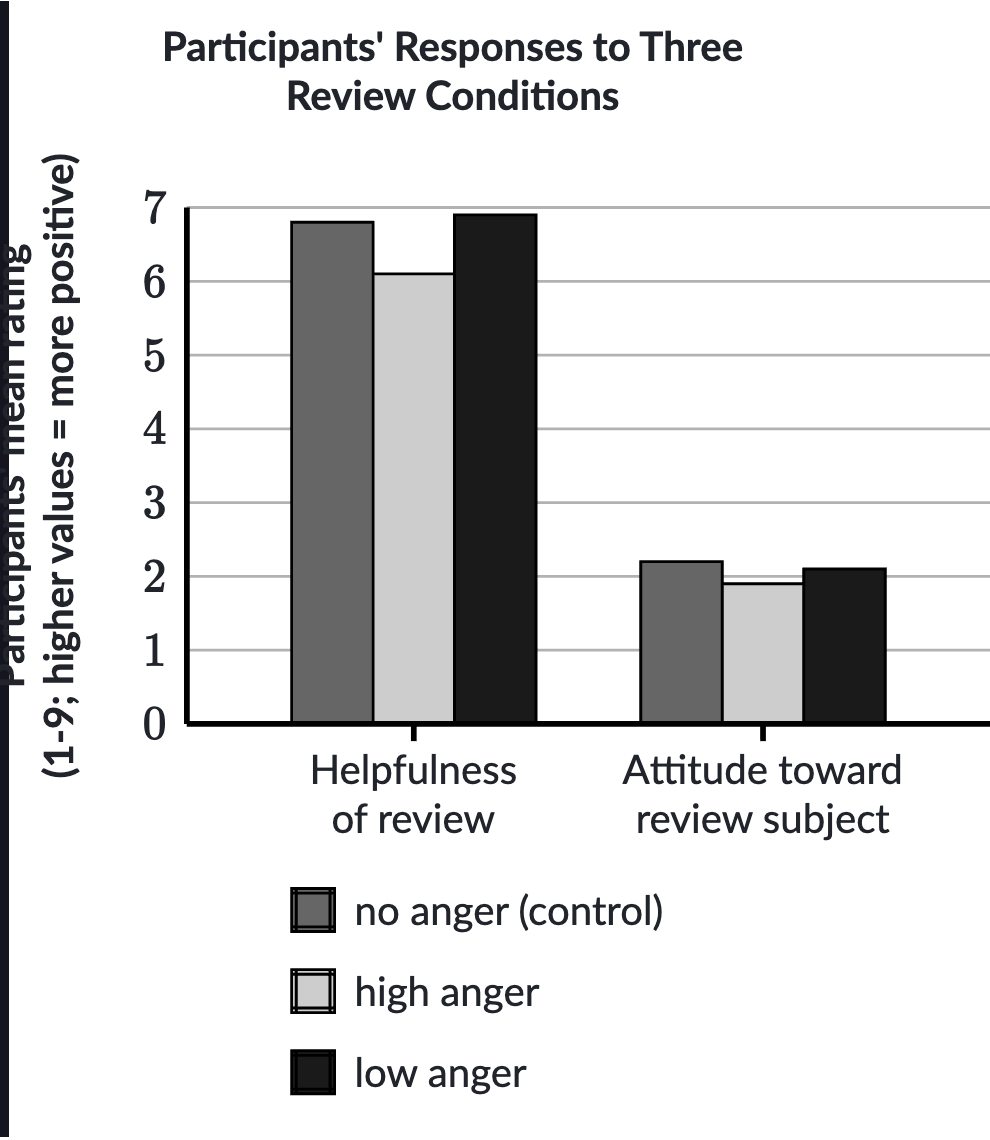
<p>To understand how expressions of anger in reviews of products affect readers of those reviews, business scholar Dezhi Yin and colleagues measured study participants’ responses to three versions of the same negative review—a control review expressing no anger, a review expressing a high degree of anger, and a review expressing a low degree of anger. Reviewing the data, a student concludes that the mere presence of anger in a review may not negatively affect readers’ perceptions of the review, but a high degree of anger in a review does worsen readers’ perceptions of the review.</p><p>Which choice best describes data from the graph that support the student’s conclusion?</p><p></p><p>A) <span>On average, participants’ ratings of the helpfulness of the review were substantially higher than were participants’ ratings of the reviewed product regardless of which type of review participants had seen</span></p><p><span>B) Compared with participants who saw the control review, participants who saw the low-anger review rated the review as slightly more helpful, whereas participants who saw the high-anger review rated the review as less helpful</span></p><p><span>C) Participants who saw the low-anger review rated the review as slightly more helpful than participants who saw the control review did, but participants’ attitude toward the reviewed product was slightly worse when participants saw the low-anger review than when they saw the no-anger review</span></p><p><span>D) Compared with participants who saw the low-anger review, participants who saw the high-anger review rated the review as less helpful and had a less positive attitude toward the reviewed product</span></p>

To understand how expressions of anger in reviews of products affect readers of those reviews, business scholar Dezhi Yin and colleagues measured study participants’ responses to three versions of the same negative review—a control review expressing no anger, a review expressing a high degree of anger, and a review expressing a low degree of anger. Reviewing the data, a student concludes that the mere presence of anger in a review may not negatively affect readers’ perceptions of the review, but a high degree of anger in a review does worsen readers’ perceptions of the review.

Which choice best describes data from the graph that support the student’s conclusion?


A) On average, participants’ ratings of the helpfulness of the review were substantially higher than were participants’ ratings of the reviewed product regardless of which type of review participants had seen

B) Compared with participants who saw the control review, participants who saw the low-anger review rated the review as slightly more helpful, whereas participants who saw the high-anger review rated the review as less helpful

C) Participants who saw the low-anger review rated the review as slightly more helpful than participants who saw the control review did, but participants’ attitude toward the reviewed product was slightly worse when participants saw the low-anger review than when they saw the no-anger review

D) Compared with participants who saw the low-anger review, participants who saw the high-anger review rated the review as less helpful and had a less positive attitude toward the reviewed product

B because it’s the one directly comparing the low-anger and high-anger reviews
8
New cards
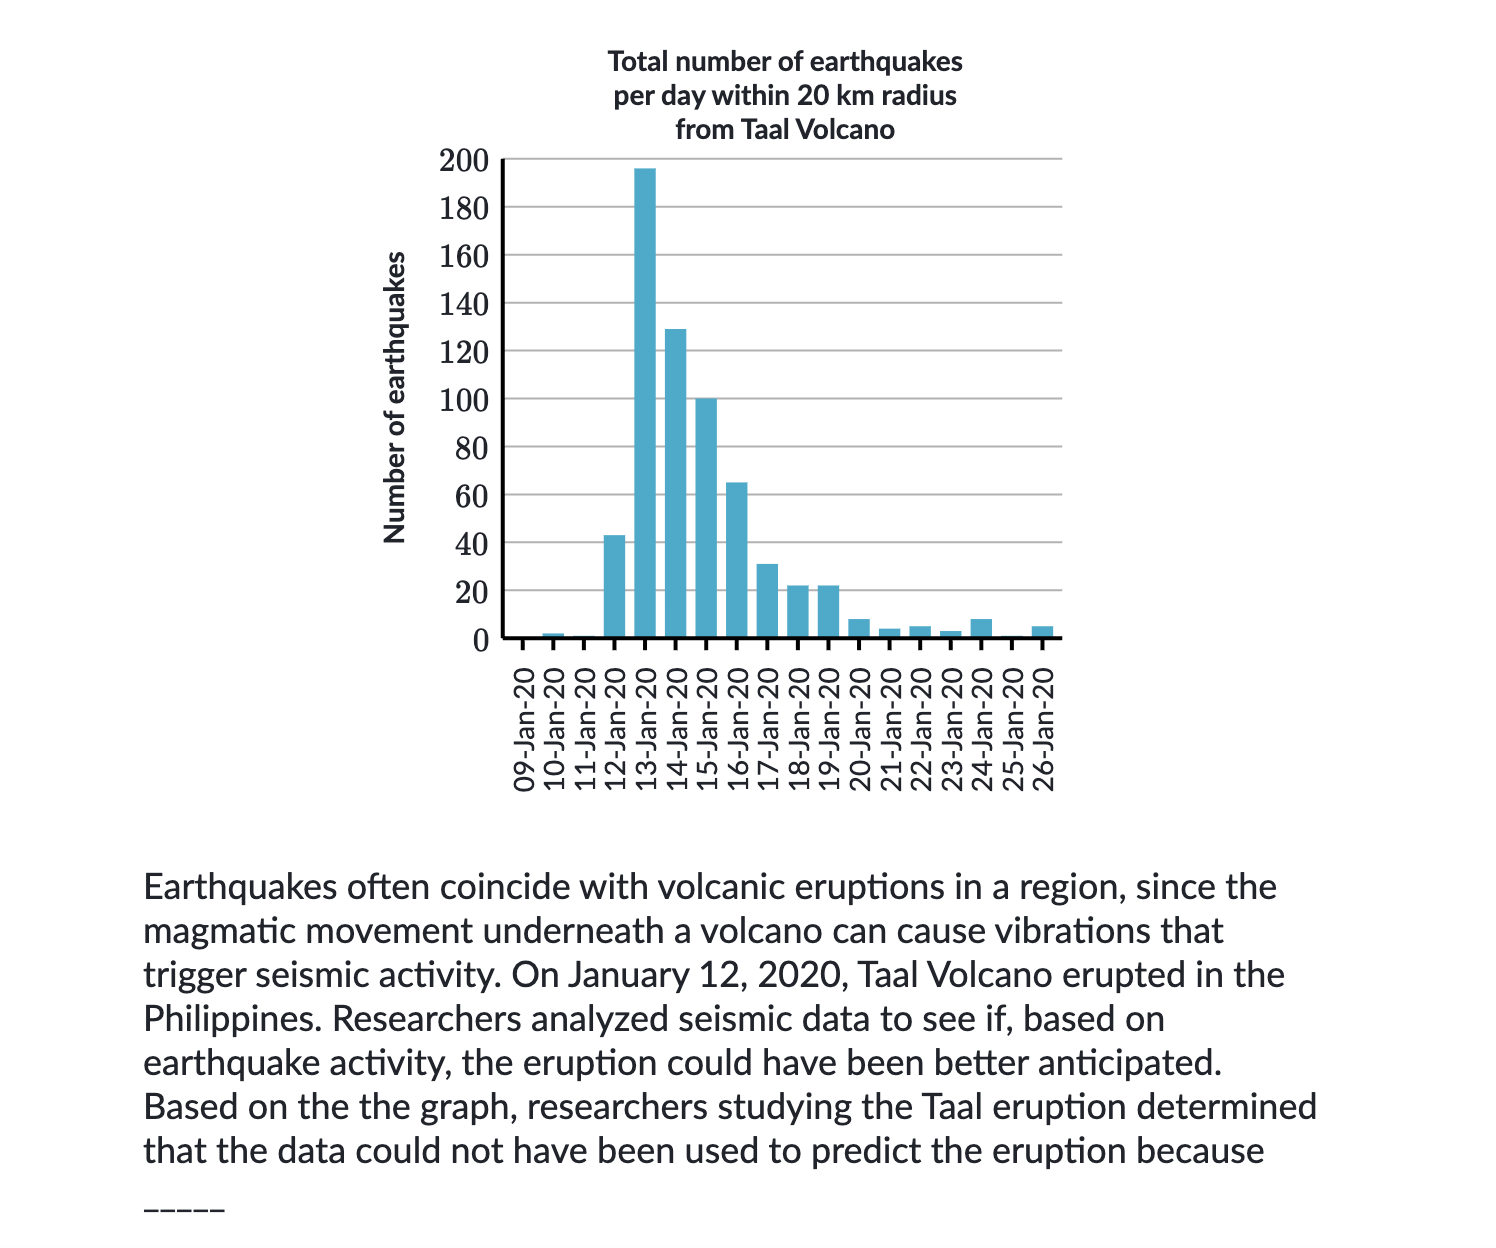
<p>A) <span>there were earthquakes all during the month of January 2020</span></p><p><span>B) earthquake activity increased only after Taal erupted</span></p><p><span>C) the strongest earthquake happened when Taal erupted, with subsequent earthquakes decreasing in magnitude</span></p><p><span>D) nearly 200 earthquakes were recorded at Taal Volcano on a single day, while earthquakes that followed were traced to locations farther away</span></p>

A) there were earthquakes all during the month of January 2020

B) earthquake activity increased only after Taal erupted

C) the strongest earthquake happened when Taal erupted, with subsequent earthquakes decreasing in magnitude

D) nearly 200 earthquakes were recorded at Taal Volcano on a single day, while earthquakes that followed were traced to locations farther away

B because many earthquakes DID happen after Taal erupted before eventually decreasing again

9
New cards
<p>All other things being equal, the larger a wind turbine’s rotor diameter (the diameter of the imaginary circle swept by the turbine’s rotating blades), the greater amount of energy the turbine can generate. In a research paper on wind power, a student claims that in the United States, the amount of energy generated per newly installed turbine increased substantially between 2011 and 2021.</p><p>Which choice best describes data in the graph that support the student’s claim?</p><p></p><p>A) <span>In 2011, nearly 80% of turbines installed had rotor diameters of less than 100 meters, whereas only a little more than 20% of turbines installed that year had rotor diameters of 100–115 meters</span></p><p><span>B) No turbines installed in 2011 had rotor diameters greater than 115 meters, whereas the majority of turbines installed in 2021 had rotor diameters greater than 130 meters</span></p><p><span>C) Most turbines installed in 2011 had rotor diameters of less than 100 meters, whereas most turbines installed in 2021 had rotor diameters of at least 115 meters</span></p><p><span>D) The percentage of newly installed turbines with rotor diameters greater than 130 meters increased every year between 2011 and 2021</span></p>

All other things being equal, the larger a wind turbine’s rotor diameter (the diameter of the imaginary circle swept by the turbine’s rotating blades), the greater amount of energy the turbine can generate. In a research paper on wind power, a student claims that in the United States, the amount of energy generated per newly installed turbine increased substantially between 2011 and 2021.

Which choice best describes data in the graph that support the student’s claim?


A) In 2011, nearly 80% of turbines installed had rotor diameters of less than 100 meters, whereas only a little more than 20% of turbines installed that year had rotor diameters of 100–115 meters

B) No turbines installed in 2011 had rotor diameters greater than 115 meters, whereas the majority of turbines installed in 2021 had rotor diameters greater than 130 meters

C) Most turbines installed in 2011 had rotor diameters of less than 100 meters, whereas most turbines installed in 2021 had rotor diameters of at least 115 meters

D) The percentage of newly installed turbines with rotor diameters greater than 130 meters increased every year between 2011 and 2021

C

10
New cards
<p>Flint artifacts dating to 800,000 to 1,000,000 years ago have been recovered from the Evron Quarry in Israel. Likely created by the hominin <em>Homo erectus</em>, the artifacts have no visual features suggesting that they were exposed to fire, leading some scholars to conclude that these hominins had not acquired control of fire. But Zane Stepka and colleagues recently used a new method to determine whether these artifacts had been exposed to temperatures above 400°C (the typical temperature campfires reach) and concluded that the hominins who inhabited the site may have had control of fire.</p><p>Which choice best describes data in the graph that support the team’s conclusion?</p><p></p><p>A) <span>All of the artifacts were exposed to temperatures above 100°C</span></p><p><span>B) Artifacts L5_239 and K3_18 were exposed to temperatures of approximately 550°C and 650°C, respectively</span></p><p><span>C) Artifact K3_9 was exposed to a higher temperature than was artifact K5_106</span></p><p><span>D) Artifacts K5_106 and K3_9 were exposed to temperatures above 400°C</span></p>

Flint artifacts dating to 800,000 to 1,000,000 years ago have been recovered from the Evron Quarry in Israel. Likely created by the hominin Homo erectus, the artifacts have no visual features suggesting that they were exposed to fire, leading some scholars to conclude that these hominins had not acquired control of fire. But Zane Stepka and colleagues recently used a new method to determine whether these artifacts had been exposed to temperatures above 400°C (the typical temperature campfires reach) and concluded that the hominins who inhabited the site may have had control of fire.

Which choice best describes data in the graph that support the team’s conclusion?


A) All of the artifacts were exposed to temperatures above 100°C

B) Artifacts L5_239 and K3_18 were exposed to temperatures of approximately 550°C and 650°C, respectively

C) Artifact K3_9 was exposed to a higher temperature than was artifact K5_106

D) Artifacts K5_106 and K3_9 were exposed to temperatures above 400°C

B because these two artifacts are the ones that faced the highest temperatures, showing that they may have had control of fire



