STSCI 2150 Quick Review
0.0(0)
Studied by 3 peopleCard Sorting
1/6
Earn XP
Description and Tags
Last updated 7:46 AM on 12/12/22
Name | Mastery | Learn | Test | Matching | Spaced | Call with Kai |
|---|
No analytics yet
Send a link to your students to track their progress
7 Terms
1
New cards
The F-statistic is calculated using the (sum of squares/mean squares).
mean squares
2
New cards
How do you get SST?
Add SSG and SSE.
3
New cards
What is the df in a linear regression test?
n - 2
4
New cards
What does SSG measures?
SSG is the sum of squares group, which is when the three means are each compared to the overall mean. Thus, the sum of squares group measure the variability in observation that is attributable to the differences in treatment groups.
5
New cards
What does SSE measure?
SSE is the sum of squares error, which measures the variability in observation that cannot be explained by differences in treatment group.
6
New cards
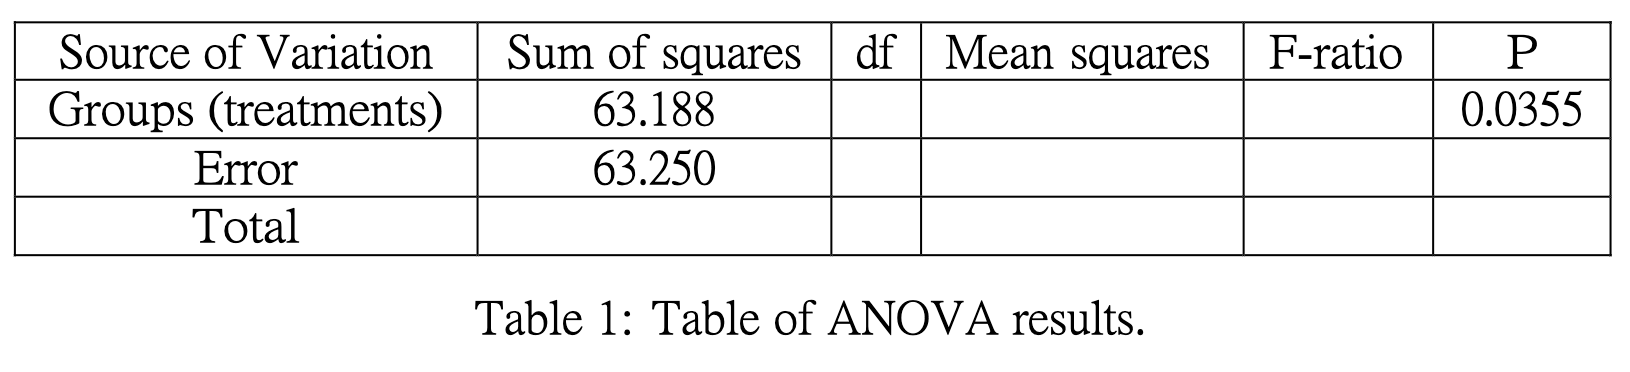
Describe how to get the value for each blank space in the table.
The SST is found by adding the SSE and SSG.
The df(group) is found by # groups - 1.
The df(error) is found by df(total)-df(group).
The df(total) is found by # obs - 1.
The mean squares group is found by SSG/df(group).
The mean squares error is found by SSE/df(error).
The F-statistic is found by doing MSG/MSE.
\
\*\*There is no mean squares total!
7
New cards
What is the mathematical meaning of the least squares regression line?
The least squares regression line minimizes the squared distance between each data point and the line (the difference between the predicted Y value and the observed Y value).